Motivating Diabetic and Hypertensive Patients to Increase Physical Activity: The Use
of Photos and Group Dynamics
Angela Yee Man Leung1,*, Pui Hing Chau2, Isaac Leung 1, Michael Tse3, Perick Lai Choi Wong, 4 Wai Ming Tam 4
1 Centre for Geronotological Nursing (CGN), School of Nursing, The Hong Kong Polytechnic University, Hong Kong, China
2 School of Nursing, The University of Hong Kong, Hong Kong, China
3 Institute of Human Performance, The University of Hong Kong, Hong Kong, China
4 Hong Kong Sheng Kung Hui Welfare Council Western District Elderly Community Centre, Hong Kong, China
*Corresponding author: Angela Y. M. Leung, Associate Professor, 5/F, School of Nursing, The Hong Kong Polytechnic University, Hong Kong; Phone: (852) 2766 5587, Fax: (852) 2364 9663, Email: [email protected]
Abstract
Aims: Photovoice is a strategy to allow people to express their views and concerns about health. This project aimed to promote physical activity (PA) among patients with chronic illness, identify facilitators and barriers for PA, enhance walking within the neighbourhood, and build up efficacy in doing exercise.
Design: A quasi-experimental study with waitlisted control and pre-and-post measures. Setting: Community elderly centres.
Participants: A total of 204 older adults with diabetes and/or hypertension were recruited. They were assigned to either intervention group (IG) or waitlisted control group (CG). Intervention: Under the supervision of a nurse, six weekly group meetings were arranged in community elderly centres in which the participants freely exchanged their views about the barriers and facilitators of regular physical activity. Participants were encourage to take photos in their neighbourhood or at homes, and brought these photos for sharing in the group meetings. The photos showed the barriers and the facilitators to PA. In the last meeting, each participant worked out a plan to perform PA in the coming four weeks.
Measures: PA referred to the number of steps taken per day and it was measured by Garmin Accelerometer at baseline, at Week 6 and Week 10. Other measures include the 9-item Self-efficacy Scale for Exercise - Chinese version (SEE-C), the 23-item Chinese Barriers to Exercise Scale and Senior Fitness Tests. General linear mixed model was used to compare the outcomes between IG and CG after the intervention.
SE=0.066, p<0.05). The lower body strength of the IG participants was significantly higher than that of the CG (mean difference = 0.94, t=1.957, p<0.05) and the lower limb flexibility of the IG participants was also significantly higher than that of the CG (mean difference = 2.04, t=2.397, p<0.05) at Week 10.
Conclusion: Understanding older adults’ views and thoughts about barriers to PA through photos and group discussion seemed to be a good strategy to motivate older adults with chronic illnesses to commit to regular physical activity. This photovoice intervention improved the participants’ physical activity level and physical fitness, particularly in lower limb flexibility and body strength.
1. Introduction
Photovoice, a health literacy tool, has received growing attention in health promotion and health education since its development in the mid-1990s [1]. It is a community-based participatory method, using the social-ecological model of health, to uncover health problems [2]. Such method encourages participants to explore, consider how environment affects ones’ health behaviour and share their views. Using photos or pictures, participants reflected on their own lifestyles, identified the pros and cons of the existing behaviour, eventually fostered positive attitude towards healthy lifestyles and made necessary changes in behaviour [2-4]. Photovoice has been used in various studies in a range of populations, for example, youth and older adults in Canada [4, 5], community-dwellers in America [6], rural older women[7], indigenous people [3] and new immigrants [8]. Various health topics were covered in previous photovoice studies, such as healthy eating and accessibility of healthy food choices [6, 7], and HIV/sexually transmitted disease [3]. After reviewing 37 papers on the use of photovoice in different health promotion settings, it was also concluded that photovoice contributed to the better understanding of individuals’ behaviour and explained the relationship between behaviour and sociocultural context [9]. With the existing evidences, we were ascertained that photovoice could support individual growth and empowerment. Nonetheless, these previous studies were qualitative studies, which showed the process of the use of photos in behavioural change and its impacts on psychosocial health. Little is known about the effect of photovoice on physical health and actual behaviour in daily lives over time.
programme aimed to motivate sedentary diabetic and/or hypertensive older adults to do physical activity regularly by identifying facilitators and barriers to physical activity. ‘Facilitators’ refer to the factors that made the participants engaged in physical activity while ‘barriers’ refer to the factors deterred for doing favourable physical activity [7]. We hypothesized that this intervention would increase the participants’ physical activity level, physical fitness and self-efficacy to do exercise.
2. Materials and methods
2.1 Design and participants
This was a quasi-experimental study with a waitlist control and a pre-and-post design. Participants were recruited from four community elderly centres via their newsletters, monthly meetings and promotional booths in the neighbourhood from April 2014 to March 2016. Inclusion criteria of the participants were: 1) aged 55 or above; 2) diagnosed with type 2 diabetes mellitus and/or hypertension; 3) able to ambulate independently; and 4) able to communicate in Cantonese. The recruited participants were split into two groups: intervention group (IG) and control group (CG). Waitlist control design was used so that even the participants in the CG could also receive the intervention after completing all measurements in the study. This was a favourable strategy for community-based projects because the participants in the CG did not feel being discriminated or at disadvantage. In this study, both IG and CG participants received the 6-week intervention.
2.2 Six-Week Intervention
photos, and 5) formulating action plans for physical activity commitment. The group meetings were arranged for three purposes: a) building up the participants’ self-efficacy in exercise; b) enabling them to identify and review the facilitators and barriers to physical activities through discussion in a group; and c) setting individualized goals in exercise plan. Each meeting normally lasted for one hour and was arranged under the supervision of a nurse so that the participants could freely exchange their views about regular physical activity based on the pre-designed pictorial storybook and their own photos taken around their living environment. A health-and-fitness officer was also involved in one meeting to rectify the myths of physical exhaustion and guide the participants to do warm up exercise which prevented unnecessary injury in physical activity. In the last group meeting, participants set up individualized action plans (including goals and timetables) for physical activity in the next four weeks.
2.3 Outcomes and health assessment
The primary outcome was the number of steps taken per day. It was measured by accelerometers at baseline (Week 0), right after the six-week intervention (Week 6), and four weeks after the intervention (Week 10). Each participant was invited to wear an accelerometer for 5 days (with 24 hours per day) in each of the specific weeks. The data was automatically stored in a highly secured server. The trained research assistant retrieved the data by using a password.
and Week 10. Demographics which include sex, age, marital status, educational level, employment status, districts in which they live in, living status, health literacy and types of chronic illnesses were collected.
2.4 Ethical statement
All subjects gave their informed written consent for inclusion before they participated
in the study. The study was conducted in accordance with the Declaration of Helsinki, and the
protocol was approved by the Institutional Review Board of the University of Hong
Kong/Hospital Authority Hong Kong West Cluster (HKU/HA HKW IRB) (reference
number: UW14-447)
2.5 Data analysis
Descriptive statistics, including numbers, percentages, means and standard deviation, were performed on demographics, number of steps taken daily, self-efficacy and barriers for doing exercise.Paired t-tests were used to compare the changes of mean scores of the physical fitness variables, the total score of SEE-C and CBES before and after the intervention within groups and between groups (IG and CG). General linear mixed models (GLMM) were used to assess the intervention effect on physical fitness variables. Considering participants’ age has effects on physical fitness variables (except Arm Curl Test), we adjusted ‘age’ in the GLMM models except Arm Curl Test.
and team’s study [12] and Richardson and team’s study [13], showed the feasibility of the use of pedometers among community-dwelling older adults. In Richardson and team’s study [13], its population (persons with diabetes) was similar to the targeted population of the current study. It was reported that the average number of steps taken daily was increased by 1014 steps after the 6-week intervention, with Cohen’s d=0.58 [13]. Therefore, the number of steps per day that was slightly higher than 1,000 seemed to be a reasonable cut-off point to determine whether a person with a chronic illness (for example, diabetes) had increased his/her physical activity intensity. With this consideration, we used GLMM with logistic link function to assess the intervention effect. A dummy variable was set up for this: for those who increased their average number of steps per day by 1,200 steps or more, it scored ‘1’; otherwise, it scored ‘0’.
3. Results
3.1. Descriptive statistics
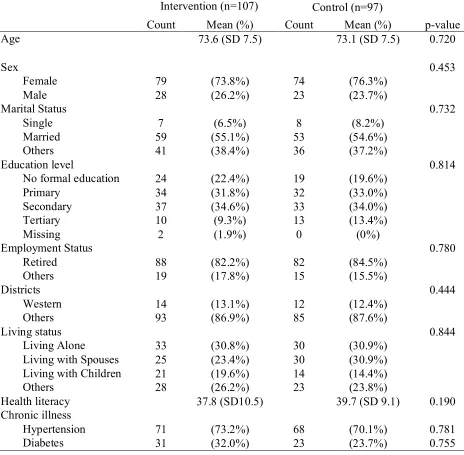
Table 1. Participants’ Demographics
Intervention (n=107) Control (n=97)
Count Mean (%) Count Mean (%) p-value
Age 73.6 (SD 7.5) 73.1 (SD 7.5) 0.720
Sex 0.453
Female 79 (73.8%) 74 (76.3%)
Male 28 (26.2%) 23 (23.7%)
Marital Status 0.732
Single 7 (6.5%) 8 (8.2%)
Married 59 (55.1%) 53 (54.6%)
Others 41 (38.4%) 36 (37.2%)
Education level 0.814
No formal education 24 (22.4%) 19 (19.6%)
Primary 34 (31.8%) 32 (33.0%)
Secondary 37 (34.6%) 33 (34.0%)
Tertiary 10 (9.3%) 13 (13.4%)
Missing 2 (1.9%) 0 (0%)
Employment Status 0.780
Retired 88 (82.2%) 82 (84.5%)
Others 19 (17.8%) 15 (15.5%)
Districts 0.444
Western 14 (13.1%) 12 (12.4%)
Others 93 (86.9%) 85 (87.6%)
Living status 0.844
Living Alone 33 (30.8%) 30 (30.9%)
Living with Spouses 25 (23.4%) 30 (30.9%)
Living with Children 21 (19.6%) 14 (14.4%)
Others 28 (26.2%) 23 (23.8%)
Health literacy 37.8 (SD10.5) 39.7 (SD 9.1) 0.190
Chronic illness
Hypertension 71 (73.2%) 68 (70.1%) 0.781
3.2 Evaluation of the MCPv program
3.2.1 Physical Activity (PA) – Average Number of Steps Per Day
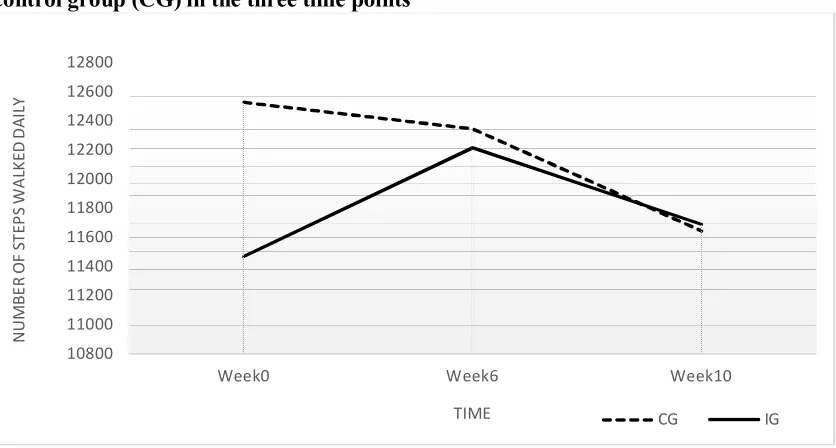
The average number of steps taken per day was measured at three time points (Week 0, Week 6, and Week 10).At Week 0, the average number of steps taken by the IG participants were lower than that of CG (IG: mean (SD) = 11466 (440.47); CG: mean (SD) = 12526 (520.36)). After the intervention (at Week 6), the average number of steps taken by the IG participants increased, mean (SD) = 12211 (501.81) while the steps taken by the CG participants decreased, mean (SD) = 12343 (590.11). At Week 10, the average number of steps taken by the IG reduced, mean (SD) = 11686 (495.05) but we observed the drop of the average number of steps taken by CG was much deeper, mean (SD) = 11643 (558.64). Figure 1 showed the change of the average number of steps per day between IG and CG at the three time points.
Figure 1. Mean number of steps walked daily between intervention group (IG) and control group (CG) in the three time points
Note. Accelerometers were worn by participants at Week 0 (baseline assessment), Week 6 (right after the intervention) and Week 10 (4 weeks after the intervention)
10800 11000 11200 11400 11600 11800 12000 12200 12400 12600 12800
Week0 Week6 Week10
N U M B E R O F ST EP S W A LK ED D A IL Y
3.2.2 Results of GLMM: change of physical activity level
Table 2 showed the estimated intervention effect on the change of physical activity level (average number of steps per day) at different time points (Week 6 and Week 10) with reference to the baseline. At Week 10, there was a significant higher proportion of the IG participants who had increased at least 1,200 steps (the step criteria) than that of the CG (Estimate=0.151, SE=0.066, p=0.023). The F-statistic (F=3.992, p=0.047) also showed the overall significance of the intervention effect on the probability to achieve the step criteria.
Table 2. The association between groups and the probability of increasing the average number of steps per day by 1,200 steps or more at Week 6 and Week 10
Time Estimates
(IG – CG)
SE t-value p-value
Week 6 0.103 0.076 1.354 0.177
Week 10 0.151 0.066 2.281 0.023
Notes: IG stands for intervention group; CG stands for control group. Reference was made to the average number of steps taken per day at Week 0. Adjusted for age.
3.2.3 Physical fitness
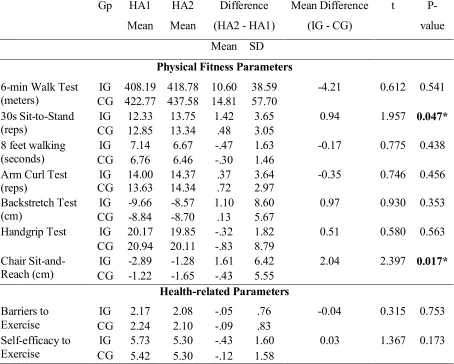
Table 3. Results of Health Assessment between Intervention Group (IG) and Control Group (CG)
Gp HA1 Mean
HA2 Mean
Difference (HA2 - HA1)
Mean Difference (IG - CG)
t
P-value Mean SD
Physical Fitness Parameters
6-min Walk Test (meters)
IG 408.19 418.78 10.60 38.59 -4.21 0.612 0.541 CG 422.77 437.58 14.81 57.70
30s Sit-to-Stand (reps)
IG 12.33 13.75 1.42 3.65 0.94 1.957 0.047*
CG 12.85 13.34 .48 3.05 8 feet walking
(seconds)
IG 7.14 6.67 -.47 1.63 -0.17 0.775 0.438
CG 6.76 6.46 -.30 1.46 Arm Curl Test
(reps)
IG 14.00 14.37 .37 3.64 -0.35 0.746 0.456
CG 13.63 14.34 .72 2.97 Backstretch Test
(cm)
IG -9.66 -8.57 1.10 8.60 0.97 0.930 0.353
CG -8.84 -8.70 .13 5.67
Handgrip Test IG 20.17 19.85 -.32 1.82 0.51 0.580 0.563 CG 20.94 20.11 -.83 8.79
Chair Sit-and-Reach (cm)
IG -2.89 -1.28 1.61 6.42 2.04 2.397 0.017*
CG -1.22 -1.65 -.43 5.55
Health-related Parameters
Barriers to Exercise
IG 2.17 2.08 -.05 .76 -0.04 0.315 0.753
CG 2.24 2.10 -.09 .83 Self-efficacy to
Exercise
IG 5.73 5.30 -.43 1.60 0.03 1.367 0.173
CG 5.42 5.30 -.12 1.58
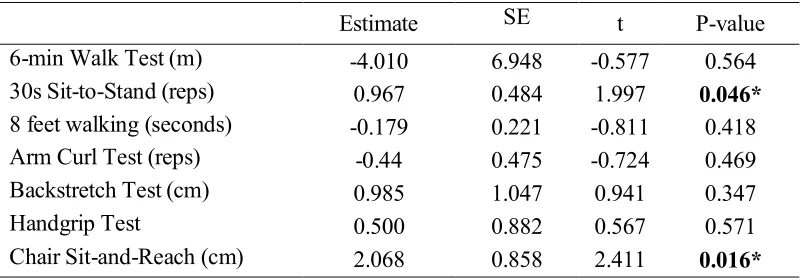
Table 4. Comparison of Physical Fitness Parameters between Intervention Group (IG) and Control Group (CG) after the Intervention using GLMM Models
Estimate SE t P-value
6-min Walk Test (m) -4.010 6.948 -0.577 0.564
30s Sit-to-Stand (reps) 0.967 0.484 1.997 0.046*
8 feet walking (seconds) -0.179 0.221 -0.811 0.418
Arm Curl Test (reps) -0.44 0.475 -0.724 0.469
Backstretch Test (cm) 0.985 1.047 0.941 0.347
Handgrip Test 0.500 0.882 0.567 0.571
Chair Sit-and-Reach (cm) 2.068 0.858 2.411 0.016* Notes. Adjusted for age.
3.2.4 Self-efficacy
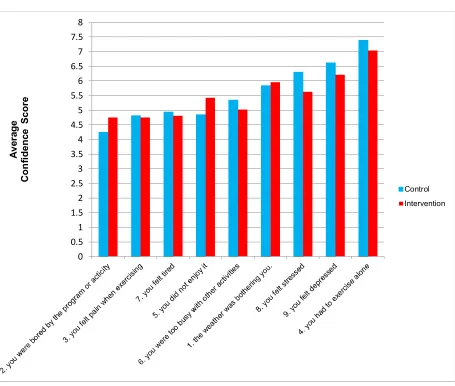
Figure 2. Participants’ self-efficacy to perform physical activity
4. Discussion
This 6-week photovoice intervention (the MCPv program) increased the IG participants’ average number of steps taken daily at Week 6 and increased their physical activity level at Week 10. The performance of the IG participants outweighed that of the participants in the control group. After participating the intervention, the participants were able to raise their physical activity level (with at least 1,200 steps more than their baseline) at Week 10. This showed that this intervention had not only an immediate effect but also a
term effect on physical activity. After participating the intervention, the participants’ lower body strength and flexibility were also improved. This finding showed that photovoice was an effective health promotion strategy to improve physical fitness of patients with diabetes or hypertension. Photo-taking, group discussion, self-reflection, skills training and action plans formed a comprehensive, effective strategy to encourage older adults with chronic illnesses to perform regular physical activities.
This intervention did not improve participants’ self-efficacy to exercise or significantly reduced the barriers to physical activities. However, the findings of the current study provided some insights for developing physical activity programmes for older adults. The programme should be developed with fun elements so that participants would not feel bored. The instructors of the programme should observe participants’ pain level during and after the programme, and monitor the duration of the programme to avoid the participants from exhaustion. With this monitoring, older adults with chronic illness would enjoy physical activities and be confident to participate in the activities
provided valuable knowledge about management of chronic diseases and supported self-reflection and group discussion based on the photos. The health-and-fitness officers educated participants how to do exercise safely in one of the weekly group meetings, and conducted physical fitness assessments in the health assessments. Project coordinator assisted the participants how to capture photos with digital cameras (to some older adults, digital cameras were a new technology) and planned a safe route for taking photos in the neighborhood. This multidisciplinary approach seemed to be a key contributing factor to the success of this photovoice intervention.
We also witnessed older adults’ active participation in learning new technology. To our surprise, many of them were interested to learn how to read the accelerometers and how to interpret the figures shown in the accelerometers. To some participants, digital cameras were another kind of new technology. The challenges were: how to retrieve the photos, how to download the photos to the computer and how to project the photos to the screen for sharing. Project coordinator played an important role to support these activities. She talked to each participant, discussed which photos should be taken for sharing, and prepared all photos prior to the group meetings. This alleviated the participants’ stress to share their photos within the group. This support seemed to be essential for operating a photovoice intervention for older adults in the community.
balanced out due to this design. Thus, the change of physical activity was not related to the accelerometer effect.
This study showed that photovoice could be a good way to understand older adults’ views about physical activities. A few photos taken by the participants indicated that road renovation or nearby construction site was one of the barriers to physical activities because they could not get access to the park for doing physical activities due to road block. In view of this comment, government should develop strategies to minimize the duration of road block and develop alternate pathway during renovation period. Although environmental factors may not be the sole barrier to physical activity among older adults [15], further investigation of the impact of environmental factors on physical activities is warrant.
The MCPv programme had several limitations. Firstly, the intensity of physical activities in 4 weeks did not seem to be enough and this may be part of the reasons why the participants’ other physical parameters (such as blood pressure) did not change significantly. The National Institute on Aging recommended that older adults could gain huge benefit from at least 150-minute moderate-intensity endurance activity every week [16]. Thus, in future planning of the other photovoice intervention, emphasis should be made on the intensity of physical activity. Secondly, some data in accelerometers could not be collected because participants refused to wear the accelerometers due to skin irritation, uncomfortable feelings. Thirdly, wearing accelerometers may induce behavioural change so the effect of the intervention did not purely represent the effect of photovoice.
5. Conclusions
Contributors
AYM Leung contributed to the intervention design, study design, data collection, data analysis, interpretation of the findings and finalizing the manuscript. PH Chau contributed to study design, data analysis, interpretation of the findings and drafting the manuscript. I Leung contributed to data collection, data analysis and drafting of the manuscript. M Tse contributed to intervention design, data collection, interpretation of the findings and drafting the manuscript. P Wong contributed to funding application and revision of the manuscript. Tam WM contributed to data collection and revision of the manuscript.
Acknowledgements
Financial disclosure
This project was funded by Health Care and Promotion Fund (project no.: 06130305), Health and Food Bureau of the Hong Kong Special Administrative Region (HKSAR) Government in 2014-2016.
Conflicts of interest
References
1. Wang, C.C. and Y.A. Redwood-Jones, Photovoice ethics: perspectives from Flint Photovoice. Health Educ Behav, 2001. 28(5): p. 560-72.
2. Strack, R.W., et al., Framing photovoice using a social-ecological logic model as a guide. Health Promot Pract, 2010. 11(5): p. 629-36.
3. Markus, S.F., Photovoice for healthy relationships: community-based participatory HIV prevention in a rural American Indian community. Am Indian Alsk Native Ment Health Res, 2012. 19(1): p. 102-23.
4. Mahmood, A., et al., A photovoice documentation of the role of neighborhood physical and social environments in older adults' physical activity in two metropolitan areas in North America. Soc Sci Med, 2012. 74(8): p. 1180-92. 5. Walia, S. and B. Leipert, Perceived facilitators and barriers to physical activity for
rural youth: an exploratory study using photovoice. Rural Remote Health, 2012. 12: p. 1842.
6. Kramer, L., et al., Promoting policy and environmental change usnig photovoice in the Kaiser Permanente Community Health Initiative. Health Promotion Practice, 2010. 11(3): p. 332-339.
7. Neill, C., et al., Using photovoice methodology to investigate facilitators and barriers to food acquisition and preparation by rural older women. J Nutr Gerontol Geriatr, 2011. 30(3): p. 225-47.
8. Haque, N. and B. Eng, Tackling inequity through a photovoice project on the social determinants of health. Global Health Promotion, 2011. 18(1): p. 16-19.
9. Catalani, C. and M. Minkler, Photovoice: a review of the literature in health and public health. Health Educ Behav, 2010. 37(3): p. 424-51.
10. Lee, L.L., et al., A preliminary reliability and validity study of the Chinese version of the self-efficacy for exercise scale for older adults. Int J Nurs Stud, 2009. 46(2): p. 230-8.
11. Chou, K.-L., et al., Barriers to Exercise Scale for Chinese Older Adults. Topics in Geriatric Rehabilitation, 2008. 24(4): p. 295-304.
12. Tudor-Locke, C., et al., How many steps/day are enough? For older adults and special populations. Int J Behav Nutr Phys Act, 2011. 8: p. 80.
13. Richardson, C.R., et al., A randomized trial comparing structured and lifestyle goals in an internet-mediated walking program for people with type 2 diabetes. Int J Behav Nutr Phys Act, 2007. 4: p. 59.
14. Cooper, C., et al., The impact of wearable motion sensing technology on physical activity in older adults. Exp Gerontol. , 2018. 112: p. 9-19.
15. Rai, R., et al., Exploring Factors Associated With Physical Activity in Older Adults: An Ecological Approach. J Aging Phys Act. , 2018. 30(30): p. 1-32.