University of South Carolina
Scholar Commons
Theses and Dissertations
2017
Fluorescence Polarization Measurements To Probe
Alignment Of A Bithiophene Dye In
One-Dimensional Channels Of Self-Assembled
Phenylethynylene Bis-Urea Macrocycle Crystals
Preecha Kittikhunnatham
University of South Carolina
Follow this and additional works at:https://scholarcommons.sc.edu/etd Part of theChemistry Commons
This Open Access Thesis is brought to you by Scholar Commons. It has been accepted for inclusion in Theses and Dissertations by an authorized administrator of Scholar Commons. For more information, please [email protected].
Recommended Citation
Kittikhunnatham, P.(2017).Fluorescence Polarization Measurements To Probe Alignment Of A Bithiophene Dye In One-Dimensional Channels Of Self-Assembled Phenylethynylene Bis-Urea Macrocycle Crystals.(Master's thesis). Retrieved from
F
LUORESCENCEP
OLARIZATIONM
EASUREMENTS TOP
ROBEA
LIGNMENT OF AB
ITHIOPHENED
YE INO
NE-D
IMENSIONALC
HANNELS OFS
ELF-A
SSEMBLEDP
HENYLETHYNYLENEB
IS-U
REAM
ACROCYCLEC
RYSTALSby
Preecha Kittikhunnatham
Bachelor of Science Chulalongkorn University, 2012
Submitted in Partial Fulfillment of the Requirements
For the Degree of Master of Science in
Chemistry
College of Arts and Sciences
University of South Carolina
2017
Accepted by:
Andrew B. Greytak, Director of Thesis
Linda S. Shimizu, Reader
DEDICATION
This thesis is dedicated to my parents, Somphong Kittikhunnatham and Choei
ACKNOWLEDGEMENTS
I would like to thank to my advisor, Dr. Andrew B. Greytak, for his guidance and
supports, which help me achieve a successful graduate student path. In addition, I would
like to thank all of my research collaborators including, Bozumeh Som, Dr. Vitaly
Rassolov, Dr. Matthias Stolte, Dr. Frank Würthner, Dr. Linda S. Shimizu, and Dr. Andrew
B. Greytak, to help me complete the study described in this thesis. Moreover, the study
described in this thesis made use of the South Carolina SAXS Collaborative and the
computer cluster located at department of Chemistry and Biochemistry, University of
South Carolina. Finally, I would like to acknowledge a Development and Promotion of
Science and Technology Talents Project graduate fellowship from the Royal Government
ABSTRACT
This thesis describes the use of polarized fluorescence microscopy to directly probe
guest molecule orientation in bis-urea macrocycle crystals. These macrocycles assemble to
afford one-dimensional (1D) microchannels ∼9 Å in diameter that have previously been
shown to exhibit normal Fickian diffusion and induce selective reactivity among the
confined guest molecules. In the present work, we take advantage of the quasi-1D
morphology of fiber-like microcrystals with the extended dimension corresponding to the
channel axis to measure excitation and emission polarization values for a bithiophene
guest. Guest fluorescence is shown to be polarized along the fiber axis with emission
polarization values up to 0.729, indicating a high degree of orientational order within the
1D channels. The observed behavior is consistent with calculated results for the guest
orientation and electronic transition dipole moment. The results indicate the value of
functional fluorescent probes as a measure of guest confinement in low-dimensional
TABLE OF CONTENTS
Dedication ... iii
Acknowledgements ... iv
Abstract ...v
List of Figures ... vii
Chapter 1 Introduction ...1
Chapter 2 Experimental Methods ...5
Chapter 3 Results and Discussion ...14
Chapter 4 Conclusions ...54
References ...56
Appendix A: Statistical Interpretation of Polarization Measurements ...62
Appendix B: Optimized coordinates for the optimized host-guest complex ...67
LIST OF FIGURES
Figure 1.1 Dye uptake in one-dimensional macrocycle channels ... 4
Figure 2.1 1H NMR spectrum of host 2 ...11
Figure 2.2 13C NMR spectrum of host 2 ...11
Figure 2.3 TGA profile of host crystal activation process ...12
Figure 2.4 Setup for fluorescence polarization microscopy measurements ...13
Figure 3.1 Micrographs of host crystal 2 in various doping conditions ...27
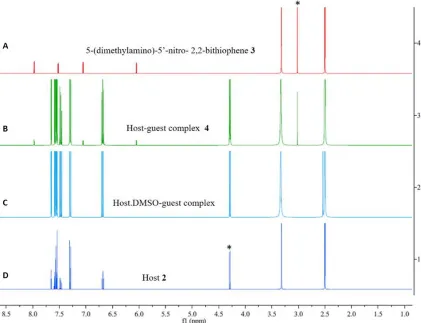
Figure 3.2 1H NMR spectra indicating the inclusion of dye 3 to host fibers 2 ...28
Figure 3.3 Normal-transmission WAXS patterns of 2 and 4 ...29
Figure 3.4 WAXS diffractograms of 2, 4, and 3 versus PXRD pattern of host fibers 2 ....30
Figure 3.5 Solvachromism of 3 (uv-vis absorption) ...31
Figure 3.6 Solvachromism of 3 (photoluminescence) ...32
Figure 3.7 Diffuse reflectance and fluorescence spectra of 2 and 4 ...33
Figure 3.8 Photoluminescence spectra of unactivated host before and after treatment with dye 3 ...34
Figure 3.9 Fluorescence decays host 2 and dye-treated host 2 ...35
Figure 3.10 A model describes orientation of guest 3 in host 2 ...36
Figure 3.11 Optimized structures of dye 3 and host-guest complex 4...37
Figure 3.12 Excitation polarization measurement ...38
Figure 3.13 Emission polarization measurement ...38
Figure 3.15 Normalized intensity plots (rgb channel) for profiles in Figure 3.14 ...40
Figure 3.16 Fluorescence micrograph: 4, emission polarization, green excitation ...41
Figure 3.17 Normalized intensity plots (rgb channel) for profiles in Figure 3.16 ...42
Figure 3.18 Fluorescence micrograph: 2, emission polarization, green excitation ...43
Figure 3.19 Normalized intensity plots (rgb channel) for profiles in Figure 3.18 ...44
Figure 3.20 Fluorescence micrograph: 2, emission polarization, UV excitation ...45
Figure 3.21 Normalized intensity plots (rgb channel), for profiles in Figure 3.20 ...46
Figure 3.22 Fluorescence micrograph: 4, emission polarization, UV excitation ...47
Figure 3.23 Normalized intensity plots (rgb channel) for profiles in Figure 3.22 ...48
Figure 3.24 Normalized intensity plots (red channel) for profiles in Figure 3.22 ...49
Figure 3.25 Normalized intensity plots (blue channel) for profiles in Figure 3.22 ...50
Figure 3.26 Fluorescence micrograph: 4, excitation polarization, UV excitation ...51
Figure 3.27 Normalized intensity plots (rgb channel) for profiles in Figure 3.26 ...52
Figure 3.28 Average polarization of host–guest complex fibers 4 and host fibers 2 ...53
CHAPTER
1
INTRODUCTION
1Crystalline materials with simple one-dimensional (1D) channels provide excellent
model systems for studying complex processes, including adsorption, diffusion, and
molecular recognition and for probing the effects of confinement on the encapsulated
guest’s electronic properties and reactivity.1-3 A wide variety of porous solids have been
reported with 1D channels that can uptake solvents, gases, and guests. Such solids include
porous zeolites,4-8 tris(o-phenylenedioxy)cyclotriphosphazene (TPP),9, 10 and
perhydrotriphenylene (PHTP)11, 12 inclusion complexes. Organization, especially
orientation, of the guest molecules in 1D channels is a crucial factor influencing chemical
reactivity, birefringence, energy transfer, and electron transfer among guests. An improved
understanding of guest orientation and diffusion13 in 1D channels is also of interest for the
development of chemical sensors14 and organic electronics.15
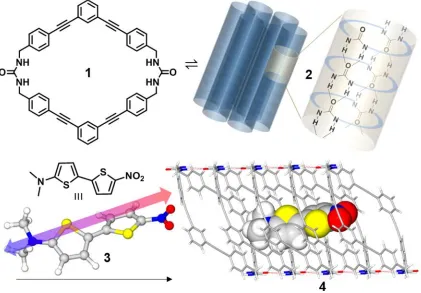
Macrocycle 1 is composed of C-shaped phenylethynylene spacers linking two urea
motifs and self-assembles by slow cooling from DMSO to give fiber-like single crystals
2.1 X-ray diffraction demonstrates that the macrocycles are stacked in a columnar fashion,
each column enclosing a 1D channel. After activation by removal of the included DMSO
1 Kittikhunnatham, P.; Som, B.; Rassolov, V.; Stolte, M.; Würthner, F.; Shimizu, L. S.;
Greytak A. B. Fluorescence polarization measurements to probe alignment of a bithiophene dye in one-dimensional channels of self-assembled phenylethynylene bis-urea macrocycle crystals. J. Phys. Chem. C 2017, 121 (33), 18102–18109.
solvent, the channels can be used as a container for stereoselective photodimerization of
encapsulated guests such as coumarin, chromone, and acenaphthalene.2,16 The channels in
the activated fibers have a round cross section with a diameter of ∼9.0 Å and are amenable
to molecular transport studies on micrometer scales, for example, revealing Fickian
diffusion dynamics using hyperpolarized 129Xe NMR.13 Larger molecules can be expected
to experience stronger interactions with the host and constraints on diffusion.
Herein, we investigate the uptake and orientation of a fluorescent push–pull dye
within the columnar channels of 2 (Figure 1). The small and elongated dye
5-(dimethylamino)-5′-nitro-2,2′-bithiophene 317, 18 has a strong ground state dipole moment
(7.95 D), pronounced solvatochromism, and favorable molecular dimensions (11.7 × 3.5
Å) for intercalation into the channels of 2. This dye has also been studied in liquid
crystals19 and in films as optic and electrochemical sensors.20 We employed polarimetric
fluorescence microscopy, a technique that has previously been applied to fluorophores in
cocrystallized organic inclusion complexes,21 coupled with image analysis to probe the
orientation of 3 within in host–guest fibers 4. The needle- or fiber-like shape of the crystals
permits assignment of the 1D fiber axis. In addition, density functional theory (DFT) was
used to predict the orientation of the guest molecules in the 1D channels, and a
time-dependent DFT (TDDFT) calculation was used to confirm the orientation of the
lowest-energy electronic transition dipole in the guest. The experiments reveal a close
correspondence between the long axis of the macrocycle fibers and the linear transition
dipole orientation of the guest, as determined from excitation and emission polarization
anisotropy measurements of the host–guest complex crystal fibers. We compare these
guest orientation in a channel of self-assembled bis-urea macrocycle fibers could aid in
optimizing reactions, energy transfer, and electron transfer among guest species.
In lieu of single crystal diffraction data, it can be challenging to establish the
orientation of guest molecules within 1D channels, although computational methods22-26
and dielectric spectroscopy27 have been applied. An alternative approach that can be
applied to fluorescent guests is polarimetric fluorescence imaging, as the apparent
fluorescence intensity of guest molecules with linearly or plane polarized transition dipoles
varies depending on the orientation of these dipoles with respect to the polarization of the
excitation light and/or emission filter. Indeed, fluorescent host–guest complex materials
can display high polarization anisotropy as was reported for guests in organic hosts,21,
28-30 inorganic hosts,31-34 and biological complexes.35 Salient features of the polarimetric
approach are its sensitivity and high spatial resolution, which provide information for host–
guest complexes even for small single crystals. In addition, this technique can be applied
over a large range of guest loading factors. Such analysis is particularly well-suited to
crystals with quasi-1D shapes, such as semiconductor nanowires36 and the microcrystals
CHAPTER 2
EXPERIMENTAL METHODS
22.1 Materials and Instrumentations
All chemicals were purchased from Aldrich or VWR and used as received.
Phenylethynylene bis-urea macrocycle1 and 5-(dimethylamino)-5′-nitro-2,2′-bithiophene
dye18 were synthesized according to previously described procedures. 1H NMR and 13C
NMR spectra were recorded on Varian Mercury/VX 300 NMR. Thermogravimetric
analysis (TGA) was carried out using a TA Instruments SDT-Q600 simultaneous
DTA-TGA. Solid-state diffuse-reflectance spectra were recorded using a PerkinElmer Lambda
35 UV–visible scanning spectrophotometer equipped with an integrating sphere.
Fluorescence spectroscopy was carried out on an Edinburgh FS5 instrument equipped with
a 150 W continuous wave xenon lamp source for excitation. Fluorescence lifetimes were
measured using a Mini-τ lifetime spectrometer from Edinburgh Instruments equipped with
a 300.6 nm picosecond-pulsed-light-emitting diode (EPLED 300). Wide-angle X-ray
scattering (WAXS) was carried out using a SAXSLab Ganesha instrument. A Xenocs
GeniX 3D microfocus source was used with a Cu target to generate a monochromatic beam
2 Kittikhunnatham, P.; Som, B.; Rassolov, V.; Stolte, M.; Würthner, F.; Shimizu, L. S.;
with a 0.154 nm wavelength. A 300 K Pilatus detector (Dectris) was used to collect the
two-dimensional (2D) WAXS patterns.
2.2Preparation of Phenylethynylene Bis-Urea Macrocycle Host Fibers
Phenylethynylene bis-urea macrocycle 1 was synthesized following a previously
reported four-step procedure (Scheme 2.1; sample 1H and 13C NMR spectra are shown
in Figures 2.1 and 2.2, respectively). The macrocycle (150 mg) was dissolved in DMSO
(30 mL) at 120 °C, hot filtered, and cooled to room temperature at 1 °C/h to afford
microcrystalline fibers 2 after 5 days, with typical diameters of 2–7 μm and lengths of 10–
70 μm. The channels of 2 are not empty but are filled with DMSO solvent molecules in a
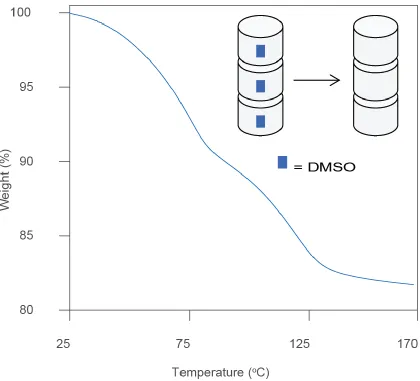
1:1 host:guest stoichiometry represented schematically in Figure 2.3. To permit the
exchange of DMSO for other guests, 2 was activated by heating. The temperature of the
unactivated host fibers was raised from 25 to 170 °C at a rate of 4 °C/min and held at 170
°C for 10 min, then the samples were slowly cooled to room temperature under He (g).
This process was monitored using TGA, which shows a two-step desorption curve between
30 and 130 °C with a weight loss of 18.38% (Figure 2.3) corresponding to the removal of
DMSO.
2.3 Preparation of Host–Guest Fibers
Host fibers 2 (3.8 mg, containing 5.24 × 10⁻⁶ mol 1) were immersed overnight in a
0.94 mM solution of 3 (1.10 × 10⁻⁵ mol total) in degassed acetonitrile. The sample was
then washed with cyclohexane on a suction filter and dried under vacuum to give the host–
2.4 Thermogravimetric analysis calculation
The ratio of macrocycle 1 to DMSO in host fibers prior to activation was calculated
to be 1:2 using the formulas below:
Moles of host=Final weight (g) 724.2845 (mol )g
Moles of guest=Initial weight-Final weight (g) Guest molecular weight (mol )g
Host :Guest= Moles of host Moles of guest
2.5 Fluorescence Polarization Measurements
An Olympus BX-51 epifluorescence microscope equipped with a 120 W metal
halide excitation lamp was used for polarized fluorescence microscopy of single fibers. A
UV excitation filter cube (Olympus MWU2), a green excitation filter cube (Olympus
U-MNG2), a fixed excitation linear polarizer (Olympus U-PO3), and a rotatable linear
analyzer (emission polarizer) were used with a 20× objective lens (0.45 NA). Images were
collected with a color digital CMOS camera (Canon EOS REBEL T3/1100D) operated in
a linear response mode. Samples of macrocycle fiber crystals were mechanically
transferred to a microscope slide using a needle tip, and the slide was then placed on a
rotatable stage. Typically, several nonoverlapping fibers with easily identifiable
orientations could be found within the field of view. The fluorescence intensity above
background of the host and host–guest complex fibers and the orientation of the fiber axis
relative to the polarizers were measured from RGB color micrographs using a profile
analysis method described previously.37 In particular, for each fiber studied, a profile line
side. The profile was expanded along the fiber axis into a rectangular region of interest.
Pixel intensity values sampled within this region of interest were averaged along
dimensions parallel to the fiber axis and then plotted as a function of position along the
orthogonal dimension. The integrated peak area above the baseline set by the background
regions at each end of the plot was used to define the intensity. We used a similar approach
to study inorganic nanowires.37 Details of the microscope configuration are shown
in Figure 2.4.
Fluorescence lifetime calculations
Fluorescence decay lifetimes of host 2 and host-guest complex 4 were measured
using a Mini-τ lifetime spectrometer from Edinburgh Instruments equipped with a 300.6
nm picosecond-pulsed-light-emitting diode (EPLED 300). The lifetimes and decay
profiles are shown in Table 3.1 and Figure S6. The amplitude-weighted average lifetime
τav is the appropriate measure by which to describe fluorescence resonant energy
transfer.43 Accordingly, the decays were fit with a triexponential function (n = 3), where
τi and Bi are respective lifetimes and amplitudes of each component, and these fit
parameters were used to calculate τav:
Fit: A+B1·e(-t/τ1)+B2·e(-t/τ2)+B3·e(-t/τ3)
τav=
B1τ1+B2τ2+B3τ3
B1+B2+B3
The energy transfer efficiency, ΦET was calculated using the following equation:
ΦET [%]=
ket
kr+knr+ket=
ket
The ko and ket values are obtained from the decay lifetimes for donor molecule
(τD) and donor molecule in the presence of acceptor (τD-A), which are τD = 1/ko and τD-A =
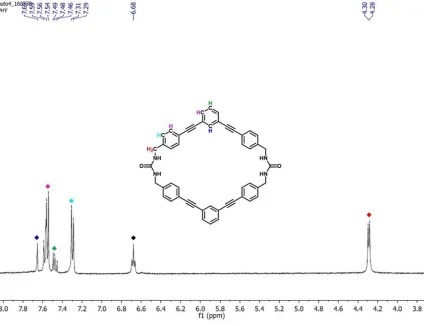
Figure 2.1 1H NMR spectrum of host 2 dissolved in DMSO-d6 (400 MHz): 7.64 (s, 2H, Ar-H), 7.55 (m, J=20.0 Hz, 12H, Ar-H), 7.47 (t, J=16.0 Hz, 2H, Ar-H), 7.28 (d, J=8.0 Hz, 8H, Ar-H), 6.69 (t, J=12.0 Hz, 4H, -NH), 4.28 (d, J=8.0 Hz, 8H, -CH2).
Figure 2.213C NMR spectrum of host 2 dissolved in DMSO-d
Figure 2.4 Experimental setups for fluorescence polarization microscopy measurements. In the excitation polarization measurement (A), no emission polarizer is used. Then, the samplewas illuminated with linearly polarized excitation at 530-550 nm (green excitation filter cube), or at 330-385 nm (uv excitation filter cube) through the objective lens. In this measurement, the orientation of the polarized excitation was fixed and the sample was rotated to collect a series of fluorescence micrographs of the sample showing the fibers with varying angles between fiber axes and polarized excitation light direction (θ1). A
CHAPTER 3
RESULTS AND DISCUSSION
3Treatment of activated host crystals 2 with solutions of 3 in acetonitrile led to
uptake of the dye. A color change from white to purple was visible to the naked eye and in
transmission micrographs of individual crystals as illustrated in Figure 3.1. Figure 3.1
compares the crystals before and after dye exposure. To control for the possibility of
surface adsorption, the unactivated fibers 2·DMSO were similarly immersed in dye
solution but displayed no coloration, suggesting that the majority of the dye molecules in
complex 4 are incorporated in the channels and are not on the surface. Dye 3 was also not
absorbed by samples in which the host channels were occupied by the previously
characterized chromone guest.
To quantify the loading of the dye, complex 4 was disassembled by dissolution in
DMSO-d6 to afford the free macrocycle 1 and the dye and analyzed by 1H NMR (Figure
3.2). Comparison of the integration of the methylene CH2 from 1 and the CH3 from the
dye 3 gave a ratio of 11.0:1. The average host:guest ratio for 3 loading experiments was
10.8:1. The loading for 3 was lower than that for previously reported polar guest 3-cyano
3 Kittikhunnatham, P.; Som, B.; Rassolov, V.; Stolte, M.; Würthner, F.; Shimizu, L. S.;
Greytak A. B. Fluorescence polarization measurements to probe alignment of a bithiophene dye in one-dimensional channels of self-assembled phenylethynylene bis-urea macrocycle crystals. J. Phys. Chem. C 2017, 121 (33), 18102–18109.
chromone (2:1 host:guest).2 Dye 3 is significantly larger than the chromone (281.1 vs
197.5 Å3) and, based on the structural model, the loading ratio appears to represent about
50% of the available space.
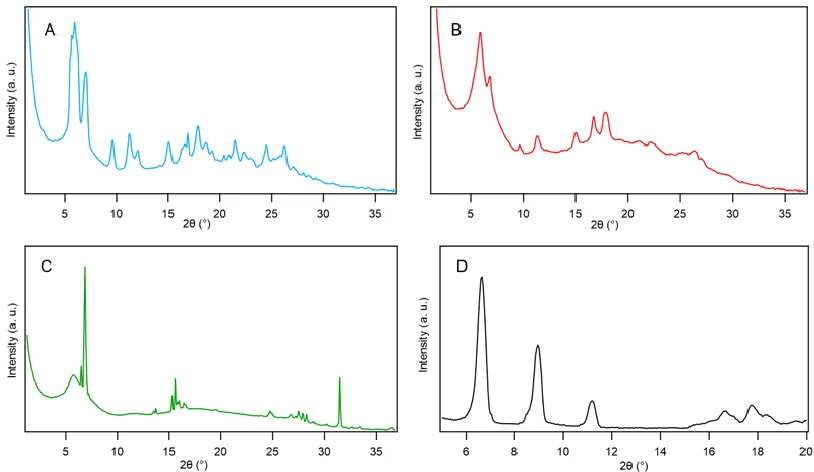
Previously, the crystallinity of 2 and host–guest derivatives were probed by X-ray
techniques, including powder X-ray diffraction (PXRD).1 Given the small sample
size,WAXS was used to probe the structure of host–guest complex 4.
In Figure 3.host 2 shows a sharp WAXS pattern between 2θ = 2–25°, similar to PXRD
patterns previously reported for this homogeneous crystalline material. Comparison of the
WAXS pattern of activated 2, dye 3, and complex 4 suggests that the complex is not a
simple mixture of the two components (Figure 3.4). Upon dye complexation, 4 maintains
many of the key sharp peaks in 2, including the low angle peaks at 2θ = 5.94, 9.64, and
15.01°, while slight shifting was observed in several peaks between 2 (7.05 and 11.21°)
and complex 4 (6.77 and 11.30°), suggesting that high crystallinity is maintained upon
uptake of the dye into the 1D pores while accommodating some changes in the overall
structure.
In comparison to guests previously loaded into host 2, the bithiophene dye 3 is
more polar (7.95 D) and shows a marked solvotochromism. The peak energy has previously
been shown18, 19 to vary linearly with Kamlet and Taft’s polarity parameter π*.38, 39 For
example, in Figure 3.5 we compare the absorption spectra of 3 in four solvents of different
polarities. The peak shifts to longer wavelengths as the solvent π* increases, from λmax =
467 nm in hexanes (π* = −0.08) to λmax = 498 nm in diethyl ether (Et2O, π* = 0.27) to
λmax = 533 nm in acetonitrile (CH3CN, π* = 0.75) to λmax = 562 nm in dimethyl sulfoxide
polarity should provide a measure of the interior environment of the channels. Fluorescence
spectra of 3 in the four solvents show a similar shift (Figure 3.6); the emission peak of the
dye 3 shifts from 521 nm in hexanes to 693 nm in DMSO (λexc∼ 530–550 nm). However,
in highly polar solvents (e.g., CH3CN and DMSO), the photoluminescence intensity of the
dye 3 is significantly quenched; no photoluminescence peak of the dye 3 was detected in
CH3CN under 530 nm excitation.
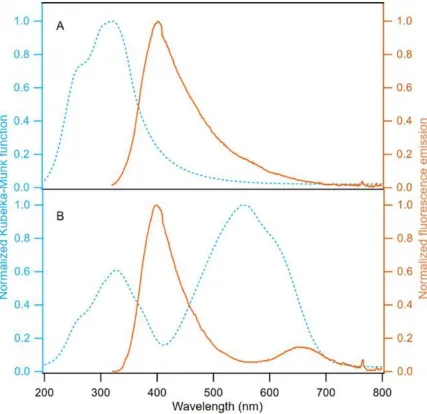
Figure 3.7 compares the diffuse reflectance and fluorescence spectra of 2 and host–
guest complex 4. Host 2 exhibits a broad absorption band with λmax = 322 nm. In
comparison, the host–guest complex displays two absorption bands. The band attributed to
the host at λmax = 327 nm is slightly red-shifted from that of the free host. A second, more
intense band is observed at 552 nm, which is attributed to dye 3. Comparison of these
results to reported UV–vis absorption maxima suggests that the interior environment of the
channel exhibits π* ≈ 0.90, comparable to dimethylformamide, based on the polarity scale
established previously for this probe.18
Figure 3.7 also shows emission spectra of 2 and host–guest complex 4 obtained by
exciting the samples at 280 nm. This excitation wavelength was selected to preferentially
excite the host, as it is well below the absorption maximum of the dye in representative
organic solvents. Host 2 has an emission maximum at 404 nm, while the host–
guest 4 emission maxima are at 400 and 649 nm. The peak at 649 nm is attributed to the
guest and lies within the range found for 3 in polar solvents. Unactivated fibers did not
display this fluorescence peak after exposure to a solution of 3 (Figure 3.8). Guest emission
can arise both from direct excitation and by energy transfer (ET) from the host. In the case
average decay lifetime of the host is expected. While 2 and 4 both showed
multiexponential decays, the amplitude average lifetime decreased from 1.27 to 1.08 ns,
indicating energy transfer efficiency up to ∼15% (Figure 3.9 and Table 3.1).
Because the length of guest 3 exceeds the diameter of the 1D channels in the host,
we expect that a limited range of orientations is accessible to the guest, within which
rotational diffusion may occur. The distribution of molecular orientations that is accessible
to the guest can be probed experimentally via fluorescence polarization measurements. In
a simplistic model, molecular orientations in a cylindrical channel can be thought of as
having a cone-like distribution in which excursions beyond a characteristic tilt angle α are
inaccessible. In the case of host 2, the available crystal structure allows us to make some
general arguments about the symmetry of the distribution about the axis and to investigate
the influence of specific interactions between the host and guest through density functional
theory calculations.
The unit cell of the host crystal actually encompasses two unique, parallel 1D
channels that are rotated by 180° from each other about the channel axis. Additionally,
within each channel, the macrocycles are stacked such that the urea carbonyls point in
opposite directions on opposite sides of the channel. As a result, as shown in Figure 3.10,
any particular guest site within a channel is representative of four symmetrically equivalent
sites in the crystal structure. Guests occupying equivalent sites in neighboring channels
have equal and opposite tilt angles with respect to the channel axis. As a result, the observed
polarization axis in fluorescence measurements is expected to coincide with the channel
axis; however, the magnitude of the polarization will depend on the distribution of tilt
DFT calculations with ADF201440 were used to investigate the feasibility of
loading dye 3 into the channels and to evaluate the geometry of the encapsulated guest.
The host model was generated by importing the atomic coordinates from the single crystal
X-ray structure of the host, omitting the coordinates of the solvent guests and truncating
the structure to five macrocycles of a single column. The long axis of the guest
molecule 3 is larger than the host channel inner diameter (11 vs 9 Å internuclear distance),
suggesting a lengthwise orientation. From an initial starting position, the geometry of the
guest molecule was optimized at the PBEsol-D3/DZP level, keeping the host geometry
frozen. Figure 3.11 depicts the optimized geometry of the host–guest complex 4 and
indicates that the long axis of the guest molecule 3 aligns approximately parallel to the host
channel axis and that a minimum of four macrocycles are needed to fully encapsulate the
dye (optimized coordinates are provided in Table A1). In the optimized structure, the
molecule is slightly off center due to favorable interactions with the host sidewall. We next
carried out a TDDFT calculation at the B3LYP/TZ2P level to confirm the orientation of
the lowest-energy electronic transition dipole moment (ETDM) in the guest.
The orientation of the calculated ETDM of the guest in the optimized structure is
nearly parallel to the plane defined by the urea oxygen atoms of the host and is canted by
and angle α = 9.5° from the channel axis, as represented by the arrow in Figure 3.11. While
this represents the optimized guest geometry, thermal population of higher energy
geometries may occur at room temperature. To evaluate this possibility, we performed a
geometry optimization calculation with the molecule constrained to interact with the two
opposing sides of the host channel. This calculation yielded a guest structure in which the
state energy only 175 K, or 0.35 kcal/mol, above the optimized minimum. It is likely that
there are many similar states within the thermally accessible energy from the minimum,
leading to a broad distribution of ETDM orientations with α ≤ 30° at room temperature.
On the basis of the diffuse reflectance and fluorescence data, appropriate excitation
and emission channels were selected for polarimetric fluorescence microscopy of
individual macrocycle fibers cast on glass substrates. A green excitation filter cube (530–
550 nm excitation band-pass; 570 nm dichroic mirror, 590 nm emission long-pass filter)
was use to selectively excite the guest. For comparison, a UV excitation filter cube (330–
385 nm excitation band-pass; 400 nm dichroic, 420 nm emission long-pass) is used to
excite the host and guest together with separation of host and guest emission signals
possible through the use of a color camera. These excitation and emission conditions were
combined with linear polarizers to perform fluorescence excitation and emission
polarization measurements to assess the orientation of the dye within the 1D channels.
Details of the experimental setup are shown in Figure 2.4.
In the excitation polarization measurement, linearly polarized light is used to excite
the sample. The fiber axis is rotated with respect to the polarization vector of the incident
light. No polarizer is applied to the emission such that all light emitted toward the objective
lens is collected. Excitation polarization is sensitive to the anisotropy of the transition
dipole alignment in the absorbing state: the excitation rate is greatest if the polarizer is
parallel to the excitation dipole and reaches a minimum if they are perpendicular. If this is
the same state from which light is emitted, the information is the same as for emission
anisotropy, but in the case of significant relaxation or energy transfer between the
were performed simultaneously on multiple fiber-like crystals within the field of view of
the microscope by recording a series of images at different angles and then determining the
crystal orientation and fluorescence intensity above background. Figure 3.12A–D are
fluorescence micrographs illustrating excitation polarization in a representative host–guest
complex fiber 4 (profile 1 in Figure 3.14) with the green excitation filter cube. To correct
for any effects of photobleaching, uneven detector response, or instability of the light
source throughout the experiment, the fluorescence intensities were normalized by
comparison to matching images recorded with both polarizers removed (Figure 3.12A and
C). The arrows show the orientation of the polarized excitation. From the micrographs, the
brightness of the host–guest complex fiber when the excitation light is polarized parallel to
the fiber axis is greater than when the excitation light is polarized perpendicular to the fiber
axis. To analyze the excitation polarization anisotropy in greater detail, Iθ/Imax was plotted
as a function of the angle θ1 between the direction of the polarized excitation and the
direction of the fiber axis (Figure 3.12E), where Iθ is the ratio of fluorescence intensity of
the fiber when excited by linearly polarized light to fluorescence intensity of the fiber
excited by unpolarized light and Imax is the maximum value of Iθ. From the plot, a large
oscillation is evident. Iθ/Imax is highest when the direction of the polarized excitation is
parallel to the fiber axis (θ1 ≈ 0°), whereas Iθ/Imax is minimized when the direction of the
polarized excitation is perpendicular to the fiber axis (θ1 ≈ 90°).
A similar response is observed for emission polarization in the host–guest sample
using the green (guest-selective) excitation channel (Figure 3.13). A series of fluorescence
micrographs of the host–guest complex fibers was recorded with unpolarized excitation
emission polarizer removed were used to normalize the intensity signals. Figures 3.13A–
D are fluorescence micrographs of a representative host–guest complex fiber 4 (profile 8
in Figure 3.16) with unpolarized excitation and different emission polarizer conditions.
Plotting Iθ/Imax as a function of emission polarizer angles θ2 relative to the fiber axis
(Figure 3.13E) indicates strongly polarized light emitted from the host–guest complex
fiber 4.
In analyzing fluorescence polarization data, we aim to determine if a preferential
(i.e., nonrandom) distribution of molecular orientations exists and, if so, the relationship
between that distribution and the crystal axis. The polarization P of a fluorescent emitter is
classically defined41 based on the intensities of components with electric field parallel or
perpendicular to an axis of reference, here the observed long axis of the crystal:
P = I∥ - I⊥
I∥ + I⊥ (3.1)
If all dipoles are aligned with the crystal axis, P will approach 1, but disorder among dipole
orientations and unpolarized background contributions will lead to diminished values of P.
The measured intensity is expected to vary sinusoidally as θ1 or θ2 is changed, with
a period of 180°. Symmetry arguments based on the crystal structure, as outlined above,
indicate that any net polarization due to alignment of guests must lie parallel to, or
perpendicular to, the crystal axis. However, our data analysis considers the possibility that
the angle of maximum intensity is offset from the crystal axis by an angle ϕ, such that the
relative intensity Iθ/Imax is described by
I(θ)
Imax = In + Ipcos
where In and Ip represent the relative intensities of a “normal” (unpolarized) component of
the signal and of a component that is linearly polarized with a maximum at θ = ϕ,
respectively. These can be combined to give a single value Pmax = Ip/(Ip + 2In) that
represents the maximum polarization that would be observed using polarizers aligned with
the transition dipole projection. A least-squares fit of the experimental data
to eq 3.2 provides values of Pmax and ϕ for each macrocycle crystal. It is also possible to
obtain, from the fit, values of I∥ and I⊥ that may be substituted into eq 3.1 to give:
P = Pmaxcos2ϕ (3.3)
This is valuable because, while Pmax is always positive, measurements of P are expected to
be zero-centered in the absence of significant anisotropy, and as such the distribution
of P values measured for multiple individual crystals in the sample can be used to detect
statistically significant excitation or emission polarization in the case of weak modulation
or noisy signals. In the case that significant polarization is found, as is the case for the
examples in Figures 3.12 and 3.13, the value of Pmax can be used to characterize the
amount of disorder that could be present in ETDM orientations in the absence of rotational
diffusion. Including the parameter ϕ also allows Pmax to be measured accurately in the event
of small errors in assignment of the fiber orientation with respect to the polarizers.
Excitation polarization in the guest-selective (green) channel (Figure 3.12) was
measured for seven single host–guest fibers (see Figure 3.14). Plots of Iθ/Imax versus
θ1 obtained from each fiber are well-fit by eq 3.2 (Figure 3.15). Among the crystals
analyzed, Pmax = 0.65 ± 0.05, rising to a maximum of 0.715 and ϕ = 0.1 ± 1.4°, where
uncertainties represent sample standard deviations. For emission polarization under
and 3.17) were investigated using the same method. Plots of Iθ/Imax versus θ2 reveal Pmax =
0.56 ± 0.14 (max 0.729) and ϕ = 7.4 ± 11.6°. The consistent observation of significant
fluorescence polarization of the dye in 4 helps to confirm that the guest occupies the 1D
channels in the host. In analyzing the magnitude of the polarization as a probe of guest
orientation, it is important to consider trivial causes of depolarization, which include
common mode background contributions and scattering or attenuation of excitation or
fluorescence light. The profile analysis method eliminates background that is not uniquely
associated with the fiber. However, a nonzero host fluorescence signal (analyzed below)
exists in addition to probe fluorescence. As can be seen in Figure 3.1, some attenuation of
visible light is noticeable in the dye-loaded fibers; based on the observed excitation
polarization, such absorption will tend to selectively attenuate excitation light with
polarization parallel to the fiber axis. Because of these factors, we considered the maximum
observed Pmax as a point of comparison with calculated results. In a cone model
(see Appendix A), Pmax = 0.729 requires α < 29° for dipoles at a fixed angle α, or αmax <
42° for a static square well (the addition of diffusion, i.e. a “wobbling cone”, had little
effect: αmax < 43°). We note that a fixed angle of 9.5°, as found in the minimized structure,
gives Pmax = 0.97. The diminished experimental result for Pmax could indicate that the
larger accessible angle, in which the guest spans the channel to interact with both sides, is
predominant at room temperature.
We additionally examined fluorescence anisotropy in dye-free crystals of the
host 2. Excitation using the green filter cube (Figures 3.18 and 3.19), which has minimal
overlap with the host absorption spectrum, produced weak fluorescence with no significant
interval for the average value (Figure 3.13). Excitation of 2 with the UV filter cube
(Figures 3.20 and 3.21) produced stronger fluorescence centered in the blue channel as
expected from the ensemble fluorescence spectrum. A small but significant emission
polarization was detected in this case with the maximum polarization axis ϕ again close to
zero.
With the behavior of the dye-free host 2 established, we revisit the case of the host–
guest crystals 4 under UV excitation. In this mode, a majority of the total light emitted
comes from the host; however, the guest contributes as well due to direct excitation and
energy transfer as discussed above. We observed a small but significant emission
polarization when the total visible light fluorescence channel is considered (Figures 3.22
and 3.23), as shown in Figure 3.28. Considering the red and blue channels of the color
micrographs separately (Figures 3.24 and 3.25), a larger polarization was seen in the red
channel where guest emission contributes most strongly. On the other hand, excitation
polarization in 2 was weak and could not be statistically distinguished from zero (Figures
3.26 and 3.27). These two results suggest a picture in which degenerate or overlapping
ETDMs in the host in the UV region lead to scrambling of the incident excitation
polarization prior to energy transfer to the guest. However, emission ultimately emerging
from the guest remains polarized along the crystal axis, contributing to the significant
emission polarization observed in the red channel upon UV excitation. We note that the
large difference in the extent of fluorescence anisotropy between the visible and UV
channels suggests that dielectric contrast, seen previously in polarization measurements on
Table 3.1 Life times of host 2 and host-guest complex 4.
Host 2 Host-guest complex 4
B1(X 10-2) 8.16 9.29
B2(X 10-2) 2.37 1.94
B3(X 10-2) 0.23 0.17
τ1 (ns) 0.68 0.63
τ2 (ns) 2.56 2.36
τ3 (ns) 8.86 11.12
τav (ns) 1.27 1.08
26
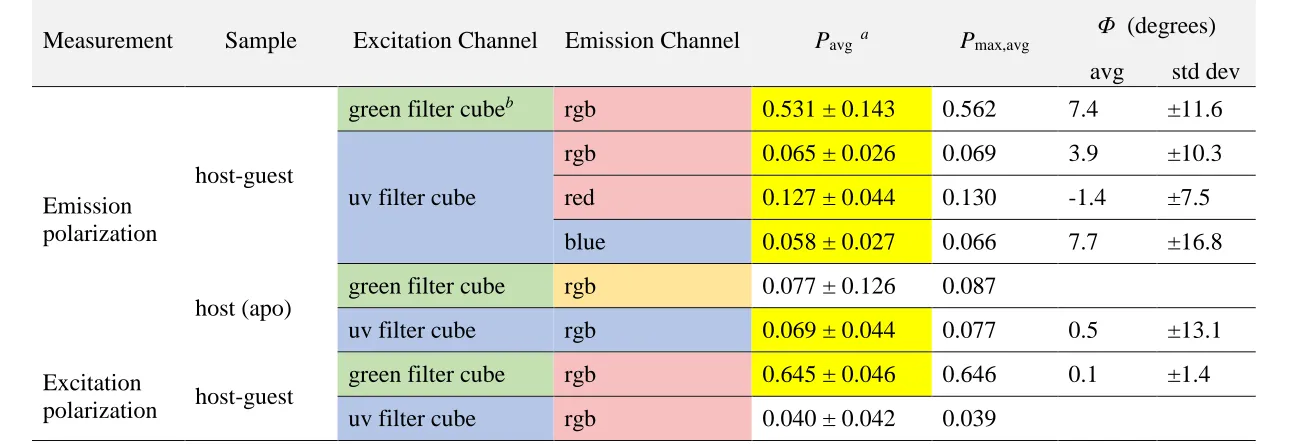
Table 3.2 Summary of data from polarization measurements.
Measurement Sample Excitation Channel Emission Channel Pavg a Pmax,avg
Φ (degrees)
avg std dev
Emission polarization
host-guest
green filter cubeb rgb 0.531 ± 0.143 0.562 7.4 ±11.6
uv filter cube
rgb 0.065 ± 0.026 0.069 3.9 ±10.3
red 0.127 ± 0.044 0.130 -1.4 ±7.5
blue 0.058 ± 0.027 0.066 7.7 ±16.8
host (apo)
green filter cube rgb 0.077 ± 0.126 0.087
uv filter cube rgb 0.069 ± 0.044 0.077 0.5 ±13.1
Excitation
polarization host-guest
green filter cube rgb 0.645 ± 0.046 0.646 0.1 ±1.4
uv filter cube rgb 0.040 ± 0.042 0.039
a Uncertainties represent confidence intervals.
Figure 3.4 WAXS diffractograms of host fibers 2 (A), host-guest complex fibers 4 (B), 5-(dimethylamino)-5’-nitro- 2,2-bithiophene 3 (C), and PXRD pattern of host fibers 2 (D)1
Figure 3.6 Photoluminescence (PL) spectra of dye 3 in various solvents displaying positive solvatochromism. (1) a solution of the dye in hexane (λmax = 521 nm, excitation at 450 nm),
(2) a solution of the dye in Et2O (λmax = 572 nm, excitation at 480 nm), and (3) a solution
of the dye in DMSO (λmax = 693 nm, excitation at 530-550). Note: PL spectrum of dye 3
in CH3CN was also measured (excitation at 530), but the PL signal was not detected in our
Figure 3.12 Excitation polarization measurement. (A–D) Micrographs of a single host– guest complex fiber recorded with varying excitation conditions (scale bars are 10 μm). Panels A and C were recorded with an unpolarized condition, while panels B and D were recorded with polarized excitation with orientation indicated by green arrows. (E) Plot of Iθ/Imax (determined from averaged line profiles; see Appendix A) versus θ1, shown with
least-squares fit to eq 3.2.
Figure 3.13 Emission polarization measurement. (A–D) Micrographs of a single host– guest complex fiber recorded with varying excitation conditions (scale bars are 10 μm). Panels A and C were recorded with an unpolarized condition, while panels B and D were recorded with polarized observation with orientation indicated by green arrows. (E) Plot of Iθ/Imax (determined from averaged line profiles; see Appendix A) versus θ2, shown with
Figure 3.15 (A-G) Normalized intensity plots (analyzed from rgb channel)corresponding to profile 1-7 shown in Figure 3.14, respectively. The black squares show experimental data and the solid blue lines show In + Ip cos2(θ− ϕ) function fitted to the experimental data.
Figure 3.28 Average polarization, P, of the host–guest complex fibers 4 and host fibers 2
CHAPTER 4
CONCLUSIONS
4We have shown here that the molecular fluorophore
5-(dimethylamino)-5′-nitro-2,2′-bithiophene 3 can be incorporated into self-assembled bis-urea macrocycle crystals
containing 1D channels. Within the channels, the dye exhibits an absorbance peak position
comparable to that seen in a highly polar solvent environment. Although 3 is almost
nonfluorescent in such polar solvents, prominent fluorescence is observed in the context of
the host matrix. Such enhancement of fluorescence in confined environments is also
observed for the green fluorescent protein (GFP) chromophore, which is fluorescent in the
protein and in metal–organic frameworks but nearly nonemissive in solution.42 Polarized
fluorescence microscopy measurements indicate that the ETDMs of the guests exhibit a
net alignment parallel to the long axis of individual micrometer-scale crystals. A TDDFT
calculation allows the EDTM to be indexed to the guest’s molecular structure, and
geometry optimization by DFT indicates that, while the minimized structure is tilted at
∼9.5° from the channel axis, larger angles up to 30° are thermally accessible, which is
sufficient to explain the maximum polarization values measured. Further studies of
fluorescent guests with varied sizes or functional groups could aid in understanding and
4 Kittikhunnatham, P.; Som, B.; Rassolov, V.; Stolte, M.; Würthner, F.; Shimizu, L. S.;
Greytak A. B. Fluorescence polarization measurements to probe alignment of a bithiophene dye in one-dimensional channels of self-assembled phenylethynylene bis-urea macrocycle crystals. J. Phys. Chem. C 2017, 121 (33), 18102–18109.
modeling host–guest interactions in porous organic crystals. Due to its ability to detect
molecular orientation information on single micro/nanoscale structures with low detection
limit, polarized fluorescence microscopy can potentially be used to probe other types of
low-dimensional porous materials. Furthermore, combining this technique with time-series
image analysis should facilitate the study of kinetics and transport processes in such
REFERENCES
(1) Dawn, S.; Dewal, M. B.; Sobransingh, D.; Paderes, M. C.; Wibowo, A. C.; Smith,
M. D.; Krause, J. A.; Pellechia, P. J.; Shimizu, L. S. Self-Assembled Phenylethynylene
Bis-Urea Macrocycles Facilitate the Selective Photodimerization of Coumarin. J. Am.
Chem. Soc. 2011, 133, 7025–7032.
(2) Salpage, S. R.; Donevant, L. S.; Smith, M. D.; Bick, A.; Shimizu, L. S.
Modulating the Reactivity of Chromone and Its Derivatives through Encapsulation in a
Self-Assembled Phenylethynylene Bis-Urea Host. J. Photochem. Photobiol. -Chem.
2016, 315, 14–24.
(3) Geer, M. F.; Walla, M. D.; Solntsev, K. M.; Strassert, C. A.; Shimizu, L. S.
Self-Assembled Benzophenone Bis-Urea Macrocycles Facilitate Selective Oxidations by
Singlet Oxygen. J. Org. Chem. 2013, 78, 5568–5578.
(4) Calzaferri, G.; Pauchard, M.; Maas, H.; Huber, S.; Khatyr, A.; Schaafsma, T.
Photonic Antenna System for Light Harvesting, Transport and Trapping. J. Mater. Chem.
2002, 12, 1–13.
(5) Calzaferri, G.; Huber, S.; Maas, H.; Minkowski, C. Host–guest Antenna
Materials. Angew. Chem. Int. Ed. 2003, 42, 3732–3758.
(6) Calzaferri, G.; Lutkouskaya, K. Mimicking the Antenna System of Green Plants.
Photochem. Photobiol. Sci. 2008, 7, 879–910.
(7) Calzaferri, G. Nanochannels: Hosts for the Supramolecular Organization of
(8) Ramamurthy, V.; Sanderson, D. R.; Eaton, D. F. Control of Dye Assembly within
Zeolites: Role of Water. J. Am. Chem. Soc. 1993, 115, 10438–10439.
(9) Meersmann, T.; Logan, J. W.; Simonutti, R.; Caldarelli, S.; Comotti, A.; Sozzani,
P.; Kaiser, L. G.; Pines, A. Exploring Single-File Diffusion in One-Dimensional
Nanochannels by Laser-Polarized 129Xe NMR Spectroscopy. J. Phys. Chem. A 2000,
104, 11665–11670.
(10) Sozzani, P.; Comotti, A.; Simonutti, R.; Meersmann, T.; Logan, J. W.; Pines, A.
A Porous Crystalline Molecular Solid Explored by Hyperpolarized Xenon. Angew. Chem.
Int. Ed. 2000, 39, 2695–2699.
(11) Langley, P. J.; Hulliger, J. Nanoporous and Mesoporous Organic Structures: New
Openings for Materials Research. Chem. Soc. Rev. 1999, 28, 279–291.
(12) Couderc, G.; Hulliger, J. Channel Forming Organic Crystals: Guest Alignment
and Properties. Chem. Soc. Rev. 2010, 39, 1545–1554.
(13) Bowers, C. R.; Dvoyashkin, M.; Salpage, S. R.; Akel, C.; Bhase, H.; Geer, M. F.;
Shimizu, L. S. Crystalline Bis-Urea Nanochannel Architectures Tailored for Single-File
Diffusion Studies. Acs Nano 2015, 9, 6343–6353.
(14) Swager, T. M. Iptycenes in the Design of High Performance Polymers. Acc.
Chem. Res. 2008, 41, 1181–1189.
(15) Xu, W. L.; Smith, M. D.; Krause, J. A.; Greytak, A. B.; Ma, S.; Read, C. M.;
Shimizu, L. S. Single Crystal to Single Crystal Polymerization of a Self-Assembled
Diacetylene Macrocycle Affords Columnar Polydiacetylenes. Cryst. Growth Des. 2014,
(16) Dawn, S.; Salpage, S. R.; Koscher, B. A.; Bick, A.; Wibowo, A. C.; Pellechia, P.
J.; Shimizu, L. S. Applications of a Bis-Urea Phenylethynylene Self-Assembled
Nanoreactor for [2+2] Photodimerizations. J. Phys. Chem. A 2014, 118, 10563–10574.
(17) Effenberger, F.; Würthner, F. 5-Dimethylamino-5′-Nitro-2, 2′-Bithiophene—a
New Dye with Pronounced Positive Solvatochromism. Angew. Chem. Int. Ed. Engl.
1993, 32, 719–721.
(18) Effenberger, F.; Wuerthner, F.; Steybe, F. Synthesis and Solvatochromic
Properties of Donor-Acceptor-Substituted Oligothiophenes. J. Org. Chem. 1995, 60,
2082–2091.
(19) Iwanaga, H.; Naito, K.; Effenberger, F. Oligothiophene Dyes for Guest-Host
Liquid Crystal Displays. Liq. Cryst. 2000, 27, 115–123.
(20) Rodríguez-Méndez, M. L.; Apetrei, C.; Nieto, M.; Hernandez, V.; Navarrete, J. T.
L.; Effenberger, F.; de Saja, J. A. Sensing Properties of Organised Films Based on a
Bithiophene Derivative. Sens. Actuators B Chem. 2009, 141, 625–633.
(21) Gierschner, J. Directional Exciton Transport in Supramolecular Nanostructured
Assemblies. Phys. Chem. Chem. Phys. 2012, 14, 13146–13153.
(22) Fois, E.; Tabacchi, G.; Calzaferri, G. Interactions, Behavior, and Stability of
Fluorenone inside Zeolite Nanochannels. J. Phys. Chem. C 2010, 114, 10572–10579.
(23) Fois, E.; Tabacchi, G.; Calzaferri, G. Orientation and Order of Xanthene Dyes in
the One-Dimensional Channels of Zeolite L: Bridging the Gap between Experimental
(24) Fois, E.; Tabacchi, G.; Devaux, A.; Belser, P.; Brühwiler, D.; Calzaferri, G. Host–
guest Interactions and Orientation of Dyes in the One-Dimensional Channels of Zeolite
L. Langmuir 2013, 29, 9188–9198.
(25) Zhou, X.; Wesolowski, T. A.; Tabacchi, G.; Fois, E.; Calzaferri, G.; Devaux, A.
First-Principles Simulation of the Absorption Bands of Fluorenone in Zeolite L. Phys.
Chem. Chem. Phys. 2013, 15, 159–167.
(26) Srinivasan, G.; Villanueva-Garibay, J. A.; Müller, K.; Oelkrug, D.; Medina, B.
M.; Beljonne, D.; Cornil, J.; Wykes, M.; Viani, L.; Gierschner, J.; et al. Dynamics of
Guest Molecules in PHTP Inclusion Compounds as Probed by Solid-State NMR and
Fluorescence Spectroscopy. Phys. Chem. Chem. Phys. 2009, 11, 4996–5009.
(27) Tsuwi, J.; Berger, R.; Labat, G.; Couderc, G.; Behrnd, N.-R.; Ottiger, P.;
Cucinotta, F.; Schürmann, K.; Bertoni, M.; Viani, L.; et al. Alignment and Relaxation
Dynamics of Dye Molecules in Host−Guest Inclusion Compounds As Probed by
Dielectric Spectroscopy. J. Phys. Chem. A 2010, 114, 6956–6963.
(28) Lee, S. K.; Shang, Q.-Y.; Hudson, B. S. Urea and Thiourea Inclusion Complexes
of Conjugated Polyenes: Polarized Fluorescence Excitation and Resonance Raman
Studies. Mol. Cryst. Liq. Cryst. Sci. Technol. Sect. Mol. Cryst. Liq. Cryst. 1992, 211,
147–156.
(29) Gierschner, J.; Lüer, L.; Oelkrug, D.; Musluoğlu, E.; Behnisch, B.; Hanack, M.
Preparation and Optical Properties of Oligophenylenevinylene/Perhydrotriphenylene
Inclusion Compounds. Adv. Mater. 2000, 12, 757–761.
(30) Komorowska, K.; Brasselet, S.; Dutier, G.; Ledoux, I.; Zyss, J.; Poulsen, L.;
of the Nonlinear Efficiency of Perhydrotriphenylene Inclusion Compounds. Chem. Phys.
2005, 318, 12–20.
(31) Huber, S.; Ruiz, A. Z.; Li, H.; Patrinoiu, G.; Botta, C.; Calzaferri, G. Optical
Spectroscopy of Inorganic-Organic Host-Guest Nanocrystals Organized as Oriented
Monolayers. Inorganica Chim. Acta 2007, 360, 869–875.
(32) Gasecka, A.; Dieu, L. Q.; Brühwiler, D.; Brasselet, S. Probing Molecular Order in
Zeolite L Inclusion Compounds Using Two-Photon Fluorescence Polarimetric
Microscopy. J. Phys. Chem. B 2010, 114, 4192–4198.
(33) Megelski, S.; Lieb, A.; Pauchard, M.; Drechsler, A.; Glaus, S.; Debus, C.;
Meixner, A. J.; Calzaferri, G. Orientation of Fluorescent Dyes in the Nano Channels of
Zeolite L. J. Phys. Chem. B 2001, 105, 25–35.
(34) Wu, J.; Gross, A. F.; Tolbert, S. H. Host-Guest Chemistry Using an Oriented
Mesoporous Host: Alignment and Isolation of a Semiconducting Polymer in the
Nanopores of an Ordered Silica Matrix. J. Phys. Chem. B 1999, 103, 2374–2384.
(35) Kampmann, M.; Atkinson, C. E.; Mattheyses, A. L.; Simon, S. M. Mapping the
Orientation of Nuclear Pore Proteins in Living Cells with Polarized Fluorescence
Microscopy. Nat. Struct. Mol. Biol. 2011, 18, 643–649.
(36) Wang, J. F.; Gudiksen, M. S.; Duan, X. F.; Cui, Y.; Lieber, C. M. Highly
Polarized Photoluminescence and Photodetection from Single Indium Phosphide
Nanowires. Science 2001, 293, 1455–1457.
(37) Viswanath, A.; Paudel, P.; Kittikhunnatham, P.; Green, A. N.; Greytak, A. B.;
Units and Their Use in Functionalization of Cadmium Sulfide Nanowires. Polym. Chem.
2015, 6, 7036–7044.
(38) Kamlet, M. J.; Abboud, J. L.; Taft, R. W. The Solvatochromic Comparison
Method. 6. The Pi.* Scale of Solvent Polarities. J. Am. Chem. Soc. 1977, 99, 6027–6038.
(39) Kamlet, M. J.; Abboud, J. L. M.; Abraham, M. H.; Taft, R. W. Linear Solvation
Energy Relationships. 23. A Comprehensive Collection of the Solvatochromic
Parameters, Pi.*, .Alpha., and .Beta., and Some Methods for Simplifying the Generalized
Solvatochromic Equation. J. Org. Chem. 1983, 48, 2877–2887.
(40) Sillen, A.; Engelborghs, Y. The Correct Use of “Average” Fluorescence
Parameters. Photochem. Photobiol. 1998, 67, 475–486.
(41) te Velde, G.; Bickelhaupt, F. M.; Baerends, E. J.; Fonseca Guerra, C.; van
Gisbergen, S. J. A.; Snijders, J. G.; Ziegler, T. Chemistry with ADF. J. Comput. Chem.
2001, 22, 931–967.
(42) Lakowicz, J. R. Principles of Fluorescence Spectroscopy, 3rd ed.; Springer: New
York, 2006.
(43) Sillen, A.; Engelborghs, Y. The Correct Use of “Average” Fluorescence
Parameters. Photochemistry and Photobiology 1998, 67, 475–486.
(44) Lipari, G.; Szabo, A. Effect of Librational Motion on Fluorescence Depolarization
and Nuclear Magnetic Resonance Relaxation in Macromolecules and Membranes.
APPENDIX A
STATISTICAL INTERPRETATION OF POLARIZATION
MEASUREMENTS
Detecting and quantifying polarization: We presume that when observed through the
microscope objective, the light emitted by each individual crystal can be described as the
sum of an unpolarized “normal” component with intensity In, and a component with
intensity Ip that is linearly polarized. In general, the polarization axis of Ip may be displaced
from the long axis of the crystal by an angle ϕ. If the fluorescence is associated with
transition dipoles that are preferentially oriented along the crystal axis, we expect Ip to be
non-zero, and ϕ to be small and centered about zero. The goal of this discussion is to
establish conditions by which we can show that among the population of crystals in a
sample, Ip is nonzero and ϕ is distributed non-randomly. We will show that these conditions
can be established by demonstrating that the average polarization P among crystals in the
sample, defined with respect to the crystal axis, is nonzero.
The polarization P of a beam of light can be defined as43
P = I∥- I⊥ I∥+ I⊥
where I∥ and I⊥ represent the intensity measured with the excitation (or emission) polarizer
oriented parallel or perpendicular to an axis of reference, taken here to be the crystal axis.
Our measurement records the relative intensity I/Imax at a series of different angles θ
relative intensity, arising from the contributions of numerous individual transition dipoles
within the sample, is expected to vary sinusoidally with θ, with a period of 180°:
I/Imax = In + Ipcos2(θ - ϕ)
Here, the maximum intensity, given by In+Ip, will be observed when θ=ϕ; the minimum
intensity, given by In, when θ−ϕ=90°. ; and the average intensity I0=In+½Ip. From this
expression, we see that
I∥ = In+Ipcos2(-ϕ) = In + Ipcos2ϕ
I⊥ = In+Ipcos2(90°-ϕ) = I
n + Ip(1- cos2ϕ)
Substituting these into the expression for P above gives
P = Ip
Ip + 2Incos 2ϕ
Here, it can be seen that Ip/(Ip+2In), which we refer to as Pmax, is a positive number that is
characteristic of the amplitude of oscillation and is equal to the maximum value of the
polarization P (i.e. if it were measured with respect to the transition dipole such that ϕ =
0).
Values for Pmax and ϕ can be obtained from a least-squares fit of I/Imax data. However, in
the absence of any actual polarization, there are likely to be fluctuations in intensity among
the data points that lead to a non-zero fit value for Pmax, with random ϕ. It can be seen that
regardless of the distribution of Pmax values, the polarization P = Pmax cos 2ϕ will average
to zero in a sample with randomly-oriented polarization angles ϕ. Thus, for each crystal,
the polarization P is reconstructed from the fit values of Pmax and ϕ. The average and
sample standard deviation of P for all crystals observed is computed, and a confidence limit
Disorder in transition dipole orientations: The maximum polarization Pmax observed for
single fibers will be diminished in the case of disorder in EDTM of the fluorophores.
Simple distributions that can be compared with experiment include static dipoles
distributed symmetrically about the axis at a uniform angle (hollow cone); static dipoles
distributed evenly over a spherical section within a characteristic angle (static cone); and
dipoles that experience rotational diffusion over a spherical section within the decay
lifetime (wobble in cone).4 The use of unpolarized emission and detection channels in our
experiment requires a modified approach from those used previously to analyze in conical
distributions of fluorophores, e.g. in randomly oriented micelles.
We consider the case of an ensemble of molecules, with co-linear excitation and emission
dipoles, whose distribution is described by a probability density n(α,ω), where α is the tilt
angle away from the channel axis (z direction) and ω is an azimuthal angle. Upon
illumination, the distribution f(α,ω) of excited dipoles is given by
f(α,ω)=(Ex∥cos2α+Ex⊥sin2αsin2ω) n(α,ω)
where Ex|| represents the excitation power parallel to the axis and Ex⊥ the power
perpendicular. For an excitation polarization measurement, the selected polarization is 1
while the other is 0. For an emission polarization experiment, Ex|| = Ex⊥ = 1.
The distribution of excited state fluorophores can then be integrated to obtain values
proportional to the parallel and perpendicular polarization components of the light emitted
by the sample:
Em∥=∫ dα
π/2
0
∫2πsinα dω f(α,ω)cos2α 0
Em⊥=∫ dα
π/2
0
∫ sinα dω f(α,ω)sin2αsin2ω
2π
For an excitation polarization measurement, these components are added together to obtain
the total intensity emitted under each excitation condition. For an emission polarization
experiment, the two emitted components can be plugged in directly for I|| and I⊥ to obtain
the polarization. The integrals were solved numerically for the current analysis.
In the case of dynamic disorder (rotational diffusion), the excited state population f(α,ω)
can be allowed to evolve before the emitted light intensities are calculated. In the limit of
complete relaxation, f(α,ω) can be simply replaced with the static (equilibrium)
distribution, but scaled according to the total amount of excitation that was achieved under
parallel or perpendicular excitation:
f∞(α,ω) = n(α,ω) × ∬f(α,ω)
∬n(α,ω)
This description of the polarization neglects trivial causes of depolarization that include
common-mode background contributions from host fluorescence and attenuation or
APPENDIX B
OPTIMIZED COORDINATES FOR THE OPTIMIZED HOST-GUEST
COMPLEX
optimized (PBEsol-D3/DZP) coordinates (in Å) for the optimized host-guest complex model corresponding to Figure 3.11. Host atom positions are derived from CIF file describing 1 crystallized from nitrobenzene as published in Ref. 1.
Table B.1 Optimized (PBEsol-D3/DZP) coordinates (in Å) for the optimized host-guest complex model corresponding to Figure 3.11.
Atom x y z
C 2.890624 -5.33478 5.790823
C 0.576812 -5.29449 6.621409
H 0.646998 -5.58634 7.565312
H 0.41675 -6.09461 6.061508
C -0.57245 -4.3234 6.469813
C -1.23982 -3.83293 7.572299
H -0.99405 -4.13368 8.440252
C -2.26533 -2.90587 7.436805
H -2.70837 -2.57327 8.209365
C -2.64514 -2.46412 6.175736
C -1.99303 -2.97332 5.054415
H -2.25122 -2.68944 4.184031
C -0.97031 -3.89149 5.206618
H -0.53027 -4.23392 4.436184
C -3.70286 -1.4949 6.006824
C -5.57483 0.302547 5.569354
C -6.43675 0.746637 6.576143
H -6.37486 0.380778 7.449868
C -7.38513 1.725698 6.29604
H -7.97301 2.024101 6.97898
C -7.47715 2.266289 5.027377
H -8.12252 2.93992 4.846312
C -6.62904 1.827352 4.016638
C -5.68096 0.844543 4.288538
H -5.10283 0.541456 3.597699
C -6.7132 2.387618 2.687822
C -6.75694 2.815781 1.562247
C -6.82243 3.223801 0.193026
C -7.99891 3.296879 -0.5127
H -8.82033 3.132453 -0.06308
C -8.01821 3.604182 -1.85853
H -8.84934 3.610272 -2.31726
C -6.89877 3.893684 -2.53691
C -5.62877 3.837939 -1.86157
H -4.82154 3.997212 -2.33549
C -5.60714 3.5475 -0.50966
H -4.78087 3.561553 -0.03877
C -6.90651 4.20333 -4.01337
H -7.72966 3.82857 -4.41348
H -6.9327 5.18567 -4.13398
N 3.975833 -4.57261 5.470011
N 1.816448 -4.64475 6.211584
H 1.8666 -3.76547 6.255939
O 2.905279 -6.57898 5.727633
C -4.67258 4.437087 -5.04204
C -2.35877 4.3968 -5.87262
H -2.42896 4.688644 -6.81652
H -2.19871 5.196912 -5.31272
C -1.20951 3.425703 -5.72103
C -0.54214 2.935236 -6.82351
H -0.78791 3.235981 -7.69146
C 0.483366 2.008173 -6.68802
H 0.926413 1.675574 -7.46058
C 0.863182 1.566425 -5.42695
C 0.211065 2.07563 -4.30563
H 0.469255 1.791749 -3.43524
C -0.81165 2.993792 -4.45783
H -1.25169 3.336229 -3.6874
C 1.920897 0.597202 -5.25804
C 2.781547 -0.20525 -5.09064
C 3.792873 -1.20024 -4.82057
C 4.654788 -1.64433 -5.82736
H 4.592902 -1.27847 -6.70108
C 5.603167 -2.62339 -5.54725
H 6.191046 -2.9218 -6.23019
C 5.695186 -3.16398 -4.27859
H 6.340557 -3.83761 -4.09752