University of Windsor University of Windsor
Scholarship at UWindsor
Scholarship at UWindsor
Electronic Theses and Dissertations Theses, Dissertations, and Major Papers
2015
Investigating Potential Combinations of Visual Features towards
Investigating Potential Combinations of Visual Features towards
Improvement of Full-Reference and No-Reference Image Quality
Improvement of Full-Reference and No-Reference Image Quality
Assessment
Assessment
Ashirbani Saha
University of Windsor
Follow this and additional works at: https://scholar.uwindsor.ca/etd
Part of the Computer Engineering Commons, and the Electrical and Computer Engineering Commons
Recommended Citation Recommended Citation
Saha, Ashirbani, "Investigating Potential Combinations of Visual Features towards Improvement of Full-Reference and No-Full-Reference Image Quality Assessment" (2015). Electronic Theses and Dissertations. 5709.
https://scholar.uwindsor.ca/etd/5709
INVESTIGATING POTENTIAL COMBINATIONS OF VISUAL FEATURES TOWARDS IMPROVEMENT OF FULL-REFERENCE AND NO-REFERENCE
IMAGE QUALITY ASSESSMENT
by
Ashirbani Saha
A Dissertation
Submitted to the Faculty of Graduate Studies
through the Department Electrical and Computer Engineering in Partial Fulfillment of the Requirements for
the Degree of Doctor of Philosophy at the University of Windsor
Windsor, Ontario, Canada
2015
Investigating Potential Combinations of Visual Features towards Improvement of Full-Reference and No-Reference Image Quality Assessment
by Ashirbani Saha
APPROVED BY:
Dr. T. D. Bui,
Department of Computer Science and Software Engineering, Concordia University
Dr. I. Ahmad,
School of Computer Science
Dr. M. Ahmadi,
Electrical and Computer Engineering
Dr. N. C. Kar,
Electrical and Computer Engineering
Dr. Q. M. Jonathan Wu, Advisor, Electrical and Computer Engineering
Declaration of Co-Authorship/Previous
Publications
I. Co-Authorship Declaration
I hereby declare that this dissertation incorporates material that is result of joint
research, as follows:
This dissertation also incorporates the outcome of research undertaken under the
supervision of and in collaboration with professor Dr. Q. M. Jonathan Wu. The
collaboration is covered through Chapters 3, 4, 5 and 6 of the dissertation. In all
cases, the key ideas, primary contributions, experimental designs, data analysis and
interpretation, were performed by the author, and the contribution of the collaborator
was primarily through the provision of valuable suggestions for the representation of
ideas, for the analysis of the results for the experiments carried out and editorial
activities throughout the process of dissemination of the work.
I am aware of the University of Windsor Senate Policy on Authorship and I certify
that I have properly acknowledged the contribution of other researchers to my
disser-tation, and have obtained written permission from the only co-author to include the
above material in my dissertation.
I certify that, with the above qualification, this dissertation, and the research to
which it refers, is the product of my own work.
II. Declaration of Previous Publication
This dissertation includes 5 original papers that have been previously published/submitted
Chapter Publication title/full citation Publication
status
Chapter 3 A. Saha and Q. M. Jonathan Wu, “Perceptual
Image Quality Assessment Using Phase
Devia-tion Sensitive Energy Features Elsevier Signal
Processing, 93(11), 3182-3191, 2013.
Published
A. Saha and Q. M. Jonathan Wu, “A Study on
Using Spectral Saliency Detection Approaches
for Image Quality Assessment”, in proceedings
of International Conference on Acoustics, Speech
and Signal Processing(ICASSP), 2013,
pp.1889-1893, Vancouver, Canada.
Published
Chapter 4 A. Saha and Q. M. Jonathan Wu,
“Full-Reference Image Quality Assessment by
Com-bining Global and Local Distortion Measures”,
2013
Submitted
Chapter 5 A. Saha and Q. M. Jonathan Wu, “High
Fre-quency Content based Stimulus for Perceptual
Sharpness Assessment in Natural Images”, 2014
Submitted
Chapter 6 A. Saha and Q. M. Jonathan Wu, “Utilizing
age scales towards totally training free blind
im-age quality assessment”, IEEE Trans. on Imim-age
Processing, 2015
Accepted
with minor
revisions
I certify that I have obtained a written permission from the copyright owner(s) to
material describes work completed during my registration as graduate student at the
University of Windsor.
I declare that, to the best of my knowledge, my dissertation does not infringe
upon anyones copyright nor violate any proprietary rights and that any ideas,
tech-niques, quotations, or any other material from the work of other people included in
my dissertation, published or otherwise, are fully acknowledged in accordance with
the standard referencing practices. Furthermore, to the extent that I have included
copyrighted material that surpasses the bounds of fair dealing within the meaning of
the Canada Copyright Act, I certify that I have obtained a written permission from
the copyright owner(s) to include such material(s) in my dissertation.
I declare that this is a true copy of my dissertation, including any final revisions,
as approved by my dissertation committee and the Graduate Studies office, and that
this dissertation has not been submitted for a higher degree to any other University
Abstract
Objective assessment of image quality is the process of automatic assignment of a
scalar score to an image such that the rating or score corresponds to the score
pro-vided by the Human Visual System (HVS). Despite extensive studies since the last
two decades, it remains a challenging problem in image processing due to the
pres-ence of different types of distortions and limited knowledge of the HVS. Existing
approaches for assessing the perceptual quality of images have relied on a number of
methodologies that directly apply known properties of the HVS, construct hypotheses
considering the HVS as a blackbox and use hybrid approaches that apply both of the
techniques. All of these methodologies have relied on different types of visual features
for Image Quality Assessment (IQA).
In this dissertation, we have studied the problem of different types of IQA from the
feature extraction point of view and showed that effective combinations of simple
vi-sual features can be used to develop IQA approaches having competitive performance
with the state-of-the-art. Our work is divided into four parts each having the final
goal to bring about performance improvement in the areas of Full-Reference (FR)
and No-Reference (NR)-IQA. We have gradually moved from FR to NR-IQA in the
works presented in this dissertation. First, we propose improvements in two existing
FR-IQA techniques by introducing changes in the features used. Next, we propose a
new FR-IQA technique by extracting image saliency as global features and combining
them with the local features of gradient and variance to improve the performance.
For NR-IQA, we propose a novel technique for sharpness detection in natural images
using simple features. The performance of this method provides improvement over
the existing methods. After working with the specific purpose NR-IQA, we propose a
general purpose technique using suitable features such that no training with pristine
having no reliance on training, provides competitive performance with the
state-of-the-art techniques. The main contribution of the dissertation lies in identification
and analysis of effective features and their combinations for improving three different
Dedication
to
the loving memory,
of
my aunt Jyotsna Gayen
and
my grandparents
Sneha Lata and Pasupati Nath Saha
and
Acknowledgements
I would like to thank my supervisor Dr. Q. M. Jonathan Wu for all his support
during the entire program, patience and belief in my abilities. I thank my committee
members Dr. M. Ahmadi, Dr. N. C. Kar and Dr. I. Ahmad for their valuable
sug-gestions and insightfulness. I thank the external examiner Dr. T. D. Bui for all his
suggestions and help in improving the quality of the dissertation. I would extend my
gratitude towards Dr. B. Shahrrava for his guidance during my coursework with him.
I would like to take this opportunity to express my gratitude towards my mentors
whom I met during my high school and undergraduate studies for motivating me to
carry on the pursuit of knowledge. As learning is a never-ending process that
per-meates throughout the life, I humbly offer my gratitude to mother nature for making
me a part of it and for helping me to realize it.
I would like to thank our departmental graduate secretary, Ms. Andria Ballo for
all her help during my studies at the University of Windsor. I thank the Student
Health Services at the University of Windsor for helping me to learn a better lifestyle
during these strenuous years. My colleagues and friends in the CVSS Laboratory
have been helpful, supportive and source of several good memories I have gathered
during my studies. I thank the city of Windsor for the friendly environment it offered
and for being my home away from home.
Back in India, my family has been with me always with unconditional love and
support. I express my love and respect for my father who always taught me to aim
higher. My mother has been my support throughout my life in every aspect and
put stupendous effort into my upbringing. I thank God for blessing me with such
wonderful parents. I thank my loving elder sister and her family for being there
beside my parents and taking care of them. My uncle and aunts have also motivated
embodiment of diligence and inspired me to question my efforts. At the same time,
his and my mother-in-law’s optimism and faith in my abilities have been important
sources of my motivation.
My husband, Dibyendu, has stood by me through thick and thin, and has
em-boldened my spirits from time to time towards chasing my dreams. Besides writing
his own dissertation, he made enormous efforts to tie all the loose ends of our lives
Table of Contents
Page
Declaration of Co-Authorship/Previous Publications . . . . iii
Abstract . . . . vi
Dedication . . . . viii
Acknowledgements . . . . ix
List of Tables . . . . xv
List of Figures . . . . xvii
List of Abbreviations . . . . xx
1 Introduction . . . . 1
1.1 What is Image Quality Assessment? . . . 1
1.2 Subjective Methods of Image Quality Assessment . . . 2
1.3 Objective Methods of Image Quality Assessment . . . 5
1.3.1 Significance of IQA Databases . . . 6
1.3.2 Techniques to Evaluate an IQA Method . . . 8
1.3.3 Applications . . . 10
1.3.4 Challenges . . . 10
1.4 Motivation . . . 11
1.5 Objective and Scope . . . 12
1.6 Main Attributes . . . 12
1.7 Organization . . . 13
2 Related Works . . . . 15
2.1 FR-IQA Techniques . . . 15
2.2 NR-IQA Techniques for Perceived Sharpness Evaluation . . . 21
2.2.1 Spatial Domain based Techniques . . . 21
2.2.3 Hybrid Techniques . . . 23
2.3 General Purpose NR-IQA Techniques . . . 24
2.4 Discussion on the Existing Approaches . . . 27
3 Improvements in Existing Methods . . . . 29
3.1 Introduction . . . 29
3.2 From FSIM to PDSESIM . . . 32
3.2.1 Phase Congruency . . . 32
3.2.2 Proposed Modification . . . 37
3.2.3 Experimental Results . . . 40
3.2.4 Discussion . . . 48
3.3 Comparison of Spectral Saliency based Techniques . . . 48
3.3.1 Selected Spectral Approaches . . . 49
3.3.2 Experimental Evaluation . . . 51
3.4 Chapter Summary . . . 54
4 Full-reference image quality assessment by combining global and local distortion measures . . . . 61
4.1 Basic Idea . . . 62
4.2 Motivating Factors . . . 63
4.2.1 Global Features . . . 64
4.2.2 Local Features . . . 65
4.2.3 Correlation between the Feature Maps . . . 67
4.3 Proposed Method . . . 69
4.3.1 Global and Local Feature Extraction . . . 69
4.3.2 Formation of Distortion Map . . . 73
4.3.3 Analysis using an Example . . . 75
4.4 Experiments and Performance Analysis . . . 76
4.4.1 Average Performance Comparison . . . 78
4.4.3 Distortion wise Performance Comparison . . . 81
4.4.4 Discussion on the Parameters . . . 86
4.5 Chapter Summary . . . 88
5 No-reference Perceptual Sharpness Assessment using High Fre-quency Content . . . . 89
5.1 Proposed Method . . . 90
5.2 Experiments and Results . . . 94
5.2.1 Different Blur Levels in Same Pristine Image . . . 96
5.2.2 Different Blur Levels for Different Pristine Images . . . 97
5.2.3 Performance in Four Databases . . . 100
5.2.4 Comparisons with Other Methods . . . 100
5.3 Chapter Summary . . . 104
6 Utilizing Image Scales for No-Training NR-IQA . . . . 108
6.1 Motivation . . . 109
6.2 Features and their Significance . . . 110
6.2.1 Scale-Space . . . 110
6.2.2 Wavelet Decomposition . . . 111
6.2.3 Fourier Transform . . . 112
6.2.4 Co-occurrence Histograms . . . 114
6.3 Formulation of BIQES . . . 115
6.3.1 Computation of Distortion from Low Pass Versions . . . 115
6.3.2 Computation of Distortion from High Pass Versions . . . 118
6.3.3 Combination of the Errors . . . 120
6.4 Experiments and Results . . . 124
6.4.1 Experiments with the Proposed Method . . . 124
6.4.2 Comparison with Other Methods . . . 127
6.4.3 A Look at the Common Limitations . . . 131
7 Conclusion . . . . 136
7.1 Contributions and Limitations . . . 136
7.1.1 FR-IQA . . . 136
7.1.2 Specific Purpose NR-IQA . . . 138
7.1.3 General Purpose NR-IQA . . . 139
7.1.4 General Summary . . . 140
7.2 Scope for Future Work . . . 141
7.2.1 FR-IQA . . . 141
7.2.2 Specific Purpose NR-IQA . . . 142
7.2.3 General Purpose NR-IQA . . . 142
References . . . . 143
Appendix A : Copyright Permissions . . . . 159
List of Tables
3.1 Distortion-wise performance comparison of PDSESIM using SROCC . 45
3.2 Overall performance comparison of PDSESIM in six databases . . . . 47
3.3a Average performance comparison of PDSESIM in six databases . . . 57
3.3b Execution time comparison of PDSESIM . . . 57
3.4 Parametersϵ1 andϵ2 used for different spectral saliency based FR-IQA framework . . . 58
3.5 Performance of different spectral saliency approaches used in the FR-IQA framework in six databases . . . 59
3.6 Average performance of different spectral saliency approaches used in the FR-IQA framework across six databases . . . 60
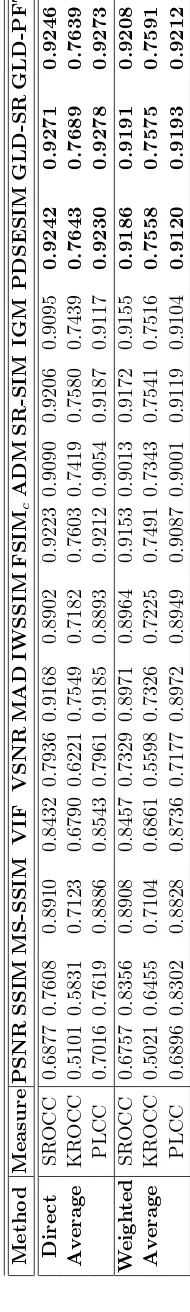
4.1 Average performance comparison of GLD-SR and GLD-PFT over six databases . . . 79
4.2 Performance evaluation and comparison of GLD-SR and GLD-PFT in six databases . . . 82
5.1 Comparison of HPFSM and UWTSM with the existing techniques in four databases . . . 105
5.2a Direct average comparison of HPFSM and UWTSM with existing tech-niques over four databases . . . 107
5.2b Weighted average comparison of HPFSM and UWTSM with existing techniques over four databases . . . 107
6.1 List of symbols and their significance . . . 110
6.2 Performance comparison of BIQES in the LIVE database . . . 132
6.4 Performance comparison of BIQES in the CSIQ database . . . 133
6.5 Performance comparison of BIQES in the TID2008 database . . . 133
List of Figures
1.1 Types of trials in different subjective methods for assessing image quality 4
2.1 Comparison of FR-IQA techniques based on bottom-up, top-down and
hybrid approaches . . . 16
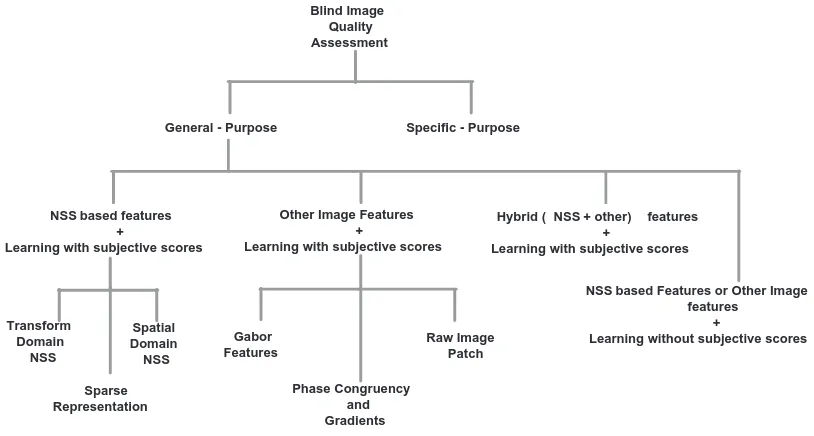
2.2 Different types of BIQA methods . . . 24
3.1 Block diagram of the framework used in FSIM . . . 30
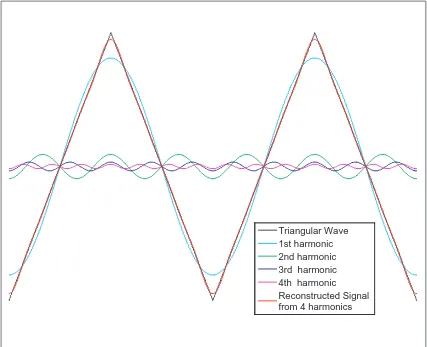
3.2 Demonstration of phase congruency among the harmonics of a
trian-gular wave and reconstructed signal using four harmonics . . . 33
3.3 Difference between the phase congruency maps and energy maps of a
reference image and corresponding noisy images . . . 39
3.4 Dependence of SROCC on parameters ϵ1 and ϵ2 . . . 42
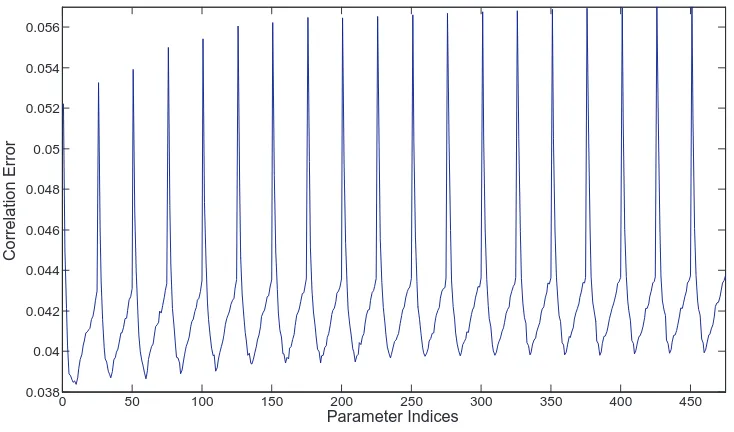
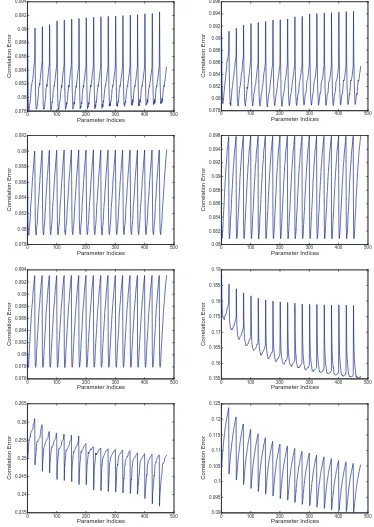
3.5 Variation of correlation error with parameter indices using PDSESIM 43
3.6 Variation of correlation error with parameter indices for different
spec-tral saliency based FR-IQA techniques . . . 53
3.7 Scatter plots of subjective scores versus the PDSESIM scores . . . 56
4.1 Variations of saliency maps of two types of distorted images generated
from a common reference image . . . 66
4.2 Variations of RMS contrast and gradient maps of two types of distorted
images generated from a common reference image . . . 68
4.3 Images showing different types of feature maps formed using image
saliency, x and y-gradients . . . 70
4.4 A schematic diagram of the proposed framework used in GLD-SR and
4.5 Distortion maps and scores obtained using GLD-SR for different
de-graded images generated from the same reference image . . . 77
4.6 F-ratio test for comparing GLD-SR with thirteen other FR-IQA
tech-niques in six databases . . . 83
4.7 F-ratio test for comparing GLD-PFT with thirteen other FR-IQA
tech-niques in six databases . . . 84
4.8 Distortion wise SROCC score comparison of GLD-SR and GLD-PFT
in LIVE, CSIQ and TID2008 databases . . . 87
5.1 Block Diagram of the proposed method for evaluating perceptual
sharp-ness . . . 90
5.2 Variation of SROCC scores for different values ofα using HPFSM and
UWTSM . . . 95
5.3 Sharpness maps and quality score for different levels of blur over the
same pristine image from LIVE database for HPFSM and UWTSM . 99
5.4 The variations of the objective scores with the Gaussian blurσin LIVE
database using HPFSM and UWTSM . . . 101
5.5 Sharpness maps for different images in [101] . . . 102
5.6 Scatter plots between the objective and subjective scores for blurred
images. . . 103
6.1 Log amplitude of Fourier transform for different degraded images
gen-erated from the same reference image. . . 113
6.2 Co-occurrence histograms in different scales for original image and its
distorted versions . . . 116
6.3 Block Diagram of the proposed method BIQES . . . 117
6.4 Changes in SROCC values in LIVE database using different number
6.5 Performance of the low pass error on different degraded images using
scatter plots. . . 128
6.6 Performance of the high pass error on different degraded images using
scatter plots. . . 129
List of Abbreviations
ADM Additive and Detailed Loss based Measure
apgn additive pink Gaussian noise
awgn additive white Gaussian noise
awgn-pink more intense additive Gaussian noise in color channels
compared to luminance channels
BIQA Blind Image Quality Assessment
BIQES Blind Image Quality Evaluator based on Scales
BIQI Blind Image Quality Index
blockwise-distortion local block-wise distortions of different intensities
BRISQUE Blind/Referenceless Image Spatial Quality Evaluator
CBIQ Codebook based Image Quality
CORNIA Codebook Representation for No-Reference Image
Assessment
CSF Contrast Sensitivity Function
CSIQ Categorical Subject Image Quality
DCT Discrete Cosine Transform
DMOS Differential Mean Opinion Score
DSIS Double Stimulus Impairment Scale
DWT Discrete Wavelet Transform
Eigen SR Eigen Spectral Residual
Eigen PQFT Eigen Phase of Quaternion Fourier Transform
FR Full-Reference
FT Fourier Transform
FSIMc Feature-Similarity Index for Color Images
FSIM Feature-Similarity Index
gblur Gaussian blur
global-contrast global contrast decrement
GSM Gaussian Scale Mixture
GSSIM Gradient based Structural Similarity
HFT Hypercomplex Fourier Transform
HPF High Pass Filter
HPFSM High Pass Filter based Sharpness Measure
HVS Human Visual System
IFC Information Fidelity Criterion
IGM Internal Generative Mechanism
IQA Image Quality Assessment
IVC IRCCyN/IVC Image Quality Database
IWSSIM Information-Content Weighted Structural Similarity Index
JNB Just Noticeable Blur
jpeg JPEG compression
jpeg2k JPEG2000 compression
jpeg2k-trans-error JPEG2000 transmission errors
jpeg-trans-error JPEG transmission errors
KROCC Kendall’s Rank-Order Correlation Coefficient
LIVE Laboratory for Image and Video Engineering
LPC-SI Local Phase Coherence Sharpness Index
LQF Latent Quality Factors
MAD Most Apparent Distortion
MAE Mean Absolute Error
MICT Multimedia Information and Communication Technology
MOS Mean Opinion Score
MSSSIM Multiscale Structural Similarity Index
MVG Multivariate Gaussian Model
NIQE Natural Image Quality Evaluator
NR No-Reference
NSS Natural Scene Statistics
pattern-noise non eccentricity pattern noise
PC Phase Congruency
PDSESIM Phase Deviation Sensitive Energy Features based Similarity
PFT Phase Fourier Transform
PLCC Pearson’s Linear Correlation Coefficient
PQFT Phase of Quaternion Fourier Transform
PS Programme Segment
PSF Point Spread Function
PSNR Peak-Signal-to-Noise Ratio
QAC Quality Aware Clustering
QDCT Quaternion Discrete Fourier Transform
QFT Quaternion Fourier Transform
RMS Root Mean Squared
RMSE Root Mean Squared Error
RR Reduced-Reference
spatial-corr-noise spatially correlated noise
SR Spectral Residual
SRNSS Sparse Representation of Natural Scene Statistics
SR-SIM Spectral Residual based Similarity
SSCQE Single Stimulus Continuous Quality Evaluation
SSIM Structural Similarity Index
SVD Singular Value Decomposition
SVM Support Vector Machine
SVR Support Vector Regressor
TC Test Condition
TID2008 Tampere Image Quality Database 2008
TS Test Session
UWT Undecimated Wavelet Transform
UWTSM Undecimated Wavelet Transform based Sharpness Measure
VIF Visual Information Fidelity
VQEG Video Quality Experts Group
VSNR Visual-Signal-to-Noise Ratio
Chapter 1
Introduction
The work presented in this dissertation is related to the investigation of
improve-ments in full-reference and no-reference image quality assessment using feature
com-binations. Before delving into the details of the work proposed here, we discuss some
preliminaries related to the work along with the motivation and objective of the
proposed research.
1.1
What is Image Quality Assessment?
The set of words ‘Image Quality Assessment’, when taken literally, amounts to the
evaluation of certain attributes of images. However, the phrase has a restricted and
specific meaning when studied under the context of modern image processing. Image
Quality Assessment (IQA) refers to the automatic evaluation of the quality of digital
images in keeping with the judgment of humans. Quality of any image refers to its
collective attributes that determine its appearance and ability to convey information
to the human observer. Hence, this quality is purely subjective in nature. Thus, IQA
techniques aim to automatically predict the image quality by using mathematical
and computational models in keeping with the human observers. Many a times,
the phrase ‘objective image quality assessment’ is used specifically to differentiate
the process of automatic evaluation of perceptual image quality from the subjective
evaluation of image quality. The subjective evaluation of image quality is necessary
for several image processing applications as human beings are the ultimate users and
and objective methods of image quality assessment to understand their respective
needs towards improving image processing methodologies. In the remaining part of
this dissertation, the image assessed for quality evaluation is termed as a test or query
or distorted image. The pristine quality counterpart of the test image, if exists, is
called the reference image. The same applies when image sequences are discussed
instead of images.
1.2
Subjective Methods of Image Quality
Assess-ment
Subjective evaluation is considered to be the most reliable way of assessing the image
quality [111]. However, any human observer has his own perception of quality which
may differ from that of other observers. Hence, subjective methods employ the opinion
of many viewers to evaluate the quality of any image. The observers need to rate any
image under identical viewing conditions and also need to have a pre-defined rating
scale to maintain uniformity throughout the evaluation process. Hence, International
Telecommunication Union (ITU) has recommended some standards for carrying out
subjective tests for quality assessment of images. The basic set of recommendations
is provided in ITU-R Rec.BT.500 [26] through the work of Video Quality Experts
Group (VQEG). Though the recommendations are presented for videos, they are
equally applicable to images as videos consist of sequence of images. Depending on
the type or variations in the stimulus presented to the observers and scale of ratings
provided, the three commonly used test methodologies are as follows:
1. Double Stimulus Continuous Quality Scale (DSCQS): In this procedure,
multiple sequence pairs comprising of reference and test sequences are displayed
to the human observer twice. The duration of the sequences is restricted to the
order of appearance of the reference and the test images as the order is decided
randomly in each trial. An example of such a trial is presented in Fig. 1.1(a).
Here, S1 and S2 are two sequences forming a reference and test sequence pair,
not necessarily in the same order as mentioned. They are displayed twice after
which the observer provides ratings for each of S1 and S2 in a numerical
contin-uous scale ranging from 0 to 100 as shown in Fig. 1.1(d). The difference of these
two ratings is considered as the rating of the test sequence, as it is reasoned to
remove the subjective bias caused by the observer experience and the sequence
content.
2. Double Stimulus Impairment Scale (DSIS): Though this is also a double
stimulus procedure, the presentation of stimulus varies in two different ways
from that in DSCQS. Firstly, the reference sequence is always presented before
the test sequence. Secondly, there is no repetition of the same sequence pair.
Each trial of this standard is shown in Fig. 1.1(b). The user rating is provided for
the test sequence in a discrete five-level scale which is shown in Fig. 1.1(e). The
scale assesses the visibility of degradation present in test images as compared
with the reference image and classifies from ‘imperceptible’ to ‘very annoying’
as presented in the figure.
3. Single Stimulus Continuous Quality Evaluation (SSCQE): As the name
itself says single stimulus, only the test sequence can be displayed to the
ob-server. However, the sequences are much longer in duration and this method
enables the collection of observer ratings dynamically with the help of a slider.
The ratings are provided in continuous scale. The stage 1 test protocol for this
method comprises of set Test Session (TS) (without separation) which is at least
30 minutes in duration. Each TS is segregated to a Programme Segment (PS)
(duration of at least 5 minutes) signifying a specific type of video content (for
param-0 100
(d) Bad Poor Fair Good Excellent
Very Annoying Annoying
Slightly Annoying Perceptible, but not annoying Imperceptible
(e) (a)
(c) (b)
Rate
S1 S2
TS
PS PS PS
Continuously Rate
Rate
S1 S2 S1 S2
Figure 1.1: Trials in (a)DSCQS (b)DSIS and (c)SSCQE representing the variations in the stimuli. Continuous quality scale is presented in (d) and discrete scale is shown in (e).
eter or Test Condition (TC). Rating is provided by the user at a frequency
of two ratings per second. The relevant diagram for this method is shown in
Fig. 1.1(c).
Each of these procedures has different types of utilities that are suited to varying
applications and suffers from limitations [120]. Since DSCQS techniques allow rapid
evaluation of a test sequence with the help of reference after double viewing, the
procedure works well to identify small differences in quality between the reference
and test images. On the other hand, clearly visible degradations are better evaluated
by DSIS. However, these methods rely on human memory and suffer from recency
effect implying that more weight will be placed on whatever is retained by the
mem-ory. In this case, usually more weight is placed on the degradation seen in last 5-10
seconds [12]. Also, repetition and use of the reference image make the user familiar
with the image content. Based on these drawbacks, SSCQE is developed and it finds
evalua-tion. However, it has video content bias and is affected by the reaction times of the
observers.
All of the test procedures discussed above need a minimum number of human
observers to perform the related tasks. All the human observer ratings collected are
then used to form the Mean Opinion Score (MOS) for each test sequence. However, in
the updated report [107] by VQEG, Differential Mean Opinion Score (DMOS) scores,
calculated using the difference between the rating for test and reference images, are
used as subjective scores. Thus, the subjective methods require the support of human
observers making it less economical and slow to be suited for real-world applications
in image processing [111]. Therefore, objective methods for assessing the perceptual
quality of images are needed for many real-world applications. However, for the
performance evaluation of objective IQA methods, subjective scores in the form of
MOS or DMOS are needed and subjective methods are applied to generate these
scores in the existing databases.
1.3
Objective Methods of Image Quality
Assess-ment
Objective methods of assessing image quality come up with a scalar score generated
by computational models. The scalar score represents the quality of the test image. If
the generation of the score requires the help of full information from the
correspond-ing reference image, the method is called Full-Reference (FR). If no information is
used from the corresponding reference image, the objective IQA technique is called
No-Reference (NR). NR-IQA is also called Blind Image Quality Assessment (BIQA).
Throughout this dissertation, these two terms will be used interchangeably. If partial
information from the corresponding reference image is used to produce the objective
By partial information, we refer to some features (for example, mean, variance, edge
information etc.) available from the reference image, instead of the availability of the
reference image itself. Further details about this classification can be found in [111].
As the works proposed in this dissertation are related to FR and NR-IQA, we have
devoted the Chapter 2 of our dissertation for the earlier works related to these.
How-ever, the evaluation methodology and databases used for FR and NR-IQA bear a lot
of similarity. Hence, we discuss about the databases and evaluation methodologies in
the current chapter. Also, the applications of objective IQA techniques are discussed
in details.
1.3.1
Significance of IQA Databases
In general, the databases used for IQA contain pristine quality images which can be
used as reference images along with the distorted images and corresponding MOS/DMOS
values. They may also contain information about the type and intensity of
degra-dation applied to the pristine image to generate the distorted image, the number
of human observers employed, the raw scores provided by the observers and details
about the subjective tests conducted to generate the MOS/DMOS values.
Through-out our work, we have used all or relevant ones from a set of six benchmark databases
which are most commonly used for the evaluation of objective IQA techniques. The
details of these six databases are as follows:
1. Laboratory for Image and Video Engineering (LIVE) Database [94]:
The database is developed by LIVE at the University of Texas at Austin, USA.
It consists of 29 reference and 779 distorted color images rated by 29 subjects.
Images degraded by five types of distortions namely, JPEG compression (jpeg),
JPEG2000 compression (jpeg2k), white noise (wn), Gaussian blur (gblur), and
JPEG2000 bit error generated by transmission through a simulated Rayleigh
numbers of images with each of these degradations are 169, 175, 145, 145 and
145 respectively. These distorted images were generated with 5-6 levels of the
corresponding distortion. The subjective scores are given in the form of DMOS
and lie in the range 0-112.
2. Categorical Subject Image Quality (CSIQ) Database[42]: The database
is developed by the Oklahoma State University, USA with the help of 35
subjects. It consists of 30 reference and 866 distorted color images. Images
having six types of distortions namely, jpeg, jpeg2k, additive white Gaussian
noise (awgn), gblur, additive pink Gaussian noise (apgn) (also called fnoise),
and global contrast decrement (global-contrast) are present in the database.
Every distortion type except the global contrast decrement (116 images) has
150 images each. 4-6 distortion levels were applied on the pristine images to
generate them. The subjective scores are given in the form of DMOS and lie in
the range between 0-1.
3. Tampere Image Quality Database 2008 (TID2008) [79]: The database
is developed by Tampere University of Technology, Finland with the help of
838 human observers. It has 1700 distorted images generated from a set of 25
pristine color images. 17 types of distortions are applied with 4 different levels
on each pristine image. The distortions present in the database are awgn, more
intense additive Gaussian noise in color channels compared to luminance
chan-nels (awgn-pink), spatially correlated noise (spatial-corr-noise), masked noise,
high frequency noise, impulse noise, quantization noise, gblur, denoising, jpeg,
jpeg2k, JPEG transmission errors (jpeg-trans-error), JPEG2000 transmission
errors (jpeg2k-trans-error), non eccentricity pattern noise (pattern-noise), local
block-wise distortions of different intensities (blockwise-distortion), and
con-trast change. The subjective scores are given in the form of MOS and lie in the
4. A57 Database[8]: This database is developed at the Cornell University, USA
with the help of 15 human observers. It consists of 3 reference grayscale images
and 54 distorted images generated by 6 distortions in three different levels. The
distortions are jpeg, jpeg2k, awgn, jpeg2k using the dynamic contrast based
quantization, gblur, and uniform quantization applied on the LH subband of a
5-level Wavelet decomposition of the pristine image. The subjective scores lie
in the range between 0-1.
5. Multimedia Information and Communication Technology (MICT)
Database [30]: The database is developed by MICT Laboratory at the
Uni-versity of Toyama, Japan with the help of 16 human observers. There are 14
reference color images and only two types of distortions jpeg and jpeg2k are
applied at 6 different levels to each of these reference images to generate 168
distorted images (84 for each distortion). The subjective scores are given in the
form of MOS and lie in the range 1-5.
6. IRCCyN/IVC Image Quality Database [4]: The database is developed
by Institut de Recherche en Communications et Cybern´etique de Nantes
(IR-CCyN), France with the help of 16 human observers. It has 10 pristine quality
images and 4 different types of distortions are applied at several levels to
differ-ent images. jpeg, jpeg2k, LAR coding, and gblur are the applied distortions. In
some images, jpeg is applied to all channels and to the luminance channel only
for generating separate images. The total number of distorted images present
in the database is 185. The subjective scores are given in the form of MOS and
lie in the range between 1-5.
1.3.2
Techniques to Evaluate an IQA Method
To evaluate the performance of an objective IQA method, five evaluation measures for
are Spearman’s Rank-Order Correlation Coefficient (SROCC), Kendall’s Rank-Order
Correlation Coefficient (KROCC), Pearson’s Linear Correlation Coefficient (PLCC),
Mean Absolute Error (MAE), and Root Mean Squared Error (RMSE). SROCC and
KROCC are non-parametric rank based correlation measures and useful for judging
the prediction monotonicity of any IQA method. Higher values of SROCC and
KROCC indicate that the objective assessment scores are more consistent with the
corresponding MOS/DMOS values and therefore the assessment method is better.
On the other hand, PLCC is a measure of prediction accuracy whereas MAE and
RMSE are the measures of prediction error [107]. Therefore, higher values of PLCC
and lower values of MAE and RMSE are desirable. For PLCC, MAE and RMSE,
a 5-parameter logistic function [93] is used for mapping between the subjective and
objective scores. The logistic function is given by
P redicted Quality(x) =β1 [
0.5− 1
1 + exp(β2(x−β3)) ]
+β4x+β5, (1.1)
where (β1, β2, β3, β4, β5) are the 5 parameters. As per [107], the logistic transform
is used to bring the objective scores in a common ground with the DMOS/MOS
by providing a non-linear mapping between them. However, this logistic function
provides monotonic non-linear mapping. The measures SROCC and KROCC are
based on magnitude-wise ranking of data values and hence do not depend on the
mapping. SROCC has been widely used due to its simplicity. Hence, we have used
SROCC for parameter selection and distortion wise performance. For analysis of the
overall performance of the proposed method(s), SROCC, KROCC, and PLCC are
used. This is because their absolute values lie between 0 and 1, irrespective of the
ranges of subjective scores in different databases. In contrast, MAE and RMSE values
1.3.3
Applications
There are three major applications of IQA as mentioned in [111]. They include
the monitoring of image quality in image processing applications, benchmarking of
image processing systems and algorithms, and optimizing image processing systems
and their parameter settings. Perceptual models of IQA and properties of Human
Visual System (HVS) have often inspired the areas of digital watermarking [33, 39]
and steganalysis [1] for better schemes. Visual quality assessment methods have
found applicability in evaluation of image fusion [87], image and video coding [115,
123], evaluation of image denoising techniques [127] and perceptual feature based
automatic parameter selection [67] for image denoising. The recent applications of
IQA include evaluation of image deblurring [55] and image super resolution [126] as
well. Stereoscopic image quality [24, 50] and medical image quality evaluation [5, 66]
have also emerged as two application based research directions for IQA.
1.3.4
Challenges
When automatic assessment of image quality emerged as a research area in image
processing, it was meant to attain an objective that was self-explanatory with a fixed
set of problems. The objective is to perceptually evaluate different types of
distor-tions as per the HVS. We have discussed about distordistor-tions in the databases already.
Evaluating different types of distortions with the limited knowledge of HVS makes
the job of image quality assessment very difficult. However, along with the research
and development taking place in this field, we have more challenges to combat with in
order to achieve a complete and practical solution. Thus, the earlier set of challenges
are prevailing and getting augmented with the newly identified significant problems
as various directions for potential solutions are revealed through different research
works. The definition of quality of an image is itself dubious as the observer’s
regarding the pristine image and earlier ideas about the image content affect the
user’s decision [99, 111]. However, due to the similarity in visual processing strategies
in humans, they can consistently judge, if a digital manipulation has enhanced or
degraded the quality of any image. The models of HVS developed mainly incorporate
the properties of V1 cortex of human brain. However, much of information from other
parts of the brain has not been incorporated and is not available for the purpose of
incorporation [7]. Also, the models are found simpler when compared to the
com-plexity of HVS and natural images [111]. The existing state-of-the-arts IQA methods
evaluate images degraded by a single type of distortion only. Also, there exists no
FR-IQA technique that works better than all others methods across all distortions
present in all databases. Hence, substantial improvement is needed to achieve this.
Researchers on NR-IQA techniques are also trying to improve their performances
amidst all the challenges prevailing.
1.4
Motivation
As discussed earlier, various application areas of IQA along with its challenging
prob-lems make it an interesting area to work with. This has invariably left a positive
influence as well as the present surge in the development of different types of IQA
methods and has created a diversity towards achieving the goal. In spite of the
lim-ited knowledge of HVS, the various methodologies that showed effectiveness towards
the partial solution of the problem are indeed fascinating. All of these methodologies
depend on different types of features and their combinations to evaluate perceptual
quality images. However, there still exist several limitations and hence the need to
improve. This has inspired us to explore, investigate and make contributions towards
the field of IQA in general. The motivation to work on each selected sub-area of IQA
1.5
Objective and Scope
The effort culminated in this dissertation has been targeted towards FR-IQA and
NR-IQA. The main objective of the dissertation is to know and explore the
state-of-the-art techniques in the related areas and be able to contribute towards some of the
existing problems by making improvements. By investigating on effective combination
of features, we have tried to contribute towards three diversified channels of IQA.
To begin with, during the initial years of the work we tried to make changes in
some of the existing approaches. Next, we have worked towards developing a novel
FR-IQA method based on diverse feature combinations and our understanding and
interpretation of perceptual quality assessment. From there on, we have tried to
work on NR-IQA using effective features. First, we focused on a distortion specific
NR-IQA. The specific distortion chosen is absence of sharpness or presence of blur
because it is one of the commonly occurring distortions. Then, we have moved on to
the general purpose NR-IQA. Through this dissertation, we have made simultaneous
efforts to gather knowledge and make contributions in the field of IQA. Our focus
in this dissertation has remained confined within the limits of various types of IQA
problems and different solution approaches to these problems using visual feature
combinations.
1.6
Main Attributes
The major attributes of the dissertation are enlisted as follows:
• As an initial step in the field of IQA, we have studied and tried to improve the existing techniques Feature-Similarity Index (FSIM) [129] and Spectral
Resid-ual based Similarity (SR-SIM) [128] by using modification of various features.
With the proposed modifications, the performance of the techniques has been
• A methodology is proposed for FR-IQA using the combination of global and
local features of distortions. This approach achieves improved performance
in two databases as compared to the state-of-the-art techniques. The overall
performance of the proposed method is also better than the state-of-the-art
techniques.
• A methodology is proposed for blind evaluation of image sharpness using
sim-ple combination of features indicating high frequency content in images. The
proposed technique improves over the performance of the state-of-the-art
tech-niques in several databases.
• A general purpose technique for blind evaluation of image quality is proposed. The methodology is unique as it does not use training with any of the three
data, namely, pristine images, distorted images and subjective score of quality
and relies only on features. In spite of this, the approach achieves competitive
performance with the state-of-the-art techniques in several databases.
1.7
Organization
The work presented in the dissertation has been segmented into several chapters in
accordance with their main features to facilitate continuity and improve readability.
The dissertation is organized as follows:
• Chapter 2 presents the earlier works related to FR-IQA and NR-IQA.
• Chapter 3 presents the basic ideas for improvements in two existing techniques, and analyzes the results obtained by these improvements.
• Chapter 4 proposes a new FR-IQA technique based on the combination of local
• Chapter 5 proposes a specific purpose NR-IQA technique to evaluate perceptual sharpness using high frequency content based features in images.
• Chapter 6 proposes a general purpose NR-IQA technique using features from
different scales of the image to successfully evaluate the quality of a distorted
image without the need for any kind of training for its execution.
Chapter 2
Related Works
In this chapter, we discuss the existing works related to the research work presented
in this dissertation. The presentation of related works is in the same order as the
rest of the chapters are arranged. First, the literature related to the FR-IQA is
discussed. Next, the existing techniques corresponding to the special purpose
NR-IQA are discussed. Finally, the literature related to existing general purpose NR-NR-IQA
is discussed. This allows a modular representation of the related research work which
are connected with the common thread of IQA and yet, diverse enough in their
applicability and procedures.
2.1
FR-IQA Techniques
In the broad area of signal processing, Peak-Signal-to-Noise Ratio (PSNR) is
signifi-cantly used as an effective measure for comparison of signals and the measurement of
signal fidelity. However, in the role of a measure for perceptual image quality, PSNR
is not consistent enough [112]. As determined by experimental results presented in
the works [114, 129], PSNR is good enough for the perceptual quality evaluation of
noisy images, but it is not effective as an IQA method for other kinds of distortions.
Interestingly, calculation of PSNR does not involve the spatial relationships with the
neighboring pixels and it is one of the best perceptual evaluators for mainly
content-independent noise [114, 129]. Still, the general applicability of PSNR is very low
when considered with other types of distortions or across several types of distortions.
nec-Hypothesis based effective combination of features (one or more blocks from the above may be used) Test Image
Reference Image
Pre-processing Channel
Decomposition
Error
Normalization ErrorPooling
Test Image Reference Image
Quality/Distortion Score
Quality/Distortion Score
Bottom -Up Methods
Top -Down or Hybrid Methods
Figure 2.1: Comparison of FR-IQA techniques based on bottom-up, top-down and hybrid approaches.
essary [111]. Since, FR-IQA techniques already use full information of the reference
image, it is very important for them to have applicability across several distortions.
Therefore, from the last decade, different techniques have been developed for
FR-IQA to increase its general applicability. Discrete Cosine Transform (DCT) domain
based PSNR has been shown to have much better correlation with HVS in [80] and the
method is called PSNR-HVS-M. It is shown in [114] that under effective pooling
strat-egy, PSNR can act as a measure of perceptual IQA. There are FR-IQA techniques
that employ the properties of HVS directly and these methods are called bottom-up
methods for IQA. There are others, which have hypotheses supporting some
proper-ties of HVS or an assumption about the overall functionality of HVS. These methods
are called top-down techniques or methods relying on overarching principles. Some
existing methods of FR-IQA are combined approaches involving both of the aforesaid
techniques and hence may be termed as hybrid techniques [111]. A discussion on
sev-eral popular techniques of FR-IQA exhibiting their effective performance on different
kinds of distortions follows below.
The bottom-up methods in IQA relied on HVS based modeling in IQA. They
usually follow the four steps of pre-processing, channel decomposition, error
normal-ization and error pooling as shown in Fig. 2.1. We will describe each of these steps
and the research proposed in this dissertation. As we find, some of these blocks are
also used to extract information in many existing IQA techniques.
1. Pre-processing: Pre-processing in an IQA technique may be an operation or
a set of auxiliary operations that are required to be performed before the
ac-tual procedures related to IQA start. They may include image registration as
the reference and distorted images need proper alignment with respect to each
other. Most of the IQA techniques need perfect registration of the reference
and test images to perform well. The other operations that may be involved
in the phase of pre-processing include color space conversion, color to grayscale
conversion, image size adjustment, conversion of pixel values to luminance
val-ues, application of Point Spread Function (PSF) simulating the optics of eye
and Contrast Sensitivity Function (CSF) following the dependence of eye on
the frequency to perceive a change in contrast. Often, CSF is modeled at the
later stage of channel decomposition instead of the pre-processing stage so that
channels of different frequencies may be obtained by a particular decomposition.
2. Channel Decomposition: Channel decomposition is inspired by the fact that
a large number of neurons in the primary visual cortex of the human brain are
efficient in processing visual stimuli of specific frequency, orientation and
lo-cation. This inspired the use of Fourier decomposition, Gabor decomposition,
DCT transforms, steerable pyramids, cortical transforms and log-Gabor
trans-forms. Often these transforms are used decompose the signals into different
frequency and orientations for further processing.
3. Error Normalization: The reference and test images are subjected to the
channel decompositions and the difference of their coefficients is called error.
This error is often processed by CSF to make it perceptually reasonable.
Some-times, contrast masking is also applied for normalization in terms of the error in
in [111].
4. Error Pooling: After the normalization, the job that remains is to derive
a scalar score signifying the distortion or quality. This process of deriving a
scalar score from the set of all errors is called pooling. Often these pooling
procedures are derived from the properties of HVS. The mean of the error
of-ten serve as the score which is called mean pooling. Similarly, we have max
pooling, percentile pooling, Minkowski pooling, information-weighted pooling
and saliency-weighted pooling as popular pooling strategies in the existing
lit-erature.
Some of the models that follow these four steps are: Daly model [14], Safranek
Johnson model [103], Lubin model [59, 60], Teo-Heeger model [104] and Watson’s
models [117, 118]. However, these models significantly differ in their ways of
pro-cessing information in each stage. In spite of the success of these methods, limited
knowledge of HVS and the specific problems [111] with these approaches triggered
research in IQA in a different direction which assumes the HVS as a blackbox and
hypothesize about its functionality and hence are overarching or top-down in nature.
In this regard, the most popular method for FR-IQA is Structural Similarity
In-dex (SSIM) [113]. The hypothesis in this method is about the sensitivity of the HVS
in the loss of structural information in images. This approach involves computation
of perceptual image quality using the luminance, contrast and structure comparison
images obtained from the reference and test images to form a quality map. The final
score is derived from the quality map as its mean value. In the past few years, several
modifications of SSIM have been proposed. These include Gradient based Structural
Similarity (GSSIM) [9] which calculates SSIM on gradient images and Multiscale
Structural Similarity Index (MSSSIM) [116] which iteratively downsamples the
refer-ence and test images to embed multiscale information in the IQA method to arrive
the images into four regions depending on the smoothness and edge properties. The
work presented in [96], analyzes the most effective values for the parameters used in
SSIM. These methods are based on high level properties of vision. Recently, Gradient
Similarity [52] combines low level properties of vision like masking effect and visibility
threshold along with structure, luminance and contrast comparison to formulate the
quality measure. Other approaches that use low and mid-level properties of vision are
Visual-Signal-to-Noise Ratio (VSNR) [8] and Most Apparent Distortion (MAD) [43].
VSNR identifies visual distortions and finds perceived contrast and global precedence
properties of the image’s edges while calculating the perceptual quality score. On the
other hand, MAD evaluates, if the amount of distortion present is near-threshold or
supra-threshold and applies different strategies in either case to evaluate perceptual
quality.
Information theoretic approach towards FR-IQA has been followed to formulate
Information Fidelity Criterion (IFC) [92] and Visual Information Fidelity (VIF) [91].
Information-Content Weighted Structural Similarity Index (IWSSIM) [114] uses
lo-cal information weighted pooling with MSSSIM to improve the correlation between
subjective scores and objective values. Therefore, IWSSIM is a bridge between
in-formation theoretic approaches and structural similarity. These approaches rely on
the mutual information between two images and the formulation is based on
Gaus-sian Scale Mixture (GSM). Multiscale transforms for IQA have been explored in
the works [15, 41, 76]. Using the Haar Wavelet and its space-frequency localization
properties, local contrast at various resolutions is used to find image quality in [41].
In [15, 76], coefficients from Discrete Wavelet Transform (DWT) have been used to
analyze image quality. Image saliency based approach [62], blockwise Singular Value
Decomposition (SVD) of images [95] are also shown to correlate well with HVS. The
aforementioned FR-IQA methods differ in principles as well as their execution times
and in their correlation with the subjective assessment of quality.
Index for Color Images (FSIMc) [129] has been proposed. This technique relies on
calculating phase congruency and gradient information from the reference image and
the test images. The score is based on the similarity of the gradient information
and phase congruency values at the corresponding locations. In a similar framework
as FSIM, a faster technique called SR-SIM [128] has been developed and shown to
perform well in three databases. SR-SIM uses saliency maps derived from spectral
residual [32] technique to find perceptual similarity between pixels as well as to pool
the quality map obtained from the reference and distorted images. As already
dis-cussed, MAD [43] segregates the distortions present in an image as near threshold or
supra-threshold and uses dual strategies for evaluating those distortions. In the same
context, another approach is based on defining the distortions as additive or detail
loss based and combining their measurements. The method is called Additive and
Detailed Loss based Measure (ADM) [48]. A recent approach [121] uses the principal
of Internal Generative Mechanism (IGM) of human brain and dissolves the given
im-ages into predicted and disorderly parts. Then, the distortions on these two parts are
separately evaluated by different techniques and are combined to form the objective
score. MAD, ADM and VSNR employ the direct applications of the HVS
proper-ties like contrast sensitivity and visual masking. Most of the methods mentioned
in the previous discussions form the state-of-the-art techniques of FR-IQA as none
of the methods discussed can single-handedly outperform others across all databases
and distortions therein. Hence, our target in this domain has been to improve the
performance of the existing techniques and develop competitive techniques with the
2.2
NR-IQA Techniques for Perceived Sharpness
Evaluation
As we already discussed in the previous chapter, the existing works on NR-IQA
or BIQA can be broadly separated into two genres namely: specific purpose and
general purpose IQA. After working with FR-IQA, we selected the problem of
NR-IQA to work with. Since removal of reference image created problems for a smooth
transition from FR to NR-IQA, we choose to work in specific purpose IQA first.
We fixed the specific purpose as perceptual sharpness. The antonym of sharpness is
blur. The absence of sharpness does not necessarily mean the presence of blur [108].
However, increase of blurriness hints about loss of sharpness. Hence, several works in
existing literature are found to treat both of the problems simultaneously. Since, the
dissertation concentrates on investigation of potential features in IQA, our literature
review takes a look at the different types features that have been used in this regard.
The existing techniques in the literature involve several visual cues to evaluate
perceptual sharpness or blur without the aid of any reference image. The set of
vari-ety of visual cues used for blur or sharpness is quite large. Depending on the type of
features used to evaluate blur or sharpness, the techniques can be classified as
spa-tial domain, transform domain and hybrid techniques. Though all of the approaches
mentioned below do not fall exactly into the category of quantifying perceptual
dis-tortions formed due to loss of sharpness, they give information about different types
of visual cues that aided in detecting sharpness or blur and the variety of techniques
that are developed over several decades to evaluate sharpness or blur levels.
2.2.1
Spatial Domain based Techniques
Spatial domain blur detection methods are those which rely solely on features
from entire image is used as a measure in [16] as variance is likely to decrease in an
image with the presence of blur. A globally sharp image has lower correlation between
adjacent pixels. Thus, when the previous pixel is predicted from the current one, the
prediction error is likely to be higher. The variance of this error is used determine a
globally blurred or sharp image [106]. Since, neighboring pixels are more correlated in
the blurred image compared to its sharper version, an autocorrelation function based
method is proposed in [2]. Image intensity histograms [36, 40] based methods are also
used to determine blur in auto-focussing applications, though they are not likely to
evaluate the perceptual degradation caused by it. By discriminating between different
levels of perceptible blur on the same image, a no-reference blur method is proposed
by Crete [13]. On the other hand, the image edge or gradient based features happen to
be widely used for determination of perceptual blur. The edge feature based methods
only rely on the edge width or the spread of edges. The work leading to this approach
is [65]; the width of an edge (vertical or horizontal) determined by separation of the
extrema positions closest to any edge. This width is considered to be the local edge
value and the average of such values over an image served to be the measure of the
blurriness of the image. The width of edge using the local gradient direction is used
the to measure blurriness in [78]. Degradations caused by the blur uniformly over an
whole image are also evaluated using Renyi entropy based anisotropy method [22].
However, depending on the image content, the perceived blurriness of an image varies
and this is incorporated through the concept of Just Noticeable Blur (JNB) in the
edge width[18] to determine the probability of blur detection for each block region
in an image. Finally, a Minkowski metric based pooling is used to determine overall
perceived blur. A modification to the same approach using cumulative probability of
blur detection is proposed in [75]. Combination of edge based features and variance
are used to obtain a sharpness method in [11]. Based on the argument that
singu-lar value decomposition of local gradient values represent the components along the
in [132].
2.2.2
Transform Domain based Techniques
Transform domain approaches began with failure of blurred image spectra to follow
the power law as done by natural images [19]. The kurtosis obtained from the Fourier
spectra is used to measure the image sharpness in [130]. Some blurriness evaluation
methods using high and low frequency power measures are presented in [21]. A
DCT based approach is proposed in [64]. 2D DCT coefficient based kurtosis is used
to calculate the image sharpness in [6]. Wavelet transform based blur detection
approaches are presented in [105, 109]. The techniques discussed so far did not involve
any kind of prior training. A Wavelet feature based on Support Vector Machine
(SVM) classification and confidence is used to design the quality score of degraded
images in [10]. A complex Wavelet based computation of local phase coherence [28],
called Local Phase Coherence Sharpness Index (LPC-SI), is shown to perform well
in four blur databases among the recent approaches developed for perceptual blur
detection.
2.2.3
Hybrid Techniques
Hybrid techniques are those which rely on both spatial domain and transform domain
methods to evaluate blur. The work proposed by Sadaka et.al [85] uses JNB and
incorporates foveal pooling into it using by Gabor filtering based visual attention map.
A combination of features obtained from local power spectrum, gradient histogram
span and color based maximum saturation is used to detect blur regions in a partially
blurred image and then used to classify these blur regions into motion and
out-of-focus blurred regions [54]. A recent approach S3 [108], uses both spatial and spectral
information to perceptually evaluate blur. In addition, they also come up with a
Blind Image Quality Assessment
General - Purpose Specific - Purpose
NSS based features +
Learning with subjective scores
Other Image Features +
Learning with subjective scores
Hybrid ( NSS + other) features +
Learning with subjective scores
NSS based Features or Other Image features
+
Learning without subjective scores Transform
Domain NSS
Spatial Domain NSS
Gabor Features Sparse
Representation
Raw Image Patch Phase Congruency
and Gradients
Figure 2.2: Different types of BIQA methods.
techniques, the general purpose image quality assessment techniques also evaluate
distortions caused by blur. However, recent perceptual blur or sharpness evaluators
are shown to perform better than the general purpose techniques [28]. Our approach
in this area has been to combine the high frequency content and contrast based
features from natural images to compute the perceived sharpness in a natural image.
2.3
General Purpose NR-IQA Techniques
Recent years have witnessed a substantial proliferation of the general purpose BIQA
methods. In this section, our discussion focusses on general purpose BIQA as it is
related more to the proposed work. A summary of different types of existing methods
is shown in Fig. 2.2.
Most of the general purpose approaches are based on feature extraction and
training based on the given human scores in the databases. Since different kinds
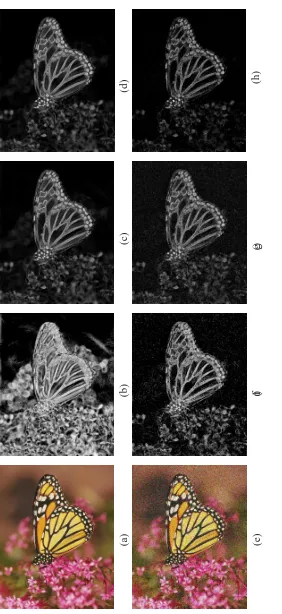
![Figure 4.5: The objective values obtained by the proposed method GLD-SR on siximages of CSIQ database [42]](https://thumb-us.123doks.com/thumbv2/123dok_us/1400705.1172742/102.612.109.540.149.419/figure-objective-values-obtained-proposed-method-siximages-database.webp)