International Journal in IT and Engineering
http://www.ijmr.net email id- [email protected] Page 38 IDENTIFYING THE READING SPEED OF LOW VISION STUDENT’S
AT ELEMENTARY LEVEL
Assistant Prof. Dr. Salih CAKMAK Academic Tamer KARAKOC Assistant Prof. Dr. Pinar SAFAK Prof. Dr. Adnan KAN
This article is supported by TÜBİTAK.
ABSTRACT
This study was carried out to identify the relationship between features of the reading
material and reading speed of low vision students. Study participants were comprised of 30
low vision students, 18 boys and 14 girls, attending Mitat Enç and Aydınlıkevler Göreneller
Elementary School for Visually Impaired in Ankara during the 2011-2012 education years on
a voluntary basis. All of the participants were to be between 2nd and 7th grade and able to read
the print as a prerequisite. 81 different reading cards (texts) were drawn up considering
variables such as type font, font size, line spacing and character spacing. Each reading card
comprised of 35 word texts with 5 or 6 lines. Reading performances of the participant low
vision students were video recorded. Then, the data were marked on the “Reading Time Record Form” developed by the researchers. The video records were watched by the
researchers, and reading speeds were calculated by taking the average of the reading times
identified by the three researchers according to the number of words read correctly in 1
minute.
Keywords: Low vision, reading speed, functional vision
1. INTRODUCTION
As one of the most effective ways of acquiring knowledge through their lives,
reading is among basic skills acquired in elementary school. After learning how to read in
elementary school, majority of the children acquire most of the learning experience from
books. Therefore, reading is influential on children’s acquiring knowledge and thus gaining
life experience (Özmen Güzel, 1999). Reading skill is important not only for children without
disability but also disabled ones because it is crucial for children to get ready for social life
and to sustain their life at high quality no matter they are disabled or not.
It can be thought that the visually impaired can face the biggest difficulty in the
process of acquiring reading skill, which is based on visual perception. The visually impaired
International Journal in IT and Engineering
http://www.ijmr.net email id- [email protected] Page 39 learn the Braille by touching, most of the low vision children use the print. The low vision
can be defined in legal and educational terms. In legal definition, low vision covers
individuals whose eye sight is between 20/70 and 20/200 after all corrections. This means
that they can see an object from 2 meters or shorter destination while a normal sighted person
can see the same from 100 meters. In educational terms, low vision includes visually
impaired persons who can read written materials in normal and large font size with the help
of glasses (Huebner, 2000; Şafak, 2005).
There are many factors which effect the reading speed of low vision people. These
factors could be categorized into two. First one contains factors related with the individual’s
visual disability, while the other is related with features of the reading material. Visual
disabilities affecting reading speed include eye diseases such as retinopaty of prematurity,
cortical visual disorder, retinitis pigmentosa, microphthalmos, coloboma, microcornea,
rod/cone dystrophia, congenital cataract, congenital glaucoma, opaque cornea, optic atrophy,
albinism etc and accidents (Negrel, Minassian & Sayek (1996). On the other hand, the
factors affecting reading speed due to the reading material are type font, font size, line
spacing, character spacing, contrast between text color and ground color, and the light
amount in the environment, etc (Bailey, Lueck, , Greer, Tuan, Biley, & Dornbush 2003,
Brown, 1981; Lovie-Kitchin, Bevan & Hein 2001; Whittaker, Lovie-Kitchin, 1994; Legge,
Rubin, Pelli & Schleske 1985; Legge, Rubin;1986; Rubin & Legge 1989).
The studies on the relationship between reading speed of low vision students and
features of the reading material are mainly about reading speed and font size. There are some
studies showing that reading speed increases as font size increases (Legge et al, 1985a;
Chung, 1991; Johnston and Chung, 1991; Mansfield et al, 1994; Mansfield, Legge, and
Banet, 1996). Also other studies carried out by Lovie-Kitchin and Woo, 1987; Rubin and
Turano, 1992; Chung, 1991 show that reading speed decreases due to the narrow visual space
as font size increases. Contrast ratio is another factor affecting reading speed of low vision
individuals. Some studies show that reading speed increases as contrast ratio between text
color and background increases, and thus the speed decreases as the ratio decreases (Rubin,
Legge, 1989; Whittaker, Lovie-Kitchin, 1994). Other factors increasing reading speed of the
low vision are marked line spaces and increased character spaces (Bailey, Lueck, , Greer,
International Journal in IT and Engineering
http://www.ijmr.net email id- [email protected] Page 40 In this study; the relationship between features of the reading material and reading
speed of the low vision children is studied.
2. METHOD
2.1 Participants and Selection
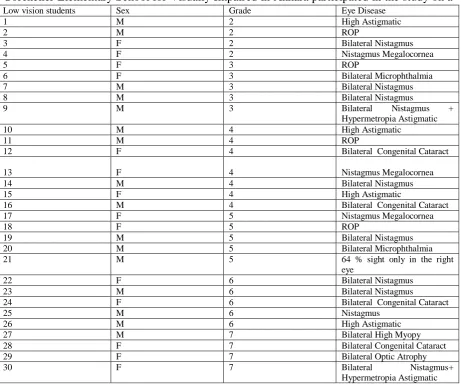
30 low vision students, 18 boys and 14 girls, attending Mitat Enç and Aydınlıkevler Göreneller Elementary School for Visually Impaired in Ankara participated in the study on a
voluntary basis during the 2011-2012 education years. All of the participants were to be between 2nd and 7th grade and able to read the print as a prerequisite.
TABLE 1
Details of the participant low vision students in the Study
Low vision students Sex Grade Eye Disease
1 M 2 High Astigmatic
2 M 2 ROP
3 F 2 Bilateral Nistagmus
4 F 2 Nistagmus Megalocornea
5 F 3 ROP
6 F 3 Bilateral Microphthalmia
7 M 3 Bilateral Nistagmus
8 M 3 Bilateral Nistagmus
9 M 3 Bilateral Nistagmus +
Hypermetropia Astigmatic
10 M 4 High Astigmatic
11 M 4 ROP
12 F 4 Bilateral Congenital Cataract
13 F 4 Nistagmus Megalocornea
14 M 4 Bilateral Nistagmus
15 F 4 High Astigmatic
16 M 4 Bilateral Congenital Cataract
17 F 5 Nistagmus Megalocornea
18 F 5 ROP
19 M 5 Bilateral Nistagmus
20 M 5 Bilateral Microphthalmia
21 M 5 64 % sight only in the right
eye
22 F 6 Bilateral Nistagmus
23 M 6 Bilateral Nistagmus
24 F 6 Bilateral Congenital Cataract
25 M 6 Nistagmus
26 M 6 High Astigmatic
27 M 7 Bilateral High Myopy
28 F 7 Bilateral Congenital Cataract
29 F 7 Bilateral Optic Atrophy
30 F 7 Bilateral Nistagmus+
International Journal in IT and Engineering
http://www.ijmr.net email id- [email protected] Page 41
2.2 Setting and materials
Low vision students from both two schools joined activities in classrooms
determined by the school administration. The setting was illuminated with natural light
sources and desks were selected suitable for the students’ height. Similarly, the desk to be
used by the low vision student was relocated to prevent glowing on the reading material when
daylight was shining. The participants could not use any instruments such as lenses during
reading activities because they cause differentiation in other variables (type font, font size,
line spacing and character spacing).
In this study; 81 distinct reading cards (texts) were prepared by taking into
consideration variables such as type font, font size, line spacing and character spacing. The
texts were selected from story books appointed for elementary schools under Ministry of
National Education. Each reading card contains 35-word texts in 5 or 6 lines. Type fonts were
selected as Times New Roman, Century Gothic and Comic Sans MS on the 81 cards. These
fonts were preferred on this study because they are obviously distinct. Font size is another
variable taken into consideration while preparing the reading cards. 18, 24 and 28 font sizes
were used on the cards, respectively. Font sizes above 28 were not preferred because they
could cause impaired visual perception difficulty as students had limited visual space and
visual acuity. Also line spacing was considered while preparing the cards. One, one and half
and double line spaces were used, respectively. Lastly, character spacing was also selected as
narrow, normal and wide. Reading cards and respective variables are listed as a table in 2.
2.3 Method – Using of Reading Cards
Because participant students have limited reading spaces, a certain limit was not
identified for reading distance so that the low vision students can adjust the distance ideally
for themselves. Each participant took 15 reading cards in every 40 minutes everyday, but 21
reading cards were given on the last day. Every student participated for 5 days.
Misarticulating, reading the word after a waiting period of more than 3 seconds and skipping
a word are identified as reading mistakes. Reading performances of the participant low vision
students were video recorded and then marked on the “Reading Time Record Form”
developed by the researchers. The records were watched by the researchers, and reading
speeds were calculated by taking the average of the reading times identified by the three
International Journal in IT and Engineering
http://www.ijmr.net email id- [email protected] Page 42 2.4. Data Analysis
In order to find out reading speed of low vision students, each participant’s read time
for each of the 81 cards was identified and descriptive statistics were calculated from
measurement results obtained in this way. In order to discover the typical reading time of
students for each text, measures of central tendency (arithmetic average and median) were
calculated. To identify distribution of the other data around such a typical value, measures of
distribution (standard deviation and quartile deviation) were calculated. Besides, coefficient
of skewness and kurtosis (normal, right sight skewed, left side skewed, etc) were calculated
to find out the shape of the distribution.
3. FINDINGS and COMMENTS
Descriptive statistics were calculated to identify reading speed of low vision
children. Initially, the distribution of the measuring results was examined, deviating values
(in extreme ends) were analyzed and extreme values in the distribution were determined. As a
result of the analysis, measuring results of participant 23 were found significantly deviant
from the other measuring results. Considering that arithmetic average is affected by marginal
values, median and quartile deviations were calculated first. Then, arithmetic averages were
found by subtracting the deviating values as the number of deviating values was small. After
subtracting the deviating values, resulting averages were found quite close to the median
values. Descriptive statistics obtained from the participants’ reading time of the 81 texts in
the study are given in Table 2.
International Journal in IT and Engineering
http://www.ijmr.net email id- [email protected] Page 43 Student
No
Min. Max. 𝒙 SS Ave. Ç.S
25 75
SH𝒙 Confidence
Interval
Çarp Bas.
1 12,90 45,30 24,58 8,86 22,32 18,40 33,04 1,67 21,14 28,01 ,84 -,10
2 17,30 48,00 27,41 7,84 25,74 22,41 36,73 1,53 24,25 30,58 ,93 ,22
3 10,65 34,70 20,70 7,00 19,32 14,83 27,77 1,30 18,04 23,37 ,56 -,86
4 12,32 39,64 22,06 6,59 20,05 16,88 29,67 1,29 19,41 24,71 ,83 -,04
5 15,13 49,30 26,49 8,61 24,84 20,84 33,84 1,60 23,21 29,76 ,91 ,55
6 12,30 38,60 21,72 6,48 20,70 15,93 27,18 1,20 19,26 24,18 ,73 ,10
7 12,57 34,56 21,36 6,16 20,20 16,47 27,50 1,18 18,92 23,80 ,55 -,63
8 15,70 42,79 27,28 7,36 26,45 23,65 34,45 1,41 24,38 30,19 ,39 -,55
9 10,54 42,80 20,96 8,24 19,40 13,96 26,77 1,53 17,83 24,10 ,88 ,39
10 9,00 27,43 14,83 5,18 13,20 10,49 13,20 1,01 12,74 16,92 ,93 -,19
11 11,00 38,70 22,01 6,73 23,28 16,53 27,03 1,25 19,45 24,57 ,53 ,12
12 7,94 32,40 16,12 6,48 15,23 10,92 19,69 1,20 13,66 18,59 ,99 ,51
13 9,48 34,00 17,00 6,25 15,53 12,18 21,35 1,16 14,62 19,38 1,03 ,60
14 10,01 35,00 17,86 6,24 17,19 12,52 22,43 1,16 15,48 20,23 ,83 ,37
15 9,70 21,70 14,05 3,47 14,64 10,87 17,34 0,67 12,67 15,42 ,53 -,39
16 9,88 23,80 15,39 4,48 14,89 11,25 20,50 0,86 13,62 17,16 ,51 -,97
17 10,60 37,70 19,59 6,58 18,99 14,93 25,26 1,24 17,04 22,14 ,96 ,61
18 8,36 30,40 16,97 6,22 16,92 12,32 21,39 1,16 14,60 19,33 ,62 -,52
19 7,12 26,80 13,77 4,92 15,35 10,15 16,69 0,93 11,86 15,67 ,78 ,47
20 9,40 28,26 14,66 4,84 13,90 10,98 19,78 0,93 12,75 16,57 1,10 ,72
21 7,64 26,40 14,58 4,73 13,76 11,01 17,50 0,88 12,78 16,38 ,97 ,72
22 8,14 28,20 14,98 5,25 14,22 10,01 17,85 0,97 12,98 16,97 ,89 ,53
23 8,82 23,70 15,14 4,08 16,40 12,10 19,87 0,80 13,49 16,79 ,42 -,44
24 6,77 18,40 11,56 3,34 10,99 9,63 17,64 0,67 10,18 12,94 ,84 -,04
25 7,67 23,99 15,00 4,10 15,46 13,22 18,62 0,79 13,37 16,67 ,27 -,15
26 6,10 30,05 17,05 5,31 17,77 13,51 21,47 1,02 14,95 19,15 ,63 1,02
27 7,90 27,53 14,48 5,52 13,83 10,28 19,55 1,06 12,30 16,66 1,06 ,39
28 10,78 35,80 18,37 6,64 16,34 14,34 25,02 1,27 15,74 20,99 1,26 ,89
29 9,92 31,70 19,58 6,35 19,48 13,53 25,84 1,20 17,12 22,04 ,44 -,86
30 9,46 34,90 19,46 7,44 17,03 13,85 27,10 1,38 16,63 22,29 ,74 -,80
31 10,56 40,21 20,75 8,42 18,51 13,29 27,37 1,56 17,55 23,96 ,87 -,26
32 10,46 36,72 20,04 5,80 21,97 15,99 26,73 1,16 17,65 22,43 ,84 1,22
33 9,30 31,80 17,50 6,61 16,34 11,66 24,60 1,23 14,98 20,01 ,55 -,82
34 12,39 40,62 22,68 8,54 21,45 16,17 28,28 1,59 19,43 25,93 ,92 -,19
35 11,06 42,30 23,70 8,68 21,63 17,98 31,58 1,61 20,40 27,00 ,86 -,21
36 10,81 32,23 17,72 5,99 17,23 12,08 21,21 1,11 15,44 19,99 ,76 -,19
37 9,27 20,90 14,20 3,28 14,41 11,90 17,06 0,62 12,83 15,37 ,33 -,77
38 6,80 30,25 15,44 5,90 14,39 10,68 20,83 1,09 13,20 17,69 ,99 ,39
International Journal in IT and Engineering
http://www.ijmr.net email id- [email protected] Page 44
40 7,74 22,50 14,80 3,90 15,05 12,61 19,53 0,75 13,26 16,34 ,31 -,65
41 8,26 27,60 16,21 5,13 15,72 12,57 21,20 0,99 14,19 18,24 ,48 -,22
42 8,21 23,10 13,78 4,43 12,83 10,16 19,31 0,84 12,06 15,49 ,57 -,76
43 8,71 24,80 14,81 4,19 15,04 11,34 18,94 0,81 13,15 16,47 ,63 -,23
44 8,74 27,80 15,35 5,56 13,50 10,86 20,09 1,03 13,24 17,47 ,84 -,34
45 6,35 21,00 12,57 3,92 13,53 9,45 16,55 0,74 11,05 14,08 ,26 -,83
46 7,04 21,70 12,92 4,31 12,80 9,64 17,50 0,81 11,24 14,58 ,59 -,78
47 7,44 25,10 12,88 5,05 11,21 8,69 16,89 0,94 10,96 14,79 ,97 -,17
48 6,56 21,50 12,25 4,13 12,59 8,73 15,28 0,78 10,65 13,85 ,40 -,49
49 5,81 24,00 14,10 4,84 14,18 10,06 19,08 0,91 12,23 15,98 ,21 -,91
50 6,90 26,20 14,49 5,02 14,04 10,21 18,96 0,95 12,54 16,43 ,68 -,27
51 6,50 15,69 10,85 2,58 11,66 9,15 14,40 0,51 9,78 11,91 -,04 -,95
52 5,80 16,91 10,11 2,51 10,43 9,47 12,36 0,50 9,08 11,14 ,28 1,10
53 6,13 21,20 11,80 3,77 11,60 9,34 15,79 0,71 10,34 13,27 ,81 ,23
54 5,70 25,30 12,30 5,53 11,49 7,10 18,54 1,04 10,15 14,43 ,88 -,11
56 5,21 35,67 22,56 7,42 23,70 17,51 29,72 1,40 19,68 25,43 ,01 -,22
57 9,32 34,68 19,99 6,98 19,23 14,10 25,96 1,30 17,33 22,64 ,67 -,23
58 10,16 25,97 18,53 4,00 19,90 15,90 24,69 0,80 16,88 20,18 -,17 -,32
59 13,39 34,96 20,74 6,28 20,32 14,74 24,50 1,18 18,30 23,17 ,85 ,08
60 10,30 33,50 19,11 5,36 19,10 15,81 25,51 1,03 16,99 21,22 ,98 ,79
61 12,07 37,70 21,43 7,31 20,51 14,78 25,98 1,36 18,64 24,20 ,68 -,53
62 10,14 40,50 21,78 6,96 20,19 16,82 26,83 1,21 19,13 24,42 ,79 ,51
63 10,44 30,60 17,56 5,34 17,72 13,68 23,64 1,05 15,40 19,71 1,06 ,82
Min. Max. 𝒙 SS Ave. Ç.S
25 75
SH𝒙 Confidence
Interval
Çarp Bas.
64 8,95 30,25 16,05 5,68 15,57 11,08 19,02 1,05 13,89 18,14 ,83 ,18
65 10,16 32,80 17,36 6,26 15,65 12,58 23,72 1,16 14,98 19,74 ,72 -,43
66 7,30 23,49 14,54 4,05 15,62 12,15 17,89 0,78 12,94 16,14 ,026 -,26
67 9,23 19,10 13,03 2,54 13,38 11,59 16,82 0,51 11,99 14,08 ,60 ,24
68 7,39 30,50 15,13 5,66 15,01 10,71 19,00 1,07 12,93 17,32 ,86 ,68
69 6,74 23,20 12,12 3,85 11,97 8,85 15,19 0,73 10,63 13,61 ,95 ,90
70 7,39 19,72 12,22 3,23 12,43 10,38 17,55 0,65 10,88 13,54 ,60 -,04
71 7,34 25,20 14,03 4,73 13,36 10,61 17,76 0,89 12,20 15,87 ,92 ,56
72 9,00 27,09 15,41 5,54 14,48 10,79 21,03 1,04 13,27 17,57 ,88 -,23
73 7,94 17,50 11,73 3,03 10,96 9,90 16,90 0,61 10,49 12,98 ,55 -,87
74 6,60 16,20 10,57 2,97 10,23 8,40 14,75 0,57 9,40 11,75 ,41 -1,05
75 6,70 16,20 10,64 2,51 11,12 8,61 15,08 0,51 9,58 11,69 ,53 -,02
76 6,86 23,60 12,05 4,30 12,43 8,15 14,81 0,81 10,39 13,72 ,95 ,56
77 5,70 20,00 12,28 4,09 12,70 8,28 17,09 0,79 10,67 13,90 ,27 -,77
78 6,78 20,86 12,87 3,84 13,77 10,47 16,12 0,74 11,35 14,39 ,49 -,33
International Journal in IT and Engineering
http://www.ijmr.net email id- [email protected] Page 45 Table 2 shows that 30 low vision participants could read text numbers 52, 74, 75, 51
and 81 among the 81 different reading cards at highest speed, respectively. Text 52 is typed
as Century Gothic with font size of 28, double line space and normal character space. Text 74
is typed as Coming Sans MS with font size of 28, single line space and narrow character
space. Text 75 is typed as Coming Sans MS with font size of 28, single line space and wide
character space. Text 51 is typed as Century Gothic with font size of 28; 1,5 line space and
wide character space. Lastly, Text 81 is typed as Coming Sans MS with font size of 28,
double line space and wide character space. Of the 81 text types based on different variables,
low vision participants could read text 52 in 10.11 seconds on average. It reveals that text 52
was read at highest speed among all.
According to Table 2, low vision students could read text 2, 8 and 5 with the
smallest number of correctly spelled words in 1 minute. Text 2 is created in Times New
Roman with font size of 18, single line space and narrow character space. Text 8 is in Times
New Roman with font size of 18, double line space and narrow character space. Text 5 is
written in Times New Roman with font size of 18; 1,5 line space and narrow character space.
Of the 81 text with different variables, text 2 could be read by participants in 27.41 seconds
on average. This shows that text 2 took the longest time to read among all.
It is seen in Table 2 that low vision study participants could read at higher speed
written texts in Coming Sans MS and Century Gothic with font size of 28 and wide character
space. It is also seen that the participants could read texts written in Times New Roman with
font size of 18 and narrow character space in longer duration.
4. DISCUSSION
Study participants, who are low vision student’s, read texts typed in Century Gothic
with font size of 28, double line space and normal character space in 10.11 seconds on
average, while they could read those typed in Times New Roman with font size of 18, single
line space and narrow character space in 27.41 seconds.
Our study suggests that low vision children read Comic Sans MS and Century
Gothic in a shorter time than Times New Roman. In addition, they read texts in font size of
28 at a higher speed than 18 and 24, but they read the texts with font size of 24 at a higher
80 7,78 20,28 12,60 3,50 12,82 10,33 15,98 0,66 11,25 13,96 ,48 -,35
International Journal in IT and Engineering
http://www.ijmr.net email id- [email protected] Page 46 speed than 18. Though present findings support other studies showing that reading speed
increases in parallel with font size of texts for low vision students (Legge et al, 1985a;
Chung, 1991; Johnston and Chung, 1991; Mansfield et al, 1994; Mansfield, Legge, and
Banet, 1996) the researchers set the biggest font size as 28. Since low vision children have a
limited visual space, they might face difficulty in perceiving and vocalizing the big size
characters as a whole due to the weakness of their visual space as a consequence of too large
font size. Study data show that “line space (single,1,5 and double)” variable has a slighter
influence on reading speed of low vision children than the other variables (font type, font size
and character space).
In literature, factors affecting reading speed of low vision children are divided into
two; incompetence and reading material related factors. Findings of present study support the
studies proving that features of the reading material affects reading speed (Bailey, Lueck, ,
Greer, Tuan, Biley, & Dornbush 2003, Brown, 1981; Lovie-Kitchin, Bevan & Hein 2001;
Whittaker, Lovie-Kitchin, 1994; Legge, Rubin, Pelli & Schleske 1985; Legge, Rubin;1986;
Rubin & Legge 1989)
In the light of this study, teachers and parents of low vision children and others
around them, if any, should prepare texts with font size of 28 in Comic Sans MS and Century
Gothic with wide character space when they do reading exercises and other activities so that
the children can better perceive the reading material visually and thus read more speedily.
Adjustments to be made on the reading material for low vision children are expected to affect
their academic achievement positively as well. Also it can be said that increased reading
speed of low vision children will improve their reading comprehension performance.
5. CONCLUSION
It is suggested that amendments on the reading material to be provided for low
vision children can be influential on increasing their reading speed. Likewise, it takes shorter
time for low vision children to read texts written with wide character space and font size of
28 in Comic Sans MS and Century Gothic than those typed with narrow or normal character
International Journal in IT and Engineering
http://www.ijmr.net email id- [email protected] Page 47 References
Bailey, I.L, Lueck, A.H., Greer, R.B., Tuan, K.M., Biley, V.M. & Dornbush (2003).
Understanding the Relationships Between Print Size and Reading in Low Vision.
Journal of Visual Impairment & Blindness, June 2003.
Brown B. Reading performance in low vision patients: Relation to contrast and
contrast sensitivity. Am J Optom Physiol Opt 1981; 58: 218-226.
Chung, S. T. L. (1991). Effects of optical restraints on reading performance.
Unpublished MS Thesis, University of Melbourne. (1991).
Chung STL, Mansfield JS, Legge GE. 1998. Psychophysics of reading. XVIII: the
effect of print size on reading speed in normal peripheral vision. Vision Res.
1998;38:2949–2962.
Huebner, Visual İmpairment. Koening, A. J. & Holbrook, M., C., Foundation of
Education Second Edition Volume I History of Theory for Teaching Children and
Youths Visual İmpairments. New York: AFB Press. 2000.
Güzel- Özmen, Rüya. (1999). Öykü Yapısı Ve Öykü Yapısının Okuduğunu Anlama Öğretiminde Kullanılması. Türk Dünyası Sosyal Bilimler Dergisi. 11,105-117.
Legge, G. E., Pelli, D. G., Rubin, G. S., & Schleske, M. M. (1985a). Psychophysics of
reading-I. Normal vision. Vision Research, 25, 239-252.
Legge, G. E., Rubin, G. S., Pelli, D. G. & Schleske, M. M. (1985b). Psychophysics of
reading-II. Low vision. Vision Research, 25, 253-266.
Legge GE, Rubin GS. Psychophysics of reading: IV: Wavelength effects in normal
and low vision. J Opt Soc Am A. 1986;3:40-51.
Lovie-Kitchin, J. E., & Woo, G. C. (1987). Effect of magnification and field of
view on reading speed using a CCTV. In G. C. Woo (Ed.) Low vision: Principles
and applications (pp. 308-322). New York: Springer-Verlag.
Lovie-Kitchin J.E., Bevan, J.D,. & Hein, B. (2001). Reading in children with low
vision. Clinical and Experimental Optometry 84.3 May 2001.
Mansfield, J. S., Legge, G. E., Cunningham, K. E., & Luebker, A. (1994). The effect
of font on reading speed and reading acuity in normal and low vision. ARVO
International Journal in IT and Engineering
http://www.ijmr.net email id- [email protected] Page 48 Mansfield, J. S., Legge, G. E., & Banet, M. C. (1996). Psychophysics of reading-XV.
Font effects in normal and low vision. Investigative Ophthalmology and Visual
Science, 37, 1492-1501.
Negrel AD, Minassian DC, Sayek F. Blindness and low vision in southeast
Turkey. Ophthalmic Epidemiol. 1996;3:127-134.
Rubin GS, Legge GE. Psychophysics of reading: VI: The role of contrast in low
vision. Vision Res. 1989;29:79-91
Rubin, G. S., & Turano, K. (1994). Low vision reading with sequential word
presentation. Vision Research, 34, 1723-1733.
Şafak, P., Birlikte Eğitim OrtamIndaki Görme Yetersizliğinden Etkilenmiş
Öğrencilere Gezici Öğretmenlik Düzenlemesine Göre Verilen Destek Hizmetin Etkililiği., (Doktora Tezi), Gazi Üniversitesi Eğitim Bilimleri Enstitüsü, 2005.
Whittaker SG, Lovie-Kitchin JE. (1994). The assessment of contrast sensitivity
and contrast reserve for reading rehabilitation. In: Kooijman AC, Looijestijn
PL, Welling JA et al, eds. Low Vision-Research and New Developments in