Article
Mycobacterium bovis population structure in cattle
and local badgers: co-localisation and variation by
farm type
Georgina Milne 1*, Adrian Allen 1, Jordon Graham 1, Raymond Kirke 2,Carl McCormick 3, Eleanor Presho 1, Robin Skuce 1,4† and Andrew Byrne 4,5†
1 Veterinary Sciences Division, Agri-food and Biosciences Institute (AFBI), 12 Stoney Road, Stormont, Belfast BT4 3SD, UK; [email protected] (GM); [email protected] (AA);
[email protected] (JG); [email protected] (EP); [email protected] (RS) 2 Department of Agriculture, Environment and Rural Affairs, Veterinary Epidemiology Unit, Dundonald
House, Belfast, BT4 3SB, UK; [email protected] (RK)
3 Department of Agriculture, Environment and Rural Affairs, Veterinary Service Animal Health, Crown Buildings, Artillery Road , Coleraine BT52 2AJ, UK; [email protected] (CMcC); 4 School of Biological Sciences, Queen’s University Belfast, 19 Chlorine Gardens, Belfast, BT9 5DL, UK 5 One-Health Unit, Department of Agriculture, Food and the Marine, Agriculture House, Dublin, Ireland;
[email protected] (AB) * Correspondence: [email protected] † Joint senior authorship
Abstract: Bovine tuberculosis surveillance in Northern Ireland includes Multiple-Locus Variable number tandem repeat Analysis (MLVA) to determine the Mycobacterium bovis genetic type present in both cattle, and the predominant wildlife host, the European badger (Meles meles). These data are informative for investigating clusters of infection and understanding the scale at which interspecific transmission may occur. We utilised a comprehensive dataset of routinely sampled isolates from infected cattle and from badgers killed in road-traffic accidents to investigate the spatial co-location of MLVA types in, and between, the badger and cattle populations. Furthermore, we investigate the hypothesis that the farming enterprise type might explain some variation in this relationship. MLVA types were spatially co-localised in cattle and RTA badger hosts, indicative of a shared epidemic. Dairy herds were more likely to have at least one MLVA type in common with nearby RTA badgers, compared to non-dairy herd types. Marginally more MLVA spatial clustering was observed in non-dairy herds, which may be a consequence relatively more between-herd movements. For the cattle population, local transmission mechanisms such as infection from contiguous herds, infectious wildlife and short-range between-herd cattle movements appear primarily to drive the epidemic: there appears to be a more limited role for long-range movements. Animal management practices are likely the driving force behind this observation, as beef rearing is associated with elevated numbers of animal movements compared to dairy herds.
Keywords: Bovine tuberculosis; molecular epidemiology; spatial; badgers; MLVA; Northern Ireland
1. Introduction
The wildlife-livestock interface presents a conduit through which pathogens can be exchanged [1]. In the UK and Ireland, the presence of wildlife reservoirs is implicated in the persistence of Mycobacterium bovis, the principal causative agent of bovine tuberculosis (bTB) in cattle [2, 3]. M. bovis can infect a wide range of hosts, both wild and domesticated [4]. In the United Kingdom (UK) and the Republic of Ireland (ROI), the most important wildlife maintenance host is the European badger, Meles meles [5-8]. Infection transmission may be as a result of direct contact between species [9], or potentially through contaminated shared environments and fomites [10, 11].
In Northern Ireland (NI), the costs of bTB control in cattle have exceeded £365 million over a recent twelve year period [12], and despite an intensive and costly state-led programme focusing on the cattle population, eradication has not yet been achieved [13]. NI is a relatively small area (approx. 13,500km2), yet sustains a badger population of approximately 33,500 individuals (95%CI 26,000-41,200); [14]. A passive road-traffic accident (RTA) surveillance programme for M. bovis in badgers has been ongoing since 1998. This survey estimated M. bovis prevalence in sampled badgers to be 15.3% (95%CI 13.10%-17.5%) [15, 16], and revealed elevated bTB risk in cattle herds in close proximity to infected RTA badgers, compared to herds proximal to uninfected badgers [15]. Routine surveillance efforts for M. bovis in cattle and badger hosts also include spoligotyping and Multiple-Locus Variable number tandem repeat Analysis (MLVA) typing [17, 18]. These data revealed clear spatial structuring (i.e. clustering) of M. bovis genetic types in cattle herds [18, 19], and have shown that both cattle and badger hosts with the same MLVA type tend to be closer together than hosts with a different MLVA type [20, 21]. This observed structure in the M. bovis population in NI indicates that the bTB epidemic is co-localised between both wild and domestic hosts, consistent with some degree of transmission between wild and domestic species [7]. However, cattle sources alone also contribute to maintenance of infection at both the local and national scales; e.g. via within-herd amplification, (regardless of source), contact with nearby infected herds, or between-herd cattle purchases involving infected animals [7, 22-24].
However, the influence of cattle management and trade, as a risk factor, on the M. bovis population structure in both cattle and badgers has been given little attention to date. Beef and dairy production systems differ across a number of factors which may influence transmission. For example, we showed recently that beef herds in NI were generally associated with more between-herd cattle movements than dairy between-herds, and also experience elevated MLVA richness at the between- herd-level [25]. Different herd types have specific between-herd contact patterns potentially linked to different infection pathways [22], with beef fattening herds appearing more susceptible to infection introduced by bought- in cattle than dairy herds, and indeed, in NI, there is elevated risk of bTB infection associated with the purchase of beef animals [26]. These differences in herd management may subsequently manifest in different spatial relationships in the clustering of M. bovis in, and between, infected cattle and badger populations. We therefore aimed to analyse patterns in the spatial relationships in the M. bovis MLVA types found both in RTA badgers and cattle herds in NI to ultimately gain insight into the spread of the epidemic, both within and between hosts.
2. Results
2.1. Summary Statiastics
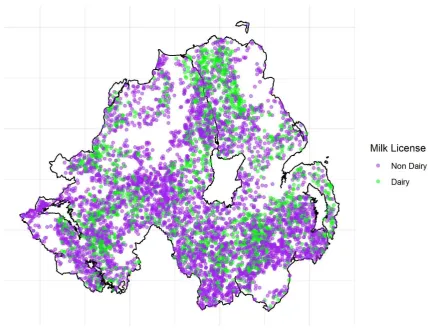
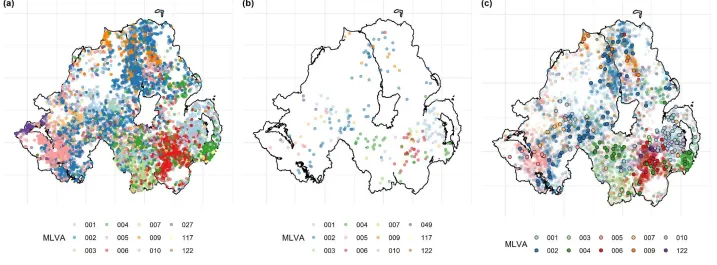
RTA badger dataset contained data on 271 RTA badgers collected between 2008 and 2016, inclusive. 30 different MLVA types were identified in this population, with the 12 most common MLVA types representing 90% of the total (Figure 2B). Visual inspection of the distribution of the most common herd-level M. bovis MLVA types present in both cattle and RTA badgers revealed spatial co-localisation in both hosts (Figure 2C). In total, 26 (83.3%) of the 30 MLVA isolates found in badgers were also found in cattle. Herds with and without milk licenses differed across a number of epidemiologically relevant criteria, including herd size (herd size of herds with a milk license, median = 234; IQR: 140-365; without a milk license = 96; IQR: 47-178; wilcoxon signed rank test p <0.001), outwards movements (herds with a milk license = 44; IQR: 25-73; without a milk license = 32; IQR: 12-89; p <0.001), and inwards movements (herds with a milk license = 1; IQR: 0-6; n without a milk license = 15; IQR: 1-79; p <0.001).
1
2
3
Figure 2. The spatial distribution of the twelve most common MLVA types in (a) cattle, (b) RTA badgers, and (c) MLVA types common to both cattle and RTA badgers.
2.2. Assessment of MLVA clustering within the cattle population
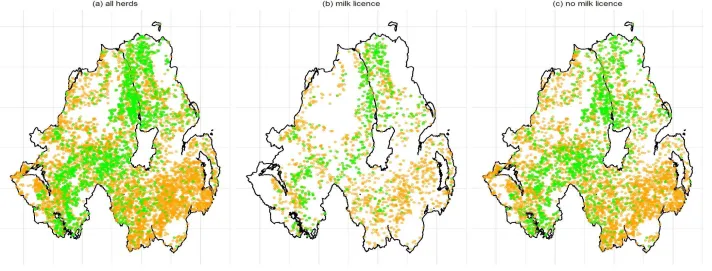
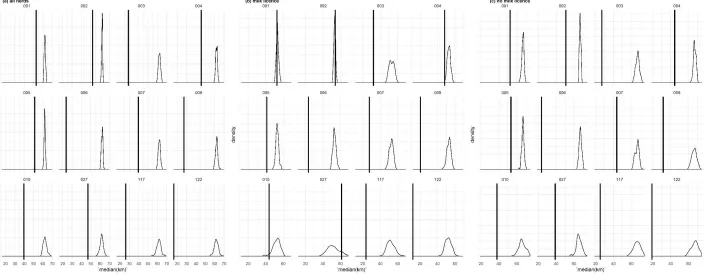
Figure 3 illustrates the distribution of the most common MLVA type (002) in cattle in (i) all cattle herds; Figure 3A, (ii) herds with milk licenses; Figure 3B, and (iii) herds without milk licenses ; Figure 3C (See Supplementary Material 1, Fig 1-11 for the remaining plots). The permutation analysis revealed that herds from which the same M. bovis MLVA type was isolated were significantly closer compared to distances obtained from the sampling distribution (Figure 4A). Whilst similar results were obtained when considering only herds without milk licenses (Figure 4B), for some MLVA types (001, 002, 010 and 027), the actual median distance between infected herds did not appear to differ significantly from the median distances obtained in the sampling distribution (Figure 4C).
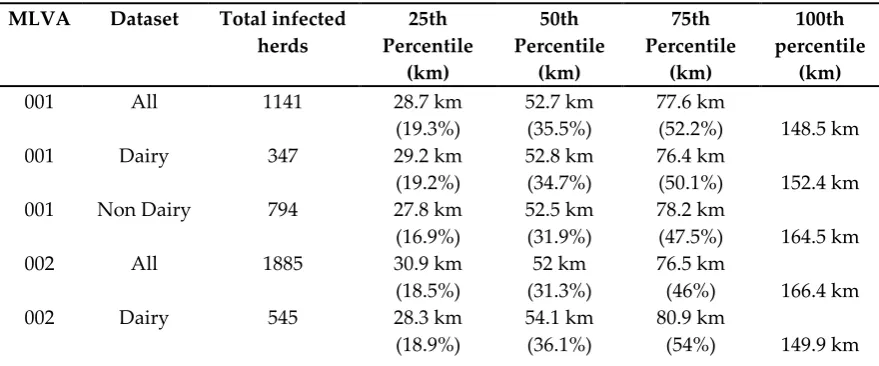
The between-herd pairwise distances for both all study herds and herds without a milk license show that the 50% of herds lay within 62km each other, where 62km represents 35.5% of the maximal pairwise distance between any two herds (174.8km). For only those herds with a milk license, 50% of herd locations were within 63.3km of each other, i.e. 41.3% of the maximal pairwise distance between any two herds with a milk license (152.3km). The frequency distributions of MLVA-specific pairwise distances (See Supplementary Material 2, Fig 1-12) show that for all MLVA types in all herds, 50% of infected herds with a given MLVA type were within 35.5% of the maximal pairwise distance between the two most distal herds, and the largest 75% of pairwise distances were within 55% of the maximal, (Table1). However, the maximal distance between any two herds sharing the same MLVA type could be considerable, with observed distances of 162km between infected herds (e.g. type 009). This reflects a general trend of localised spatial clustering, with the majority of infected herds within relative close proximity to each other, and a smaller number of infected herds disproportionally widely distributed. These patterns were exemplified by type 122, wherein 50% of herds were within 16.3km of each other, which represented only 11.1% of the recorded maximal distance between any two herds from which it was isolated (147.5km). Some 75% of herds infected with type 122 were within 32.1km of each other, which represented only 21.7% of the maximal extent. The remaining 25% of values involved between-herd distances ranging from 32.2km to 147.5km, and contributed towards the remaining 78.3% of the distribution. In all but one MLVA type (type 006), the overall maximal extent was smaller in herds with milk licenses than in herds without, by between 8km (type 010) and 69km (type 122). Despite this, there was marginally less localised clustering in dairy herds compared to non-dairy herds for eight MLVA types (001, 002, 003, 004, 122, 010, 027 and 117). Here, the values associated with the 25th and 50th percentiles were proportionally larger compared to non-dairy herds, ranging in a difference of 0.3% at the 50th percentile (type 117) to 18.9% (type 027).
Table 1: The distances associated with the 25th, 50th, 75th and 100th percentiles from a frequency distribution of pairwise distances between herds infected with a given MLVA type. The values of
the 25th, 50th and 75th percentiles are shown as a percentage of the maximum extent (100th percentile).
MLVA Dataset Total infected herds 25th Percentile (km) 50th Percentile (km) 75th Percentile (km) 100th percentile (km)
001 All 1141 28.7 km
(19.3%)
52.7 km (35.5%)
77.6 km
(52.2%) 148.5 km
001 Dairy 347 29.2 km
(19.2%)
52.8 km (34.7%)
76.4 km
(50.1%) 152.4 km
001 Non Dairy 794 27.8 km
(16.9%)
52.5 km (31.9%)
78.2 km
(47.5%) 164.5 km
002 All 1885 30.9 km
(18.5%)
52 km (31.3%)
76.5 km
(46%) 166.4 km
002 Dairy 545 28.3 km
(18.9%)
54.1 km (36.1%)
80.9 km
002 Non Dairy 1340 31.1 km (18.7%)
50.8 km (30.6%)
74.5 km
(44.8%) 166.4 km
003 All 460 14.9 km
(10%)
29 km (19.4%)
51.2 km
(34.2%) 149.6 km
003 Dairy 118 17.4 km
(13.6%)
32.2 km (25.1%)
51.5 km
(40.1%) 128.4 km
003 Non Dairy 342 13.5 km
(9.1%)
27 km (18.1%)
50.7 km
(33.9%) 149.6 km
004 All 736 26.1 km
(16.7%)
45.6 km (29.1%)
64.2 km
(41%) 156.5 km
004 Dairy 204 27.6 km
(19.7%)
48.1 km (34.3%)
68.3 km
(48.7%) 140.5 km
004 Non Dairy 532 25.4 km
(16.3%)
44.4 km (28.6%)
62.7 km
(40.4%) 155.3 km
005 All 1001 23.8 km
(14.3%)
51.3 km (30.7%)
79.3 km
(47.4%) 167.3 km
005 Dairy 266 17.9 km
(12%)
41.2 km (27.4%)
77.6 km
(51.7%) 150.1 km
005 Non Dairy 735 26.1 km
(15.6%)
53.4 km (31.9%)
79.8 km
(47.7%) 167.3 km
006 All 810 13.9 km
(9.5%)
23.6 km (16.1%)
40.9 km
(27.9%) 146.4 km
006 Dairy 241 12.9 km
(8.8%)
23.2 km (15.9%)
44.7 km
(30.5%) 146.4 km
006 Non Dairy 569 14 km
(10.3%)
23.5 km (17.3%)
39.6 km
(29.2%) 135.8 km
007 All 388 19.8 km
(13.8%)
39.6 km (27.6%)
65.6 km
(45.6%) 143.8 km
007 Dairy 120 14.3 km
(11%)
27.6 km (21.3%)
57 km
(44.1%) 129.4 km
007 Non Dairy 268 22.7 km
(15.8%)
43.7 km (30.4%)
67.9 km
(47.2%) 143.8 km
009 All 355 17.1 km
(10.5%)
27.1 km (16.7%)
44.9 km
(27.7%) 162.0 km
009 Dairy 140
12 km (9.4%)
20.4 km (15.9%)
30.6 km
(23.9%) 128.1 km
009 Non Dairy 215 19.3 km
(11.9%)
31.7 km (19.5%)
52.5 km
(32.4%) 162.0 km
122 All 157 8.5 km
(5.8%)
16.3 km (11.1%)
32.1 km
(21.7%) 147.5 km
122 Dairy 60 6.6 km
(8.5%)
11.9 km (15.2%)
22.7 km
(29.1%) 77.9 km
122 Non Dairy 97 10.4 km
(7.1%)
19 km (12.9%)
36.7 km
(24.9%) 147.5 km
010 All 148 14.2 km
(10.2%)
39.7 km (28.6%)
59.6 km
(42.9%) 138.9 km
010 Dairy 46
15 km (12%)
43.7 km (35%)
59.9 km
(48.1%) 124.7 km
010 Non Dairy 102 12.9 km
(9.7%)
37.7 km (28.3%)
59.3 km
(44.4%) 133.5 km
027 All 157 18.7 km
(11.4%)
46.9 km (28.6%)
88.5 km
027 Dairy 26 27.8 km (20.3%)
61.2 km (44.8%)
84.1 km
(61.6%) 136.4 km
027 Non Dairy 131 13.8 km
(9.2%)
38.9 km (25.9%)
84.1 km
(56.1%) 150.0 km
117 All 116
15 km (10%)
26.2 km (17.5%)
38.8 km
(25.9%) 149.7 km
117 Dairy 37
12.3 km (9%)
23.7 km (17.3%)
37.4 km
(27.3%) 136.8 km
117 Non Dairy 79 14.6 km
(9.8%)
25.2 km (17%)
39.5 km
2.3. Intra and interspecific nearest neighbour (NN) analysis
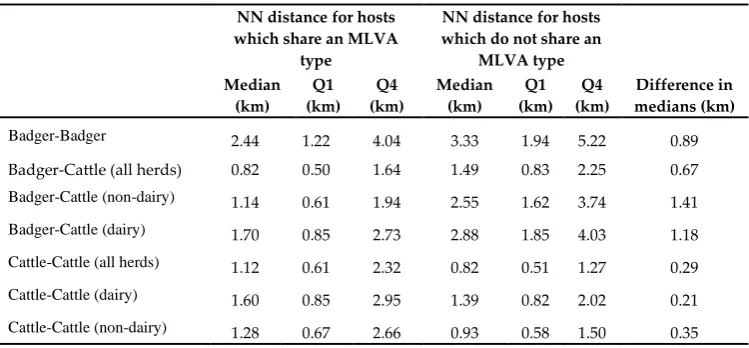
The median distance between NN RTA badgers which shared an MLVA genotype was 2.4km (Inter-Quartile Range; IQR: 1.2km-4.0km), whilst the median distance between nearest neighbour RTA badgers which did not share an MLVA genotype was 3.3km (IQR: 1.9km-5.2km; V = 2853, p = 0.011). RTA badgers were recorded a median distance of 0.61km (0.37km-1.1km) from cattle homesteads, and were generally found in closer proximity to homesteads associated with dairy herds (0.8km; IQR: 0.46km-1.4km) than non-dairy herds (1.4km: IQR: 0.78km-2.1km); for 182 RTA badgers (67.2%), the closest homestead was associated with a dairy herd. The distance between an RTA badger and the NN herd in which the MLVA type was not isolated (1.5km; IQR: 0.83km-2.2km) was almost 45% greater than the distance to a NN herd with the same MLVA type (0.84km; IQR: 0.50km-1.6km; V = 9469, p <0.001). Similar findings were obtained for RTA badgers in proximity to both beef and dairy herds, see Table 2. The NN distance for cattle herds sharing an MLVA type was over 25% greater (1.1km; IQR: 0.61km-2.3km) than the NN distance between herds which did not share the same MLVA type (0.83km; IQR: 0.51km-1.3km). This was also observed in non-dairy herds and to a lesser extent, dairy herds; see Table 2. All findings were also replicated in the sensitivity analysis (all p < 0.05), indicating that the spatial resolution of the data has no substantive impact on the interpretation of the results.
Table 2: Nearest-neighbour (NN) distances for pairs of RTA badgers and cattle herds which share MLVA types, and which do not share MLVA types
NN distance for hosts which share an MLVA
type
NN distance for hosts which do not share an
MLVA type Median
(km) Q1 (km)
Q4 (km)
Median (km)
Q1 (km)
Q4 (km)
Difference in medians (km)
Badger-Badger 2.44 1.22 4.04 3.33 1.94 5.22 0.89
Badger-Cattle (all herds) 0.82 0.50 1.64 1.49 0.83 2.25 0.67
Badger-Cattle (non-dairy) 1.14 0.61 1.94 2.55 1.62 3.74 1.41
Badger-Cattle (dairy) 1.70 0.85 2.73 2.88 1.85 4.03 1.18
Cattle-Cattle (all herds) 1.12 0.61 2.32 0.82 0.51 1.27 0.29
Cattle-Cattle (dairy) 1.60 0.85 2.95 1.39 0.82 2.02 0.21
Cattle-Cattle (non-dairy) 1.28 0.67 2.66 0.93 0.58 1.50 0.35
2.4. Distance-based similarlty analysis
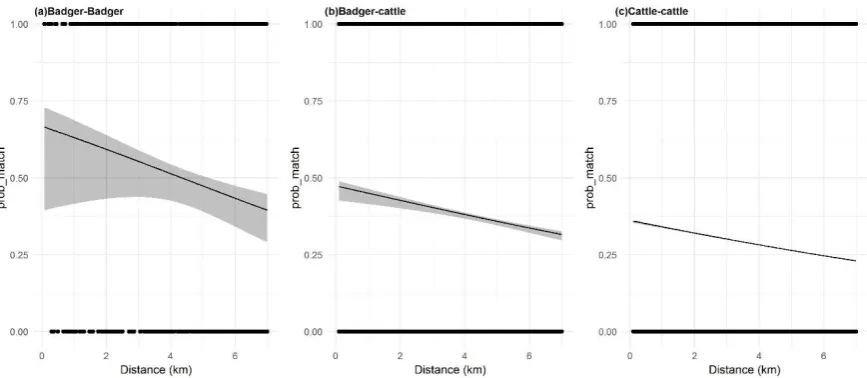
Figure 5. The relationship between probability of an MLVA match between two hosts as a function of distance in the (a) badger-badger context, (b) badger-cattle context, and (c), cattle-cattle context. 2.5. Determinng the factors associated with RTA badgers and nearby cattle herds sharing MLVA types
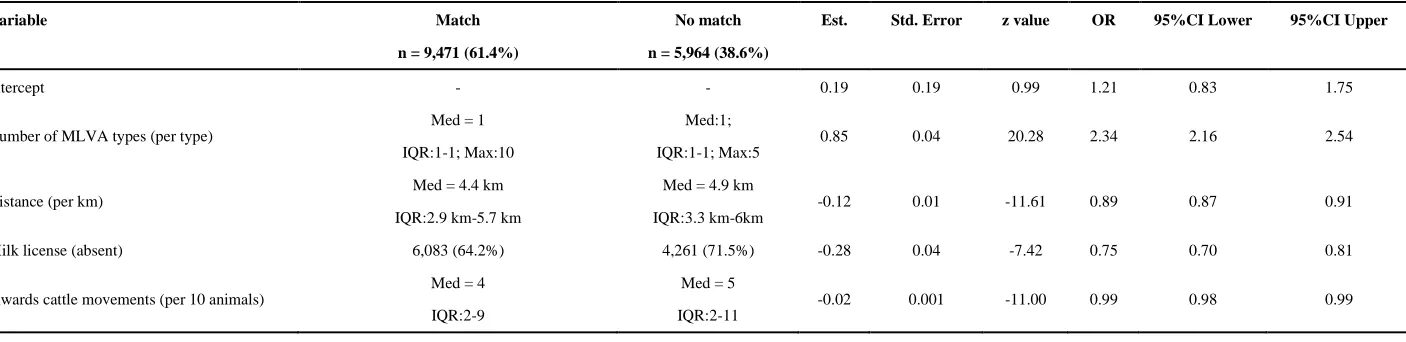
In the final dataset, there were 9,471 RTA badger-cattle pairs with at least one MLVA type in common, and 5,964 RTA badger-cattle pairs with no MLVA types in common. The univariable analysis revealed that the ‘number of MLVA types isolated from a bTB breakdown’ (OR per every additional type: 1.98; 95%CI: 1.83-2.13) and ‘herd size’ (OR per every additional ten animals: 1.01; 95%CI: 1.01-1.02) were positively associated with RTA badgers and nearby cattle herds sharing MLVA types. ‘Distance between hosts’ (OR per km: 0.89, 95%CI: 0.87-0.91), ‘the absence of a milk license’
Table 3: Model coefficients for the factors associated with RTA badgers sharing at least one MLVA in common with nearby cattle herds. The median (Med) and Inter-Quartile Range (IQR) are reported for continuous variables, and where appropriate the maximum (Max) value is also included. The number of instances and percentage
are reported for binary variables
Variable Match
n = 9,471 (61.4%)
No match
n = 5,964 (38.6%)
Est. Std. Error z value OR 95%CI Lower 95%CI Upper
Intercept - - 0.19 0.19 0.99 1.21 0.83 1.75
Number of MLVA types (per type)
Med = 1
IQR:1-1; Max:10
Med:1;
IQR:1-1; Max:5
0.85 0.04 20.28 2.34 2.16 2.54
Distance (per km)
Med = 4.4 km
IQR:2.9 km-5.7 km
Med = 4.9 km
IQR:3.3 km-6km
-0.12 0.01 -11.61 0.89 0.87 0.91
Milk license (absent) 6,083 (64.2%) 4,261 (71.5%) -0.28 0.04 -7.42 0.75 0.70 0.81
Inwards cattle movements (per 10 animals)
Med = 4
IQR:2-9
Med = 5
IQR:2-11
3. Discussion
Spatial clustering in M. bovis molecular types, at various genetic and geographic scales, has previously identified co-localisation of infection between infected livestock and wildlife hosts [20, 27-31], however little attention has been given to what the patterns in spatial distribution of M. bovis genetic types in NI reveal about the processes driving the epidemic in, and between, hosts. It is already understood that the M. bovis population in Northern Irish cattle herds is characterized by marked spatial structuring and spatial clusters of MVLA types at the herd level [18, 19]. Here, we additionally show that the distribution of infection within clusters is not homogeneous, and that clusters consist of central foci, where 50% of infected herds lie within 35% of the cluster extent. This is consistent with “anchoring” influences in driving spatially restricted epidemics [32]; in Great Britain (GB), some 75% of infection was attributed to local spread [33]. Such processes act over relatively short distances, and can include infection from contiguous herds [26, 34, 35], infected wildlife [6, 36, 37], or the predominance of short-range, between-herd movements over longer-range movements, as observed in GB [38] and Ethiopia [39] (but not in Uruguay, where infection clusters change location year on year, suggesting long-distance spread of disease [40]). Spatial correlation has been reported in disease transmission coefficients at scales <14km, suggesting that a highly localised contact network is an important epidemiological driver of bTB [32]. However, we also identified pairwise distances of over 130km in herds infected with the same M. bovis MLVA type, and thus the spatial distribution of MLVA types also has an expansive element. Long- range cattle movements, or moving cattle between distal land-parcels, may drive the wider dissemination of infection [41, 42], but our evidence is consistent with such processes being relatively less important than local factors investigated in driving the overall epidemic. This is consistent with results from France, where spatial proximity to another infected herd was more strongly associated with bTB infection and inwards movements [43].
In our study, there was little compelling evidence of differences in the spatial dissemination of MLVA types between herds with and without a milk license, notwithstanding that dairy herds were associated with outwards moves compared to non-dairy herds. This observation may further reflect the diminished role of long-distance cattle movements in disease spread, compared to other sources. However, the data do tentatively indicate slightly less localised clustering in MLVA types in dairy herds, which could be explained by the fewer short-range, between-herd movements in dairy production. However, as yet the frequencies and Euclidian distances associated with the full cattle movement network in different herd types in NI are unknown [44]; whilst this study confirms that there are more inwards animal movements in non-dairy production, the distribution of trading distances between herds (as in Vernon, 2011) has not yet been derived.
approximately 9% for every km between hosts, up to a 7km cut-off. Not only does this further confirm the co-localisation of infection in both host systems, but the relatively small rate of change also alludes to the strength of localised influenced in maintaining the M. bovis population structure, and by extension, the epidemic. There was less dissimilarity when looking at the likelihood of RTA badgers and herds with milk licenses sharing MLVA types (decrease of 7% per km) compared to RTA badgers and herds without milk licenses (decrease of 11% per km). Whilst this difference is small, it suggests greater between-herd homogeneity in the M. bovis population in herds with milk licenses, compared to herds without, possibly due to inwards movements driving accumulations of within-herd MLVA type diversity in non-dairy within-herds [25].
RTA badgers were more likely to have at least one MLVA type in common with herds with milk licenses than herds without. We posit that this reflects animal management practices, as beef herds are likely to operate by purchasing larger volumes of animals, retaining these animals in the herd for only a short period before sending cattle onwards or to slaughter. Beef herds have been linked to the presence of multiple reactors [26] arising from the purchase of animals with undetected infection, possibly from many different geographical locations. Indeed, we identified the inwards movement of animals as a negative influence on whether RTA badgers and cattle share MLVA types. We hypothesise that high cattle turnover in these herds means that the local MLVA types are less likely to become established in the immediate environment, limiting the opportunity for a co-localisation of M. bovis genotypes between badgers and cattle. The findings may also suggest that inter-species transmission is perhaps not particularly efficient [9] given that a shared M. bovis epidemic is less likely to be observed in herds associated with a high animal turnover. Conversely, animals in dairy settings may be more likely to be exposed to local M. bovis genotypes, resulting in the repeated emergence of M. bovis genotypes via introduction from local sources, possibly exacerbated by within-herd amplification. The SICCT test may also be less effective in dairy within-herds [47] and infected dairy cattle may be less likely to exhibit visible lesions post mortem [48]. This is highly suggestive that dairy herds may be at elevated risk of within-herd recrudescence of the same M. bovis genotypes compared to beef herds.
3.1. Limitations
As alluded to, the main limitation of this study is the nature of the RTA badger survey. The general limitations of these data are well acknowledged [16] but the bias in collection localities was presumed to have the most impact on these results. Nevertheless, this does not limit the utility of the dataset to make some inferences about the spatial relationships in MLVA types in, and between, the badger and cattle populations, with the caveat that a more representative RTA badger dataset would enable more robust inferences to be drawn, to include for example, badger population structure or spatially explicit environmental heterogeneity associated with badger presence [49]. Ideally, a more comprehensive sampling of M. bovis genotypes in the badger population in NI would be undertaken. Furthermore, it is understood the cattle farms in NI are highly fragmented, and can consist of multiple, distal land parcels. The use of land parcel locations may provide a more accurate and precise indication of true herd locations and quantify the opportunity for herds to interact spatially with neighbouring herds. This could shed more light on true spatial association of M. bovis genotypes in cattle herds. While co-localisation of molecular types between hosts, in various settings and at differing genetic and geographical scales have been reported previously, our analyses extend our understanding of associated risk factors. Further, while molecular epidemiology using MLVA is being superseded by phylodynamics using whole-genome sequencing and modelling to investigate transmission dynamics [7], our results, in a different system, are consistent with previous literature.
4. Materials and Methods
The area of NI is approximately 13,500 km2. The bTB programme is administered across 10 Divisional Veterinary Offices (DVOs) and 123 administrative patches. There are approximately 1.6 million cattle in NI, distributed throughout approximately 20,000 herds. This includes some 2,500 dairy herds (313,549 cattle) and 14,000 beef herds (247,009 cattle), amongst others [50].
4.2. Study Data
4.2.1. M. bovis molecular typing data
Whilst herd-level MLVA surveillance (MLVA typing on the first reactor) has been ongoing since 2003, from 2008, animal-level M. bovis MLVA typing is carried out on every SICCT reactor and lesioned animal identified at routine slaughter (LRS). MLVA analysis was carried out using established high resolution methods [18, 19, 51]. The eight M. bovis VNTR loci genotyped were MV2163B/QUB11B, MV4052/QUB26A, MV2461/ETRB, MV1955/Mtub21, MV1895/QUB1895, MV2165/ETRA, MV2163/QUB11A and MV3232/QUB3232. VNTR results were concatenated into a Multi-Locus VNTR Analysis (MLVA) string which constituted the molecular type of the isolate; this string was further simplified in a local laboratory nomenclature which reflected the previously assessed herd-level prevalence of MLVA types.
4.2.2. Cattle data
Animal-level MLVA profiles of isolates were associated with anonymised breakdown-level data made available from the Animal and Plant Health Information System database (APHIS) [52], administered by the Department of Agriculture, Environment and Rural Affairs (DAERA). This enabled the determination of the number of M. bovis MLVA types present in each confirmed bTB breakdown; this dataset has been described in full elsewhere [25]. Additional relevant epidemiological variables included in these data were the breakdown start and end dates, presence of a milk license (dairy herds) or no milk license (non-dairy herds), herd size at the time of bTB breakdown, the number of inwards and outwards cattle movements in the year before breakdown, and the herd DVO. The geo-referencing of registered homestead locations (here referred to as herd locations) were available in the form of the first four digits of the six figure Irish grid reference, which provides reasonable estimations of cattle herd density and distribution.
4.2.3. Badger data
The RTA badger dataset has been described previously [16, 20, 53]. Briefly, from 1998, the carcasses of badgers suspected to have died from accidental causes (e.g. road traffic accidents; RTA’s) were collected by a wildlife officer from the Department of Agriculture, Environment and Rural Affairs (DAERA). Badger carcasses were checked for the presence of visible lesions consistent with tuberculosis, and defined tissues and bodily fluid samples were also collected for bacterial culture. Culture-confirmed M. bovis underwent further MLVA analysis by the Agri-Food and Biosciences Institute (AFBI) to determine the bTB spoligotype and MLVA genotype of the isolate. The geo-referenced collection location for RTA badgers was recorded to within 100m of the actual location. This study included only badgers collected after 2008 to align temporally with the cattle data.
4.3. Assessment of MLVA clustering within the cattle population
MLVA type was compared to those derived from the sampling distribution using Wilcoxon signed rank tests.
Next, a pairwise Euclidean distance matrix between all herds infected with the same MVLA type was generated. The cumulative frequency of these distances was used to investigate the spatial spread of herds within clusters; if the majority of pairwise distances lay below the distance represented by the 50th percentile, this indicated spatial clustering. However, if the pairwise distances were broadly distributed (i.e. 50% of pairwise distances equal to or greater than the 50th
percentile), this instead suggested that infected herds are widely distributed across space. This process was also conducted separately for herds with and without milk licenses.
4.4. Intra-and interspecific nearest neighbour analysis
Following similar methods to Trewby (2016) and Abernethy et al., (2011), the Euclidian Nearest Neighbour (NN) distance was calculated between each RTA badger to the closest RTA badger with the same M. bovis MLVA type, and to the closest RTA badger with a different M. bovis MLVA type. Only badgers within 7km of each other were included, as this represents the approximate 95 percentile of the dispersal movement kernel of badgers in the ROI [54]. Furthermore, the RTA collection dates had to fall within two years of each other; it is reasonable to assume that a two year window will adequately captured co-localisation of infection without introducing ambiguity from associating entities across longer temporal windows. Similar NN distance measures were calculated for RTA badger-cattle herd pairs, repeated separately for only those herds with a milk license, and those without a milk license. Again, only badger and cattle hosts within 7km of each other were included, and the RTA collection date and herd breakdown period had to be within two years of each other. Finally, NN distances were calculated between cattle-cattle pairs, under the same criteria. The null hypothesis was that distances between hosts which share M. bovis MLVA types were not significantly different to distances between hosts that do not. This was tested using paired Wilcoxon signed rank tests, and pwas established at ≤ 0.05. To interrogate any limitations in the resolution of spatial data (i.e. the RTA badger and cattle herd co-ordinates were each subject to a 100m error), a sensitivity analysis was conducted whereby the analyses were re-run 100 times, with values between 1m and 99m added to, or subtracted from, each of the cattle and badger latitude and longitude co-ordinates.
4.5. Distance based similarlaity analysis
Using the approach established by Goodchild et al (2012), the Odds Ratio (OR) of an M. bovis MLVA type match was calculated as a function of distance between hosts that yielded MLVA-typed M. bovis, up to a distance of 7km. The two-year temporal association was again applied to this analysis. These data were used in the construction of logistic Generalised Linear Mixed Models (GLMMs), with a binary outcome indicating whether or not the M. bovis MLVA types matched. The single explanatory fixed-variable was distance, and herd DVO was allowed to vary with a random intercept.
4.5. Determinng the factors associated with RTA badgers and nearby cattle herds sharing MLVA types We modelled factors associated with RTA badgers and nearby cattle sharing the same MLVA
type. The outcome of interest was ‘whether any cow in a herd within a 7km radius of an RTA badger
correlation values; variables with a correlation coefficient greater than 0.5 or less than -0.5 were considered for removal, with the aim of retaining the most biologically relevant predictor(s). DVO was allowed to vary with a random intercept. The final model was arrived at via a backwards stepwise routine [55], and the impact of variable removal at each stage was assessed by comparing model AIC values, examining changes in model coefficients and assessing confounding. Where potential confounding was identified, it was investigated by running separate analyses on the suspected confounders. The influence of outliers and influential points was assessed by re-running models with potential influential points removed, and comparing the model coefficients.
All data processing and analyses were carried out using Microsoft Excel and R version 3.4.4 (R Core Team 2014). The packages rgdal [56], rgeos [57] and ggplot2 [58] were used to create maps and figures, models were built using lme4 [59], and dplyr [60] was used for data handling.
Supplementary Materials: The following are available online; Supplementary Material 1 and Supplementary Material 2.
Author Contributions: Conceptualization, Adrian Allen, Robin Skuce and Andrew Byrne; Data curation, Jordon Graham; Formal analysis, Georgina Milne; Funding acquisition, Robin Skuce and Andrew Byrne; Methodology, Georgina Milne, Adrian Allen, Carl McCormick , Eleanor Presho, Robin Skuce and Andrew Byrne; Project administration, Robin Skuce and Andrew Byrne; Resources, Raymond Kirke, Carl McCormick and Eleanor Presho; Software, Georgina Milne and Jordon Graham; Supervision, Adrian Allen, Robin Skuce and Andrew Byrne; Writing – original draft, Georgina Milne, Adrian Allen, Robin Skuce and Andrew Byrne; Writing – review & editing, Georgina Milne, Adrian Allen, Robin Skuce and Andrew Byrne.
Funding: This research was funded by the Department of Agriculture, Environment and Rural Affairs for project 16-3-06.
Acknowledgments: The authors wish to extend particular gratitude towards the following individuals: Dr Hannah Trewby, whose PhD research inspired some of the methodology, Drs Emily Courcier and Maria O’Hagan who were associated with managing the DAERA badger RTA data, and Prof Darrell Abernethy who previously established methods for investigating RTA badger-cattle relationships in NI. The authors also wish to extend thanks and acknowledgement to all of the AFBI staff involved in bovine tuberculosis histology, pathology, bacteriology, molecular microbiology, case confirmation and MLVA typing, along with the Epidemiology, Molecular biology and Immunology cluster (https://twitter.com/AFBI_EMbI) for technical support and discussion. We are also thankful to the DAERA Veterinary Service and abattoir staff who deliver the NI bTB eradication programme, those staff who maintain and manage the DAERA APHIS database, and all staff involved the DAERA badger RTA scheme.
Conflicts of Interest: The senior author, Dr Andrew Byrne, is a member of the Pathogens journal editorial board. Aside from this, the authors declare no conflict of interest. The funders had no role in the design of the study; in the collection, analyses, or interpretation of data; in the writing of the manuscript, or in the decision to publish the results.
References
1. Gortázar, C., et al., Diseases shared between wildlife and livestock: a European perspective. European Journal of Wildlife Research, 2007. 53(4): p. 241.
2. de la Rua-Domenech, R., et al., Ante mortem diagnosis of tuberculosis in cattle: A review of the tuberculin
tests, γ-interferon assay and other ancillary diagnostic techniques. Research in Veterinary Science, 2006. 81(2): p. 190-210.
3. Morris, R.S., D.U. Pfeiffer, and R. Jackson, The epidemiology of Mycobacterium bovis infections. Vet Microbiol, 1994. 40(1-2): p. 153-77.
4. Mathews, F., et al., Bovine tuberculosis (Mycobacterium bovis) in British farmland wildlife: the importance to agriculture. Proceedings of the Royal Society B: Biological Sciences, 2006. 273(1584): p. 357-365.
6. Byrne, A.W., et al., Spatial and temporal analyses of metrics of tuberculosis infection in badgers (Meles meles) from the Republic of Ireland: Trends in apparent prevalence. Preventive Veterinary Medicine, 2015. 122(3): p. 345-354.
7. Crispell, J., et al., Combining genomics and epidemiology to analyse bi-directional transmission of Mycobacterium bovis in a multi-host system. eLife, 2019. 8: p. e45833.
8. GORTÁZAR, C., et al., The status of tuberculosis in European wild mammals. Mammal Review, 2012. 42(3): p. 193-206.
9. Böhm, M., M.R. Hutchings, and P.C.L. White, Contact Networks in a Wildlife-Livestock Host Community: Identifying High-Risk Individuals in the Transmission of Bovine TB among Badgers and Cattle. PLOS ONE, 2009. 4(4): p. e5016.
10. Campbell, E.L., et al., Interspecific visitation of cattle and badgers to fomites: A transmission risk for bovine tuberculosis? Ecology and Evolution, 2019.
11. Barasona, J.A., et al., Environmental Presence of Mycobacterium tuberculosis Complex in Aggregation Points at the Wildlife/Livestock Interface. Transboundary and Emerging Diseases, 2017. 64(4): p. 1148-1158. 12. NIAO, The control of Bovine Tuberculosis in Northern Ireland. 2018, Northern Ireland Audit Office: Belfast. 13. Allen, A.R., R.A. Skuce, and A.W. Byrne, Bovine Tuberculosis in Britain and Ireland – A Perfect Storm? the Confluence of Potential Ecological and Epidemiological Impediments to Controlling a Chronic Infectious Disease.
Frontiers in Veterinary Science, 2018. 5(109).
14. Reid, N., et al., Monitoring and population estimation of the European badger Meles meles in Northern Ireland.
Wildlife Biology, 2012. 18(1): p. 46-57.
15. Abernethy, D.A., et al., Mycobacterium bovis surveillance in European badgers (Meles meles) killed by vehicles in Northern Ireland: an epidemiological evaluation. Épidémiologie et Santé Animale, 2011(No.59/60): p. 216-218.
16. Courcier, E.A., et al., Monitoring Mycobacterium bovis in Eurasian badgers (Meles meles) killed by vehicles in Northern Ireland between 1998 and 2011. Veterinary Record, 2017: p. vetrec-2016-103934.
17. Kamerbeek, J., et al., Simultaneous detection and strain differentiation of Mycobacterium tuberculosis for diagnosis and epidemiology. Journal of Clinical Microbiology, 1997. 35(4): p. 907.
18. Skuce, R.A., et al., Mycobacterium bovis genotypes in Northern Ireland: herd-level surveillance (2003 to 2008).
Veterinary Record, 2010. 167(18): p. 684-689.
19. Skuce, R., et al., Longitudinal dynamics of herd-level Mycobacterium bovis MLVA type surveillance in cattle in Northern Ireland 2003-2016. Infection, Genetics and Evolution, 2020. 79: p. 104131.
20. Trewby, H., The genetic and spatial epidemiology of bovine tuberculosis in the UK : from molecular typing to bacterial whole genome sequencing 2016, University of Glasgow.
21. Trewby, H., et al., Use of bacterial whole-genome sequencing to investigate local persistence and spread in bovine tuberculosis. Epidemics, 2016. 14: p. 26-35.
22. Fielding, H.R., et al., Contact chains of cattle farms in Great Britain. Royal Society Open Science, 2019. 6(2): p. 180719.
23. Doyle, L.P., et al., Bovine tuberculosis in Northern Ireland: Risk factors associated with duration and recurrence of chronic herd breakdowns. Preventive Veterinary Medicine, 2016. 131: p. 1-7.
24. Menzies, F.D. and S.D. Neill, Cattle-to-Cattle Transmission of Bovine Tuberculosis. The Veterinary Journal, 2000. 160(2): p. 92-106.
26. O'Hagan, M.J.H., et al., Herd-level risk factors for bovine tuberculosis and adoption of related biosecurity measures in Northern Ireland: A case-control study. The Veterinary Journal, 2016. 213: p. 26-32.
27. Goodchild, A.V., et al., Geographical association between the genotype of bovine tuberculosis in found dead badgers and in cattle herds. Veterinary Record, 2012. 170(10): p. 259-259.
28. Woodroffe, R., et al., Spatial association of Mycobacterium bovis infection in cattle and badgers Meles meles.
Journal of Applied Ecology, 2005. 42(5): p. 852-862.
29. Olea-Popelka, F.J., et al., Spatial relationship between Mycobacterium bovis strains in cattle and badgers in four areas in Ireland. Preventive Veterinary Medicine, 2005. 71(1–2): p. 57-70.
30. Rodríguez, S., et al., High spoligotype diversity within a Mycobacterium bovis population: Clues to understanding the demography of the pathogen in Europe. Veterinary Microbiology, 2010. 141(1): p. 89-95. 31. Romero, B., et al., Persistence and molecular evolution of Mycobacterium bovis population from cattle and
wildlife in Doñana National Park revealed by genotype variation. Veterinary Microbiology, 2008. 132(1-2): p. 87-95.
32. Cruz, M.L.d.l., et al., Spatial dynamics of Bovine Tuberculosis in the Autonomous Community of Madrid, Spain (2010–2012). PLOS ONE, 2014. 9(12): p. e115632.
33. Green, D.M., et al., Estimates for local and movement-based transmission of bovine tuberculosis in British cattle.
Proceedings of the Royal Society of London B: Biological Sciences, 2008. 275(1638): p. 1001-1005. 34. White, P.W., et al., The importance of ‘neighbourhood’ in the persistence of bovine tuberculosis in Irish cattle
herds. Preventive Veterinary Medicine, 2013. 110(3-4): p. 346-355.
35. Guta, S., et al., Epidemiological investigation of bovine tuberculosis herd breakdowns in Spain 2009/2011. PloS one, 2014. 9(8): p. e104383-e104383.
36. Byrne, A.W., et al., Risk of tuberculosis cattle herd breakdowns in Ireland: effects of badger culling effort, density and historic large-scale interventions. Veterinary research, 2014. 45(1): p. 109.
37. Denny, G.O. and J.W. Wilesmith, Bovine tuberculosis in Northern Ireland: case-control study of herd risk factors. The Veterinary Record, 1999. 144: p. 310.
38. Vernon, M.C., Demographics of cattle movements in the United Kingdom. BMC Veterinary Research, 2011. 7(1): p. 31.
39. Mekonnen, G.A., et al., Network analysis of dairy cattle movement and associations with bovine tuberculosis spread and control in emerging dairy belts of Ethiopia. BMC Veterinary Research, 2019. 15(1): p. 262. 40. Picasso, C., et al., Epidemiological investigation of bovine tuberculosis outbreaks in Uruguay (2011–2013).
Preventive Veterinary Medicine, 2017. 138: p. 156-161.
41. Gopal, R., et al., Introduction of bovine tuberculosis to north-east England by bought-in cattle. Veterinary Record, 2006. 159(9): p. 265-271.
42. Adkin, A., et al., Assessing the impact of a cattle risk-based trading scheme on the movement of bovine tuberculosis infected animals in England and Wales. Preventive Veterinary Medicine, 2016. 123: p. 23-31. 43. Palisson, A., A. Courcoul, and B. Durand, Role of Cattle Movements in Bovine Tuberculosis Spread in France
between 2005 and 2014. PLOS ONE, 2016. 11(3): p. e0152578.
44. Brown, E., et al., Cattle movements in Northern Ireland form a robust network: implications for disease management. Prev Vet Med, 2019. 170: p. 104740.
45. Trewby, H., et al., Relative abundance of Mycobacterium bovis molecular types in cattle: A simulation study of potential epidemiological drivers. BMC Veterinary Research, 2017. 13: p. 268.
47. Lahuerta-Marin, A., et al., Bayesian latent class estimation of sensitivity and specificity parameters of diagnostic tests for bovine tuberculosis in chronically infected herds in Northern Ireland. Vet J, 2018. 238: p. 15-21.
48. Byrne, A.W., et al., Bovine tuberculosis visible lesions in cattle culled during herd breakdowns: the effects of individual characteristics, trade movement and co-infection. BMC Veterinary Research, 2017. 13(1): p. 400. 49. Bouchez-Zacria, M., et al., Environmental determinants of the Mycobacterium bovis concomitant infection in
cattle and badgers in France. European Journal of Wildlife Research, 2017. 63(5): p. 74.
50. DAERA, Final Results of the June Agricultural Census 2019. 2020, Statistics and Analytical Services Branch, Policy, Economics and Statistics Division Belfast.
51. Skuce, R.A., et al., Discrimination of isolates of Mycobacterium bovis in Northern Ireland on the basis of variable numbers of tandem repeats (VNTRs). Veterinary Record, 2005. 157(17): p. 501-504.
52. Houston, R., A computerised database system for bovine traceability. Revue Scientifique et Technique-Office International des Epizooties, 2001. 20(2): p. 652.
53. Abernethy, D.A., et al. Survey for Mycobacterium bovis Infection in Road-Traffic-Accident Badgers in Northern Ireland. in International Symposium of Veterinary Epidemiology and Economics. 2003.
54. Byrne, A.W., et al., Large-scale movements in European badgers: has the tail of the movement kernel been underestimated? Journal of Animal Ecology, 2014. 83(4): p. 991-1001.
55. Zuur, A.I., E.N. ; Walker, N.; Saveliev, A.A.; Smith G.M., Mixed Effects Models and Extensions in Ecology with R. 2009: Springer978.
56. Bivand, R., et al., rgdal: Bindings for the Geospatial Data Abstraction Library. 2010.
57. Bivand, R. and C. Rundel, rgeos: Interface to Geometry Engine - Open Source ('GEOS'). 2017. 58. Wickham, H., ggplot2: Elegant Graphics for Data Analysis. 2009: Springer-Verlag New York.
59. Bates, D., et al., Fitting Linear Mixed-Effects Models Using lme4. Journal of Statistical Software, 2015. 67(1): p. 1-48.