198
An Approach Based On Model Driven
Engineering For Big Data Visualization In
Different Visual Modes
Allae Erraissi, Abdessamad Belangour
Abstract: Data visualization consists of transforming complex data into simple visual representations to facilitate understanding and exploitation of data.
The goal of this strategy is to make information accessible to everyone, or more specifically to people who can make decisions based on the data collected. During our research project, we have worked on the application of techniques related to model engineering to propose a universal meta-model for the different layers of a Big Data system. In continuous efforts, we present in this paper a model engineering approach that allows displaying the data in several visual modes, by using Atlas Transformation Language (ATL).
Index Terms: Meta-model, Model Driven Engineering, Big Data, Visualization layer, Data Viz.
—————————— ——————————
1
INTRODUCTION
Beyond semantic considerations, it is clear that nowadays, and more than ever, it is important to be able to present key information in an intelligible and exploitable form. In the field of web analytics, the profusion of indicators of all kinds tends to drown the user under a flood of information that the human brain is struggling to deal with, when in fact only a few are useful. Indeed, the graphical representation makes it possible to better analyze trends, and no to get lost in the analysis of isolated figures. Several tools offer many features to create custom web dashboards to visualize in a single page the relevant indicators for a website, either in a graphical form, flow, or in a tabular one. In our continuous efforts to achieve the best results, we identify the key concepts of the visualization layer in Big Data thanks to our previous comparative studies [1]. In fact, this work is an improvement from the first study that we have already done [2] and which deals with the layer of visualization in Big Data. Thus this work is a progress report of our latest proposals from the different layers of Big Data: Data Sources, Ingestion [3], Hadoop Storage [4,5], Hadoop Management [6,7], Visualization [2,8], and Security [9]. The main purpose of this paper is to propose a universal meta-modeling for a Big Data system. This universal meta-modeling will be used in an independent cross-platform Domain Specific Language.
2
RELATED
WORK
Several visualization frameworks have emerged for the purpose of interacting with Big Data. For example, Mural [10] and GraphLog [11] can be used to quickly prototype visualizations. In the work of Consens et al. [12], they used the GraphLog tool to generate interactive views, while Bloom [13] uses a graphical query language Mural.
To explain: A Bloom's filter is a data structure, an implementation of the Abstract type Ensemble. However, it remains unclear whether graphical algebra is the most efficient way to specify views. GVL [14] uses a functional programming language to specify the output of a program. We think this approach is much more intuitive than other graph algebra approaches. Besides, Mackinlay proposed in these works to use graphical sentences to generate relational information presentations [15]. The technique proposed by Mackinlay is related to the field of interaction design. There is also the graphical modeling project of Eclipse [16] which has several features that allow modelers to define graphics editors dedicated to their data. The defined graphic editors can be used as viewers. Its principal problem is that they do not support graphic views such as graphics, zoomable interfaces, and 3D visualizations. The views they support are limited to simple graphics with containers. Note that software visualizations often contain thousands of visual entities. Nevertheless, it is clear that the GMF project does not allow us to specify the visualizations of the results of the query. This means that the diagram definition language is not as powerful as the relational algebra used by other tools. Another Eclipse visualization tool is BIRT [17], which is a tool for the integration of reports and integration. It can be integrated into existing data sets and produce 2D and 3D statistical graphs. It also produces maps, but they are relatively static and cannot be easily integrated with other tools such as EMF [18] and GMF. Yet, each of these technologies contributed to the realization of our work that deals with the visualization layer in Big Data. Our main goal is to propose a universal meta-modeling for this layer regardless of the platforms.
3
MODEL
DRIVEN
ARCHITECTURE
(MDA)
Model Driven Architecture (MDA) [19] is a model-oriented approach defined by the Object Management Group (OMG) and made public at the end of 2000. This approach specifies three levels of abstraction (level business, platform-independent level, and platform-dependent level) for the description of the system architecture. It also proposes a development process based on these three levels and led by the models. The basic idea of MDA is to separate the functional specifications of a system from the specifications of its implementation on a given target platform. In an MDA-oriented development process, everything is considered as a
_______________________________________
• Allae Erraissi, Laboratory of Information Technology and Modeling, Hassan II University, Faculty of sciences Ben M’Sik, Casablanca Morocco. E-mail: [email protected]
model. Thus, MDA identifies four types of models: CIM, PIM, PDM, and PSM.
The CIM (Computation Independent Model), also called a domain model or business model, models the requirements of the system. Its purpose is not only to help the understanding of the problem but also to fix a common vocabulary for a particular field. MDA makes no recommendation concerning the language to be used to describe the MICs. For example, in UML the requirements models are described using use case diagrams or with the use of UML profiles such as SysML [20].
The Platform Independent Model (PIM) also called a model of analysis and abstract design of the application. This model describes the system without showing the details of its use on a particular platform. In MDA, it is possible to develop several PIM models independent of the target platform. PIM models do not contain information about runtime platforms. A PIM must be refined with the details of one or more particular architecture (s) to produce a PSM.
The Platform Description Model (PDM) describes the platform on which the system will be run, for example, component models with different levels of abstraction such as CCM or EJB).
The Platform Specific Model (PSM) or a specific model of the execution platforms. PSM is the model produced by the transformation of a PIM to take into account the technical information related to the chosen platform. The PSM can be refined by successive transformations until an executable system is obtained.
Fig. 1. MDA Model Levels [19].
Figure 1 gives an overview of an MDA process commonly referred to as the Y development cycle by showing the different levels of abstraction associated with the models.
4
MODEL
TRANSFORMATION
The two main artifacts of model engineering are modeling and model transformations. From a general point of view, we call a model transformation any process whose inputs and outputs are models. The purpose of defining and automating
transformations is to make models more operational and to increase the productivity of development in an IDM approach. This section presents the general principle of a transformation, the types of model transformation as well as the main transformation languages.
4.1 General principle of a transformation
A transformation is the automatic generation of a target model (s) from a source model (s), following a transformation definition. A transformation definition is a set of transformation rules that describe how a model described with a source language can be transformed into a model described with the target language [21]. A transformation rule describes how one or more source language constructs can be transformed into one or more constructs of the target language [22]. Moreover, one can model the transformation itself by applying the principles of the IDM to it, and thus considering it as an application defined by a transformation model (Mt) itself conforming to a meta-model (MMt). This last represents the abstract definition of the transformation language [23]. As illustrated in figure 2, a model transformation defined by a model Mt is the operation which makes it possible to transform a model Ma (conforming to its meta-model MMa) into a model Mb (conforming to its meta-model MMb). In a more formal way, we can define this operation by the following function:
Mb : MMb = Trans (Ma : MMa , Mt : MMt)
Fig. 2. Model transformation process [23
]. 4.2 Typology of transformations
The source and target models are described by meta-models that may be the same or different. In [24], we distinguish the so-called endogenous and exogenous transformations combined with so-called vertical and horizontal transformations. A transformation is:
- Endogenous: if the source and target models conform to the same meta-model;
- Exogenous: if the source and target models conform to different meta-models;
- Horizontal: if the meta-models reside at the same level of abstraction;
- Vertical: if the meta-models reside at different levels of abstraction.
In the literature, we find [24], [25] and also [26]. There is also another typology of transformations characterized as follows:
200
table.
- Multiple transformations (M to N) transforms one or more elements of a source model into one or more elements of a target model. Example of multiple transformations are model decomposition transformations (1 to N) and model fusion (N to 1);
- An update transformation sometimes called on-site transformation makes it possible to modify a model by adding, modifying or deleting one of its elements. In this type of transformation, the source model is updated without the explicit creation of the target model. As an example, we have Model Refactoring, which is used to rearrange elements of a model to improve its structure or readability.
At the same time, we refer to the classification proposed in [25] and presented in [27], and which is based on the nature of the software artifact produced by the transformation and the technique used to implement it. In fact, two major families of approaches are listed here: the "model-to-model" transformation approaches, and the "model-to-text" transformation approaches.
Model to model transformation
Fig. 3. Model to model transformation [27].
Figure 3 shows model-to-model transformation methods. Each model is expressed as an instance of its meta-model using an appropriate data structure. The transformation rules are expressed according to the entities and structures defined by them. They are interpreted for each source model by the model transformation tool. This approach is characterized by the fact that the source model and the product model are expressed in a structured way according to their respective meta-model. The transition from a PIM model to a PSM is the most classic example of this type of transformation.
Model to text transformation
Fig. 4. Model to text transformation [27].
Figure 4 illustrates the use of model-to-text transformations. The source model is described according to its meta-model, but the resulting model is unstructured in text form (source code, XML file, etc.). The transformation rules are written according to the meta-model of the source model, and the syntax of the produced files. The target meta-model no longer exists directly in the transformation process. Code generation can be considered as a special case of model-to-text transformation. Regarding this, several open-source and commercial MDA tools based on "templates" for transforming models into code have emerged. In this category, we can mention Acceleo [28] which is integrated into the Eclipse platform and the EMF framework or AndroMDA [29].
4.3 Transformation languages
Model transformation is a central operation of Model Driven Engineering. For this reason, several transformation languages have been defined. Typically, transformation languages apply IDM techniques to transform themselves. The principle is to offer a meta-model to build transformation models. In what follows, we present the QVT languages of the OMG [30] and ATL of the ATLAS group of INRIA-LINA [31] which are widely used in the IDM community and which we consider it representative of this category of languages.
4.3.1 QVT
Fig. 5. QVT standard architecture [30]. 4.3.2 ATL
In order to propose tools that claim the MDA architecture published in 2002 by the OMG, the INRIA laboratory in Nantes has developed the ATL model transformation language [32] (ATLAS Transformation Language) that we use in the rest of this thesis. An ATL program is composed of rules that define how elements of the source model are identified and traversed to create the elements of the target model (model-to-model transformation (called Module)). Beyond the transformations of classical models, ATL defines an additional model of request which makes it possible to specify queries on the models (transformations of type model towards text (called Query)). One of the particularities of the ATL language is its hybrid character (declarative and imperative). The declarative gives the possibility to directly correspond an element of the source metamodel of the transformation with an element of the target metamodel of the transformation. Indeed, the example of a completely declarative transformation in ATL is presented below. We describe a rule named Sample, for each InputM element of type InputElement that it identifies in the source model, creates an OutputM element of type OutputElement in a target model, and initializes the value of the attributeA attribute of OutputM with the value of the attributeB attribute of InputM.
Fig. 6. Transformation rule in ATL.
In ATL a transformation is called module. The keyword OUT shows the target meta-model (line 2). The key word IN shows the source meta-model (line 2). The transformation file's (Sample) rule (inModel2outModel) is declarative. And it is defined as follows:
- Sample is the name of the transformation rule.
- InputM is the name of the variable that in the body of the rule will represent the identified source element.
- OnputM is the name of the variable that in the body of the rule will represent the created target item.
- InputMetaModel (or OutputMetaModel) is the meta-model to which the source meta-model (or the target meta-model) of the transformation conforms.
- InputElement is the meta-class of the elements of the source model to which this rule will apply.
- OutputElement is the meta-class from which the rule will instantiate the target elements. The exclamation point allows to specify to which meta-model belongs a meta-class in case of homonymy.
- attributeA is an attribute of the meta-class OutputElement and its value is initialized using the value of the InputM attribute.
- attributeB, is an attribute of the meta-class InputElement. The use of ". ", From the OCL specification is resumed by ATL, to" navigate "in the models.
The imperative part of ATL completes these direct correspondences between elements. It contains conditional statements (if, then, else ... endif), variable declarations (let VarName: varType = initialValue), loop declarations (while (condition)? Do), and so on. Besides, this part allows to manipulate the elements generated by the declarative rules (modification of attributes, etc.). At the implementation level, an execution engine for the ATL language has been developed and it is available through the Eclipse M2M project. This execution engine is based on a virtual transformation machine [28].
5
VISUALIZATION
In this section, we detail a general methodology applicable to massive data visualization. This method leads us to modify the visualization pipeline that we have already proposed in our previous works [2,8] for the purpose of splitting it into two parts. The first includes the recalculation steps on the cloud and the second groups the steps performed on the visualization client.
5.1 Constraints and specific needs of a massive data visualization system
202
and processing of massive data have led to the emergence of new distributed infrastructures. The data to be visualized cannot easily leave these infrastructures. On the one hand, they are too large to be copied: even with the increase in network transfer speeds, the copying time of such a large amount of data remains prohibitive without providing a decisive advantage in the subsequent processing. On the other hand, raw data has become a valuable resource. Consequently, Holders of this new resource prefer to keep it within a controlled and secure infrastructure. The other problem with massive data visualization is computational performance. No calculation on the raw data can be done in real-time. Therefore, it is imperative to pre-calculate and index the data to speed up the subsequent steps. Taking into account the previous remarks, it is necessary to calculate a multiscale abstraction, which implies several calculation steps on all the data. Under these conditions, the use of computing and distributed storage capabilities offered by the Big Data infrastructure is essential, regardless of the initial location of the data. Visualization within a Big Data infrastructure implies an asymmetry of means. Indeed, the data are stored within a cluster of machines whose resources in computing power and RAM are limited only by the investment that is made. On the contrary, the visualization is done on a machine that is comparatively very limited in resources. We must find a way to reduce the amount of information to be transferred and represented. Here again, the use of a multiscale abstraction makes it possible to transfer only a part of the data. Ideally, the amount of data to be transferred must be very limited or even limited. This constraint joins the problem of occlusion. However, it is less strong since it is possible to start by transferring very little data and add detail later without blocking the visualization process. All these conditions for the implementation of a massive data visualization system may seem compelling as they go beyond the traditional framework of data visualization on a single client. It is also not direct to adapt known methods to integrate them in this context. Nevertheless, such a system based on remote viewing also represents a chance and offers many opportunities. For example, we can retain those described by Holliman & Watson [34]: the sharing of computing resources, the simplification of the client code, which facilitates its porting on new platforms and of course the scalability offered by the cloud. To these advantages, we will add the sharing of precalculations and results. All calculations done on the cloud can be kept and shared among users. Thus, even if the precalculation of a multi-scale abstraction of a large dataset requires several hours of computation, once this has been done, several users can benefit from it in a transparent manner, which makes it possible to amortize the cost in computing time per user.
5.2 Changing the Viewing Pipeline for Massive Data
The imbalance of resources between the Big Data infrastructure and the visualization client has repercussions on the visualization pipeline. The most expensive steps in time and / or in memory must be done in the cloud, while the others can be run on the client. Thus, the pipeline is separated into two: first the cloud part and then the client part. Depending on where the separation occurs, several types of pipeline for big data emerge. Firstly, the pixel and geometry oriented approaches proposed by Holliman and Watson [34]. We also propose our approach based on the use of a multiscale abstraction, which solves some of the problems related to
previous approaches. This figure shows the pipeline that we already detailed in our previous work [2]:
Raw data Processed data
Data of interest Geometric data Visualization (Image)
Data analysis Filtering Encodage
visuel Rendering
Interaction User
Fig. 7. The pipeline of visualization, adapted from [35]. In an interactive system, it can be executed many times per second.
5.2.1 Pixel-oriented pipeline
The pixel-oriented approach is as simple as possible. In this split, the entire pipeline runs in the cloud. The final image is then sent to the client for display. With this approach, rendering is done in the cloud, so there is no performance constraint for the client. However, this also implies that all interactions must be transmitted to the server to be processed and generate a new image that will be transmitted to the client. Therefore, all interactions require a round trip through the network, which increases their latency. Similarly, the bandwidth used is proportional to the resolution of the visualization. Sent images can be compressed, but this further increases latency. The simplicity of this approach makes it compatible with any visualization. Nonetheless, it ultimately provides nothing more than remote desktop sharing software as the role of the client is reduced to a screen on which display the final image transmitted to it.
5.2.2 Geometry oriented pipeline
The geometry-oriented approach operates to separate the pipeline further upstream. The cloud part is responsible for generating geometry, but more rendering. This step is provided by the customer who must have sufficient power to draw the geometry which is transmitted to him. This division of roles makes the client a little less dependent on the cloud part. Some interactions can be done without help from the server, which improves latency compared to the previous approach. However, the most complex interactions, which require data manipulation, still need to use the server. The bandwidth used by this approach is difficult to estimate since the amount of geometric data to be sent depends entirely on the application. This approach can be compared to client-server oriented rendering libraries, such as X11 and OpenGL [36].
5.2.3 Pipeline oriented data abstraction
data abstraction, it is possible to apply traditional visualization algorithms to the client. Thanks to the use of multi-scale abstraction, the client does not need to have a large computing capacity. To accommodate the less powerful devices, the level of abstraction to be used can be increased, that is, fewer data will be transferred. This approach is the most complete and the most flexible. This is the one we will use in our work.
Fig. 8. The visualization pipeline is modified to take into account the constraints to visualize massive data. The steps of the pipeline are now separated into two phases: the precalculation phase is done in the cloud while the visualization phase is done on a local machine and requires the transfer of some of the precomputed data.
6
MODEL
DRIVEN
VISUALIZATION
A graphical representation of statistical data or visualization of statistical data is a visual summary of the encrypted statistical data. It allows at a glance to grasp the general trend. Graphical representations of statistical data are also found in information and communication to the general public where they can influence the effectiveness and credibility of the message. From this point of view, it should be borne in mind that a graphic representation remains, in essence, a simplification of reality. The multiple parameters of graphical representation (scale, choice of coordinates, false colors, etc.) are all factors that may intentionally or unintentionally distort reality, for example by masking, distorting or minimizing important information. NICTs have developed these representations under the names of DataVisualisation or DataViz. These technologies allow today to visualize "virtually" data in space (three-dimensional computer graphics, video projection or laser projection on a "neutral" model, or visualization with 3D glasses, etc.). Our proposal aims to make the transition from one visual mode to another by applying techniques related to model engineering. The following figure shows our approach:
Fig. 9. MDV Architecture proposed.
For the purpose of doing this work, we rely on our first meta-modeling [2]. By using the ATL transformation language, we will make transformations of our meta-model to the destination meta-models [37], which presents the final visualization mode. Indeed, there are several visualization modes (Bar Chart, Circle Diagram, Point Cloud, Line, Bubble, Heatmap, etc.). However, we limit ourselves in our choice to: graphs, tree, and bar chart. We determine the meta-models defined for the modes of visualization chosen in our work. In short, Figure 9 watches summarizes the work we have done; Figure 9-B expresses the existence of a concrete viewer for each model. Eventually, we shall briefly present the major material used in this work. We used JFace from Eclipse for trees, lists, and tables. BIRT was used for reading graphics. We also used Zest [38] for the graph-based views, as well as a Google component for the geographic maps. After that, and in order to generate a view of a data model, we defined transformations thanks to the ATL transformation language [39]. These rules will be applied to the instance data (figure 9-D) by matching the elements of their corresponding data model (Figure 9-C). For the purpose of generating a view from a data model, the interaction designer selects the viewer and writes transformation rules to describe the view. The transformation rules are applied to the instance data (Figure 9-D) by matching the elements of their corresponding data model (Figure 9-C). After applying the transformation rules, the resulting dataset is introduced into the selected viewer. Then, the view can be automatically filled in with the results and displayed to the user.
The following fig shows the meta-model that we proposed for the visual mode of the trees:
204 Then we presented the meta-model that we proposed for
the visual mode of Map:
Fig. 11. Map viewer meta-model.
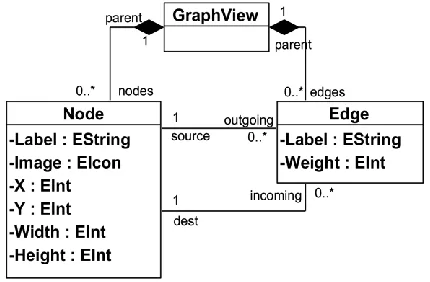
Finally, we present in this figure the last visual mode that we used:
Fig. 12. Meta-model for a GraphView.
7
TRANSFORMATIONS
As we have mentioned in the previous paragraphs, we used the ATL transformation language to perform transformations to pass instance data and present them as three visual modes.
Here is an excerpt from the ATL code that we defined for this reason:
Figure 13. ATL Transformation rules to Tree view.
Figure 14. ATL Transformation rules to Graph view.
8
EXPERIENCES
AND
EVALUATION
8.1 Configuration
In this section, we list the techniques we used to implement the approach presented in Figure 9. We used version 4.12 of the Eclipse IDE with the addition of Eclipse Modeling Framework (EMF) to draw the proposed meta-models. Version 4.1 of the ATL transformation language was used to define the transformation rules [40]. We defined three transformation rules: J2TreeView, J2MapView, and J2GraphView.
8.2 Experiences
To carry out our tests, we have created dozens of Ecore model instances on the Eclipse tool thanks to the EMF tool, which contains the generic Ecore instance editor. The purpose of using multiple instances of data is to better measure the execution time of transformations to the three visual modes chosen. The following table shows the execution time of ATL transformations:
TABLE1:TRANSFORMATIONS RUNTIME.
Transformation J2TreeView J2MapView J2GraphView Transformation time 313 1045 756
The results are shown in the following figure:
Fig. 15. Execution time for transformations.
9
CONCLUSION
(and others) interpret the data and the underlying questions. In this paper, we apply model engineering techniques to provide an approach to display data in multiple visual modes.
10
REFERENCES
[1] Allae Erraissi, Abdessamad Belangour, and Abderrahim Tragha, ―Digging into Hadoop-based Big Data Architectures,‖ Int. J. Comput. Sci. Issues IJCSI, vol. 14, no. 6, pp. 52–59, Nov. 2017. https://doi.org/10.20943/01201706.5259
[2] Erraissi, Allae, and Abdessamad Belangour. « Meta-Modeling of Big Data Visualization Layer Using On-Line Analytical Processing (OLAP) ». International Journal of Advanced Trends in Computer Science and Engineering 8, nᵒ 4, 990-98, 2019. https://doi.org/10.30534/ijatcse/2019/02842019. [3] Erraissi, A., & Belangour, A. Data sources and
ingestion big data layers: metamodeling of key concepts and features. International Journal of Engineering & Technology, 7(4), 3607–3612, 2018. https://doi.org/10.14419/ijet.v7i4.21742
[4] Erraissi, Allae, and Abdessamad Belangour. « Hadoop Storage Big Data Layer: Meta-Modeling of Key Concepts and Features ». International Journal of Advanced Trends in Computer Science and Engineering 8, nᵒ 3, 646-53, 2019. https://doi.org/10.30534/ijatcse/2019/49832019 [5] A., Erraissi A., Belangour A. Capturing Hadoop
Storage Big Data Layer Meta-Concepts. In: Ezziyyani M. (eds) Advanced Intelligent Systems for Sustainable Development (AI2SD’2018). AI2SD 2018. Advances in Intelligent Systems and Computing, vol 915. Springer, Cham, 2019. https://doi.org/10.1007/978-3-030-11928-7_37
[6] Erraissi and A. Belangour, "Meta-modeling of Zookeeper and MapReduce processing," 2018 International Conference on Electronics, Control, Optimization and Computer Science (ICECOCS), Kenitra, Morocco, pp. 1-5, 2018. https://doi.org/10.1109/ICECOCS.2018.8610630 [7] Erraissi, Allae, and Abdessamad Belangour. «
Meta-Modeling of Big Data Management Layer ». International Journal of Emerging Trends in Engineering Research 7, no 7, 36-43, 2019. https://doi.org/10.30534/ijeter/2019/01772019.
[8] Erraissi, B. Mouad and A. Belangour, "A Big Data visualization layer meta-model proposition," 2019 8th International Conference on Modeling Simulation and Applied Optimization (ICMSAO), Manama, Bahrain, 2019, pp. 1-5. doi: 10.1109/ICMSAO.2019.8880276 [9] Erraissi Allae, et Abdessamad Belangour. « A Big
Data Security Layer Meta-Model Proposition ». Advances in Science, Technology and Engineering Systems Journal 4, nᵒ 5 (2019).
https://doi.org/10.25046/aj040553.
[10]Steven P. Reiss. A Visual Query Language for Software Visualization. In Proceedings of the IEEE 2002 Symposia on Human Centric Computing Languages and Environments (HCC’02), pages 80– 82, 2002.
[11]Mariano P. Consens and Alberto O. Mendelzon. GraphLog: a Visual Formalism for Real Life Recursion. In Symposium on Principles of Database
Systems, pages 404–416, 1990.
[12]Mariano Consens, Alberto Mendelzon, and Arthur Ryman. Visualizing and Querying Software Structures. In Proc of International Conference on Software Engineering, 1992.
[13]Steven P. Reiss. An Overview of Bloom. In Proceedings of the 2001 ACM SIGPLANSIGSOFT workshop on Program analysis for software tools and engineering, pages 2–5, 2001.
[14]James R. Cordy and T. C. Nicholas Graham. GVL: A Graphical, Functional Language for the Specification of Output in Programming Languages. In ICCL, pages 11–22, 1990.
[15]Jock Mackinlay. Automating the Design of Graphical Presentations of Relational Information. ACM Transactions on Graphics, 5(2):110–141, April 1986. [16]The Graphical Modeling Framework.
http://www.eclipse.org/gmf.
[17]The Business Integration and Reporting Toolkit. http://www.eclipse.org/birt.
[18]Frank Budinsky, David Steinberg, Ed Merks, Raymond Ellersick, and Timothy J. Grose. Eclipse Modeling Framework. Addison Wesley, 2003. http://www.eclipse.org/emf.
[19]Kleppe, Anneke G., et al. MDA explained: the model driven architecture: practice and promise. Addison-Wesley Professional, 2003.
[20]Systems modeling language, version 1.6. October
2018. URL
https://www.omg.org/spec/SysML/1.6/Beta1/PDF. [21]Jean BÉZIVIN, Model-driven engineering: Principles,
scope, deployment and applicability. In Proceedings of 2005 Summer School on Generative and Transformation Techniques in Software Engineering, 2005.
[22]Anneke G. KLEPPE, Jos WARMER et Wim BAST: MDA Explained : The Model Driven Architecture : Practice and Promise. Addison-Wesley Longman Publishing Co., Inc., Boston, MA, USA, 2003a. ISBN 032119442X.
[23]Jean BÉZIVIN, In Search of a Basic Principle for Model Driven Engineering. UPGRADE – The European Journal for the Informatics Professional, 5(2):21–24, 2004b.
[24]Tom MENS, Krzysztof CZARNECKI and Pieter Van GORP: A taxonomy of model transformation. Dans Proc. Dagstuhl Seminar on "Language Engineering for Model-Driven Software Development". Internationales Begegnungs- und Forschungszentrum (IBFI), Schloss Dagstuhl. Electronic, 2005.
[25]Krzysztof CZARNECKI and Simon HELSEN, Classification of model transformation approaches. Dans Proceedings of the OOPSLA’03 Workshop on the Generative Techniques in the Context Of Model-Driven Architecture, Anaheim, California, USA, 2003. [26]Sendall, Shane, and Wojtek Kozaczynski. "Model
transformation: The heart and soul of model-driven software development." IEEE software 20.5 (2003): 42-45.
206
[28]Mtsweni, Jabu. "Exploiting UML and acceleo for developing semantic web services." 2012 International Conference for Internet Technology and Secured Transactions. IEEE, 2012.
[29]Taentzer, Gabriele, Dirk Müller, and Tom Mens. "Specifying domain-specific refactorings for andromda based on graph transformation." International Symposium on Applications of Graph Transformations with Industrial Relevance. Springer, Berlin, Heidelberg, 2007.
[30]QVT: Meta object facility (mof) 2.0 query/view/transformation, v1.3. June 2016. URL https://www.omg.org/spec/QVT/1.3/PDF.
[31]Frédéric JOUAULT and Ivan KURTEV, On the architectural alignment of atl and qvt. Dans Proceedings of the 2006 ACM symposium on Applied computing, SAC ’06, pages 1188–1195, New York, NY, USA, 2006a. ACM. ISBN 1-59593-108-2.
[32]Jouault, Frédéric, et al. "ATL: A model transformation tool." Science of computer programming 72.1-2 (2008): 31-39.
[33]T. MUNZNER. Visualization analysis and design. CRC Press, 2014.
[34]N. HOLLIMAN and P. WATSON. « Scalable Real-Time Visualization Using the Cloud ». IEEE Cloud Computing 2.6 (2015), p. 90–96.
[35]V. D. BLONDEL, J.-L. GUILLAUME, R. LAMBIOTTE et E. LEFEBVRE. « Fast unfolding of communities in large networks ». Journal of statistical mechanics: theory and experiment 2008.10 (2008), P10008. [36]Woo, Mason, et al. OpenGL programming guide: the
official guide to learning OpenGL, version 1.2. Addison-Wesley Longman Publishing Co., Inc., 1999. [37]Fatima Kalna, Allae Erraissi, Mouad Banane,
Belangour ―A Scalable Business Intelligence Decision-Making System in The Era of Big Data‖ International Journal of Innovative Technology and Exploring Engineering 2019. https://doi.org/10.35940/ijitee.L3251.1081219
[38]R. Ian Bull, Casey Best, and Margaret-Anne Storey. Advanced Widgets for Eclipse. In Proceedings of 2nd workshop on Eclipse Technology Exchange, pages 6– 11, 2004.
[39]M. Banane, A. Erraissi and A. Belangour, "SPARQL2Hive: An approach to processing SPARQL queries on Hive based on meta-models," 2019 8th International Conference on Modeling Simulation and Applied Optimization (ICMSAO), Manama, Bahrain, 2019, pp. 1-5. doi: 10.1109/ICMSAO.2019.8880393 [40]Fatima kalna, Mouad Banane, Abdessamad
![Fig. 1 . MDA Model Levels [19].](https://thumb-us.123doks.com/thumbv2/123dok_us/8621042.1410750/2.612.119.231.404.621/fig-mda-model-levels.webp)
![Fig. 3 . Model to model transformation [27].](https://thumb-us.123doks.com/thumbv2/123dok_us/8621042.1410750/3.612.38.301.308.438/fig-model-model-transformation.webp)
![Fig. 5 . QVT standard architecture [30].](https://thumb-us.123doks.com/thumbv2/123dok_us/8621042.1410750/4.612.42.288.58.177/fig-qvt-standard-architecture.webp)
![Fig. 7 . The pipeline of visualization, adapted from [35]. In an interactive system, it can be executed many times per second](https://thumb-us.123doks.com/thumbv2/123dok_us/8621042.1410750/5.612.339.549.89.191/fig-pipeline-visualization-adapted-interactive-executed-times-second.webp)