Modeling the Nonlinear Behavior of Macro Fiber Composite
Actuators
Michael Stuebner
a, Ralph C. Smith
a, Michael Hays
band William S. Oates
ba
Dept. of Math., Center for Research in Scientific Comp., NCSU, Raleigh, NC 27695, USA,
bDepartment of Mechanical Engineering, Florida State University, Tallahassee, FL 32306, USA
ABSTRACT
Macro Fiber Composites (MFC) are planar actuators comprised of PZT fibers embedded in an epoxy matrix that is sandwiched between electrodes. Due to their construction, they exhibit significant durability and flexibility in addition to being lightweight and providing broadband inputs. They are presently being considered for a range of applications including positioning and control of membrane mirrors and configurable aerospace structures. However, they also exhibit hysteresis and constitutive nonlinearities that must be incorporated in models to achieve the full potential of the devices. In this paper, we discuss the development of a model that quantifies the hysteresis and constitutive nonlinearities in a manner that promotes subsequent control design. The constitutive model is constructed using the homogenized energy framework for ferroelectric hysteresis and used to develop resulting system models. The performance of the models is validated with experimental data.
Keywords: Nonlinear piezoelectric model, macro fiber composite.
1. INTRODUCTION
The Macro Fiber Composite (MFC), developed at NASA Langley Research Center, has made it possible to obtain strains and displacements greater than those that could be generated by prior actuators. It consists of active fiber unidirectional piezoceramic fibers embedded in an adhesive polymer matrix and an interdigitated electrode pattern on polyimide films at top and bottom. A detailed overview of the manufacturing process is presented by Williams et al.4 Due to its flexibility it can be easily bonded to structures and used to apply or detect strains. The MFC is found in a wide variety of applications such as drag, vibration, noise reduction and structural health monitoring. It has significant potential for improving the performance of aerospace structures like rotor blades, jet tailfins and telecommunication satellites.
Since its first fabrication an increasing number of investigations focusing on the behavior of the MFC has been accomplished. In,6 Williams, Inman and Wilkie present the response of the MFC to increasing voltage and a model for a piezoelectric continuum subjected to an increase in electric field under constant mechanical load is developed. The same authors discuss in5 the modeling of the coefficients of thermal expansion for the Macro Fiber Composite actuator as a function of temperature. Nonlinearities in the tensile and shear behavior are investigated by Williams et al.7 In this work the nonlinear tensile and shear stress-strain behavior and Poisson effects using various plastic deformation models are characterized.
In this paper we investigate the response of a cantilever beam driven by a MFC actuator patch. The homogenized energy model (HEM) is used to describe the nonlinear relationship between the electric field applied at the patch and the resulting polarization. It is a multiscale approach in which mesoscopic behavior is quantified by energy principles and a macroscopic model is subsequently constructed using stochastic homogenization techniques. The model was chosen due to its capability for characterizing a range of minor loop behavior under highly varied operating conditions. An Euler-Bernoulli beam model is used to characterize the behavior of the cantilever. Optimization routines are employed to identify parameters needed for the model. The displacement
Further author information: (Send correspondence to Michael Stuebner.) Michael Stuebner: E-mail: [email protected], Telephone: 919-513-2287 Ralph C. Smith: E-mail: [email protected], Telephone: 919-515-7552 Michael Hays: E-mail: [email protected]
of the beam as a response to different input voltages at the patch is computed by the model. The numerical simulations are compared to experimental data.
A short description of the homogenized energy model and its use to construct a discretized PDE model for a vibrating beam is provided in Sections 2 and 3. In Section 4, the experimental setup is described. In Section 5 the beam model with polarization quantified by the homogenized energy model is compared with the experimental data. It is illustrated that the model accurately quantifies the nonlinear behavior of the MFC patch in phase space as well as time and frequency domain.
2. HOMOGENIZED ENERGY MODEL
The homogenized energy model for ferroic materials is a multiscale approach based on energy relations and stochastic homogenization techniques. For ferroelectric materials, the macroscopic model quantifies the bulk polarizationP via the relation
[P(E)](t) =
∞ Z
0
∞ Z
−∞
ν1(Ec)ν2(EI)[ ¯P(E+EI;Ec, ξ)](t)dEIdEc (1)
where E is the applied electric field, EI is the field due to dipole interactions,Ec is the coercive field value at
which the dipoles switch orientation, andξdenotes the initial distribution of dipoles. The model parametersEc
andEI vary through the material and have associated densitiesν1 andν2. Details regarding the model can be found in Smith.3
The integrals in (1) are numerically approximated using quadrature formulas to yield the discrete relation
[P(E)](t) =
Ni
X
i=1
Nj
X
j=1
ν1(Ec)ν2(EI)[ ¯P(E+EI;Ec, ξ)](t)viwj (2)
whereEIj,Ecidenote the points associated with the quadrature formulas andvi,wj are the quadrature weights. For the density of the coercive field, one could choose a lognormal distribution
ν1(Ec) =
1
s√2πEc
exp
−(lnEc−m)
2
2s2
(3)
where the parametersand the modemare given in terms of standard deviationcand mean ¯Ec
s =
s
ln
1 + c 2 ¯
E2
c
(4)
m = ln ¯Ec−
1 2ln
1 + c 2 ¯
E2
c
. (5)
A choice for the distribution of the density of the interaction field is the Gaussian relation
ν2(Ei) =
1
s√2πexp
−E
2
i
2b2
. (6)
More general choices for the densities can be found in Smith.3
The kernel ¯P is modeled via energy principles. For negligible thermal relaxation, direct minimization of the Gibbs energy yields the kernel relation
¯
P(E) = 1
ηE+PRδ(E;Ec, EI), (7)
where PR is the remanence polarization and δ = 1 if dipoles are positively oriented and δ = −1 if they are
If thermal relaxation mechanisms are considered, one has to include the effects of thermal activation. This can be done by balancing the Gibbs energy with the relative thermal energy through the Boltzmann relation
µ(G) =Cexp
−GVkT
(8)
wherekis Boltzmann’s constant,T is the temperature of the material andV is a reference volume. The resulting kernel is then given by
¯
P =x+hP+i+x−hP−i. (9)
The evolution of dipole fractions is quantified by the differential equations
˙
x+ = −p+−x++p−+x− (10)
˙
x− = −p−+x−+p+−x+ (11)
wherehP+iand hP−iare the expected polarizations andp+− andp−+ the transition likelihoods which include the material and temperature dependent relaxation timeτ. These quantities can be expressed in terms of error functions. For detailed expressions and implementation of the thermally relaxed model, see Braun and Smith.1
For negligible relaxation the model is characterized by the five parameters η, ¯Ec, Pr, c and b. If thermal
relaxation is included, there are the additional two parametersτ andγ= V
kT, the inverse thermal energy.
3. BEAM MODEL
The relation (1) quantifies the polarizationPas a function of the input fieldE. In this section, we summarize how this can be used to develop a dynamic model of an Euler-Bernoulli beam driven by surface mounted piezoceramic patches.
Motivated by the experimental setup details in Section 4, we consider a thin cantilever beam of length ℓ, widthband thicknesshthat is clamped atx= 0 and free atx=ℓ. We letρ, Y I, cIandγrespectively denote the effective linear density, stiffness, Kelvin-Voigt damping and air damping coefficients and we letw(t, x) denote the transverse displacement of the beam. The region covered by the patch is designated by [x1, x2]. The following model is detailed in Chapter 7 of Smith.3
Force and moment balancing yield the strong model formulation
ρ∂
2w
∂t2 +γ
∂w
∂t −
∂2M
∂x2 = 0
w(t,0) = ∂w
∂x(t,0) = 0
M(t, ℓ) = ∂M
∂x (t, ℓ) = 0
w(0, x) =w0(x) ,
∂w
∂t(0, x) =w1(x)
(12)
where the moment is
M(t, x) =−Y I∂
2w
dx2 −cI
∂3w
dx2∂t+k1[P(E(t))−PR]χpe(x).
HereP is quantified by (1) and the characteristic function
χpe(x) =
(
1 , x∈[x1, x2]
0 , x∈[0, x1)∪(x2, ℓ],
To facilitate analysis and numerical implementation, we employ the resulting weak formulation
Z ℓ
0
ρ∂
2w
∂t2φ dx+
Z ℓ
0
γ∂w
∂tφ dx+
Z ℓ
0
Y I∂
2w
∂x2
d2φ
dx2 dx+
Z ℓ
0
cI ∂
3w
∂x2∂t
d2φ
dx2dx
=k1[P(E(t))−PR]
Z x2
x1
d2φ
dx2 dx
(13)
which must hold for allφ∈H2 0(0, ℓ)
The solutions to (13) are approximated using the techniques detailed in Chapter 8 of.3 Specifically, we consider approximate solutions of the form
wN(t, x) =
N+1
X
j=1
wj(t)φj(x)
where φj(x) are cubic B-splines modified to satisfy the essential boundary condition atx= 0. Use of the basis
functions as test functions yields the semi-discrete system
Mw¨ +Qw˙ +Kw=k1[P(E(t)−PR]b (14)
where
w(t) = [w1(t), . . . , wN+1(t)]
T
. (15)
The mass, damping and stiffness matrices are defined by
[M]ij =
Z ℓ
0
ρφiφjdx
[Q]ij =
Z ℓ
0
γφiφj+cIφ
′′ iφ ′′ j dx
[K]ij =
Z ℓ
0
Y Iφ′′
iφ
′′
jdx
(16)
whereas the force vector has the components
[b]i=
Z x2
x1
φ′′
idx. (17)
To formulate a first-order semi-discrete system that facilitates implementation using standard ODE routines, we letz= [w,w˙ ]T and define the system matrix Aand the vectorBby
A=
"
0 I
−M−1K
−M−1Q
#
, B=
"
0 M−1b
#
. (18)
The second-order system (14) can subsequently be reformulated as
˙
z(t) =Az(t) +k1[P(E(t))−PR]B
z(0) =z0
(19)
4. EXPERIMENTAL SETUP
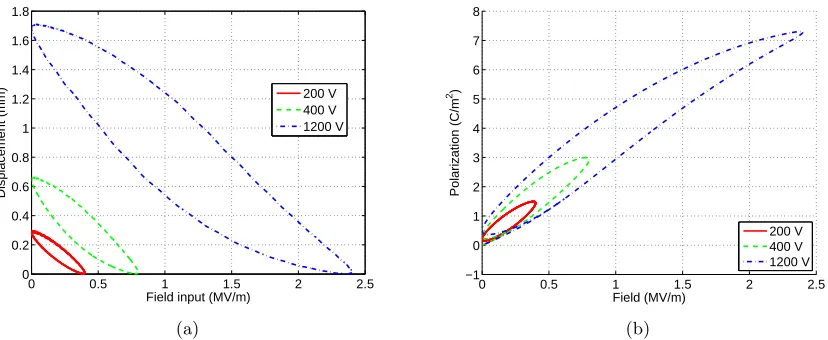
In the experimental setup, an aluminum cantilever was compressed between two aluminum blocks for full rigidity. The beam is 114 mm long, 25.4 mm wide and 1 mm thick. At one side, a Macro Fiber Composite actuator of type M-4010-P12 with lateral, expanding motion was attached. The driving patch has the same width as the beam and covered the region from 25–50 mm measured from the fixed end. In three experiments, an input voltage in the range of 0–200 VDC, 0–400 VDC, and 0–1200 VDC was applied. The driving frequency was 1 Hz so that the input can be represented by the equations
E(t) = 200 + 200 sin(1·2π·t) (20)
E(t) = 400 + 400 sin(1·2π·t) (21)
E(t) = 1200 + 1200 sin(1·2π·t). (22)
The displacement was measured at a capacitor probe ¯x= 70 mm away from the fixed end. Plots of the obtained displacement–field data are shown in Figure 1(a).
5. VALIDATION RESULTS
For experimental data with input voltage 0–200 VDC, parameters for the homogenized energy model were identified. The identification process yields the minimization problem
min
p N
X
i=1
|wN(ti,x¯;p)−wˆ(ti)|2 (23)
wherepare the parameters,wN(t
i,x¯;p) is the displacement computed by the model depending on the parameters
and ˆw(ti) is the experimental data. The obtained parameter values are shown in Table 1. They are used to
predict the experimental data for the other two cases.
Table 1. Parameters identified through a fit to the 200 V data.
η Pr E¯c c b γ τ
1500.0m A 8.0
C m2 70.0
MV m 60.0
MV
m 1800.0 MV
m 6.0 m2
N 2.0s
With these parameters the resulting polarization–field hysteresis loops for the input voltages (20)–(22) are computed and shown in Figure 1(b).
0 0.5 1 1.5 2 2.5
0 0.2 0.4 0.6 0.8 1 1.2 1.4 1.6 1.8
Field input (MV/m)
Displacement (mm)
200 V 400 V 1200 V
(a)
0 0.5 1 1.5 2 2.5
−1 0 1 2 3 4 5 6 7 8
Field (MV/m)
Polarization (C/m
2)
200 V 400 V 1200 V
(b)
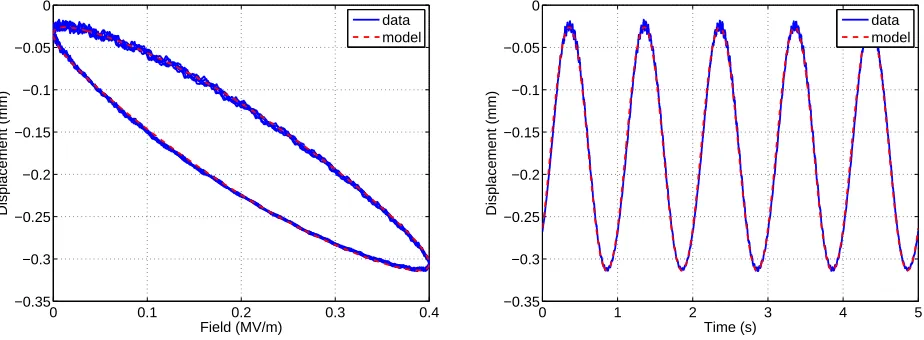
Figures 2, 3 and 4 show a comparison of the resulting numerical fits and predictions and the experimental data. Due to the fact that the case of 200 VDC was used to obtain the model parameters the fit of the model to the data is very close. The two other cases show good predictions.
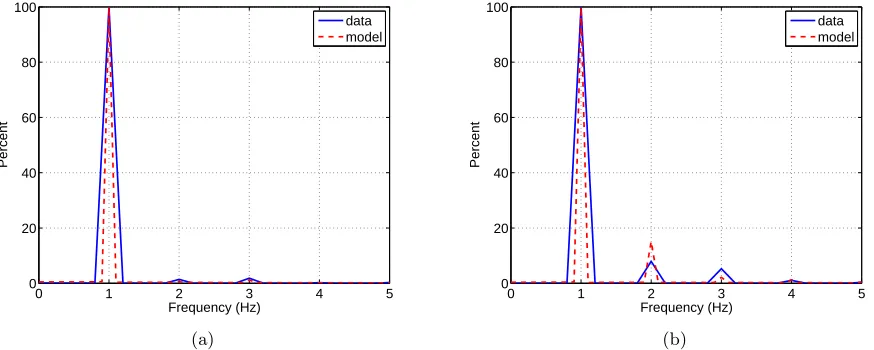
Figures 5(a) and 5(b) show the frequency response for two cases. In the 200 VDC case there are almost no higher harmonics in the data which is also represented by the model. In the case of 1200 VDC the data shows higher harmonics and also the model predicts a second and third harmonics.
0 0.1 0.2 0.3 0.4
−0.35 −0.3 −0.25 −0.2 −0.15 −0.1 −0.05 0
Field (MV/m)
Displacement (mm)
data model
0 1 2 3 4 5
−0.35 −0.3 −0.25 −0.2 −0.15 −0.1 −0.05 0
Time (s)
Displacement (mm)
data model
Figure 2. Comparison of experimental data and model fit for 200 V input.
0 0.2 0.4 0.6 0.8
−0.8 −0.7 −0.6 −0.5 −0.4 −0.3 −0.2 −0.1 0
Field (MV/m)
Displacement (mm)
data model
0 1 2 3 4 5
−0.8 −0.7 −0.6 −0.5 −0.4 −0.3 −0.2 −0.1 0
Time (s)
Displacement (mm)
data model
Figure 3. Comparison of experimental data and model prediction for 400 V input.
6. CONCLUSIONS
0 0.5 1 1.5 2 2.5 −2
−1.5 −1 −0.5 0
Field (MV/m)
Displacement (mm)
data model
0 1 2 3 4 5
−2 −1.5 −1 −0.5 0
Time (s)
Displacement (mm)
data model
Figure 4. Comparison of experimental data and model prediction for 1200 V input.
ACKNOWLEDGMENTS
The research of MS was supported through the NSF Grant DMS-0636590, EMSW21- RTG program while the research of RCS was supported in part by the Air Force Office of Scientific Research through the grant AFOSR-FA9550-08-1-0348. The research of MH and WSO is supported through the Air Force Office of Scientific Research STTR Phase I program.
REFERENCES
1. T. R. Braun and R. C. Smith. High Speed Model Implementation and Inversion Techniques for Ferroelectric and Ferromagnetic Transducers. J. of Intelligent Material Systems and Structures, 2008. published online on 04/21/2008.
2. Smart Material. http://www.smartmaterial.us.
3. R. C. Smith. Smart Material Systems – Model Development. SIAM, Philadelphia, 2005.
4. R. B. Williams, B. W. Grimsley, D. J. Inman, and W. K. Wilkie. Manufacturing and Mechanics-Based Characterization of Macro Fiber Composite Actuators. In Proceedings of the 2002 ASME International
Adaptive Structures and Materials Systems Symposium, New Orleans, LA, November 17–22 2002.
0 1 2 3 4 5
0 20 40 60 80 100
Frequency (Hz)
Percent
data model
(a)
0 1 2 3 4 5
0 20 40 60 80 100
Frequency (Hz)
Percent
data model
(b)
5. R. B. Williams, D. J. Inman, and W. K. Wilkie. Temperature-Dependent Coefficients of Thermal Expansion for Macro Fiber Composite Actuators. InProceedings of the 5th International Congress on Thermal Stresses, Blacksburg, VA, June 8–11 2003.
6. R. B. Williams, D. J. Inman, and W. K. Wilkie. Nonlinear Response of the Macro Fiber Composite Actuator to Monotonically Increasing Excitation Voltage. J. of Intelligent Material Systems and Structures, 17:601– 608, 2006.