ISSN(Online): 2319-8753 ISSN (Print) : 2347-6710
I
nternational
J
ournal of
I
nnovative
R
esearch in
S
cience,
E
ngineering and
T
echnology
(An ISO 3297: 2007 Certified Organization)
Vol. 5, Issue 6, June 2016
Estimation of Shear Wave Velocity Using
Correlations
Pranav Badrakia
P.G. Student, Department of Civil Engineering, Maharashtra Institute of Technology, Pune, Maharashtra, India1
ABSTRACT: Shear wave velocity is an important parameter in seismic hazard analysis and is related to the amplification of the ground during an earthquake. Site classification is based on the top 30 m shear wave velocity which is an important parameter in site response studies. The shear wave velocity profile is usually obtained using various geophysical tests. But it is not economically feasible to conduct these tests at all sites in India. Therefore this paper highlights the methods for evaluating shear wave velocity, from more common field tests that are popularly conducted in India, after reviewing published correlations.
KEYWORDS: Correlations, Shear wave velocity, Site classification, Vs 30.
I. INTRODUCTION
Shear wave velocity (Vs) is one of the most important input parameter to represent the stiffness of the soil layers [1].
During an earthquake most damage is caused by ground shaking amplified by the local site effects, which are based on geotechnical properties of the soil. Shear wave velocity is an important parameter in dynamic site response studies and site characterization. The average shear wave velocity at the top 30m (Vs30) is used for seismic site classification as per
Caltrans seismic design criteria [2]. Similar classifications are recommended by National Earthquake Hazard Reduction Program [3] and California building code [4].
Shear wave velocity can be directly measured in field through a number of geophysical methods such as seismic refraction, Spectral Analysis of surface Waves (SASW) or Multichannel Analysis of Surface Waves (MASW). However it is not always economically feasible to conduct these tests at all locations. Hence it would be beneficial to estimate the shear wave velocity using empirical correlations between Vs and commonly conducted geotechnical tests in India. Some of these tests are Standard Penetration Test (SPT), Cone Penetration test (CPT) and Unconfined compression test. The penetration tests have been widely accepted in India as routine tests in geotechnical site investigation and abundant SPT data is available [1]. Shear wave velocity (Vs) is related to the shear modulus (G) as
shown in equation (1).
G = ρ . Vs2 (1)
This paper presents a review of published correlations between shear wave velocity and variables, such as Standard penetration test N values, cone penetration resistance and undrained shear strength.
II. CORRELATIONS WITH SPTN VALUES
Standard Penetration Test is the most commonly used geotechnical test in India. Many researchers have studied the relation between shear wave velocity and SPT N values. Seed et al. [5] developed a relation between Gmax and SPT N
value for sands and from that, proposed an equation (2) for estimating Vs from SPT N value.
Vs = 56 N0.5 (m/s) (2)
ISSN(Online): 2319-8753 ISSN (Print) : 2347-6710
I
nternational
J
ournal of
I
nnovative
R
esearch in
S
cience,
E
ngineering and
T
echnology
(An ISO 3297: 2007 Certified Organization)
Vol. 5, Issue 6, June 2016
SPT and experimental dispersion curves from SASW testing.Fig. 1 shows the regression analysis for all soils. The coefficient of determination (R2) is 0.95 which is a good fit as seen in the figure. N values up to 50 were considered in analysis. Also there is a good density of data pairs.
Vs = 79.0 N0.434 m/s (for sand) (3)
Vs = 86.0 N0.42 m/s (for silty sand/ sandy silt) (4)
Vs = 82.6 N0.43 m/s (for all soils) (5)
Figure 1: Vs versus SPT N value for all soils (Hanumanthrao et al. [6])
Maheshwari et al. [1] developed empirical equations between Vs and SPT N values for different categories of soil in
Chennai city. MASW test was carried out to determine the shear wave velocity profile and 200 data pairs were used for regression analysis to develop the correlations. The correlations were developed for clay, sand and all soils given in equations (6), (7) and (8) respectively.Further the researchers also developed correlations between corrected N values and Vs and it was found that both corrected and uncorrected N values can predict Vs with equal accuracy. Figure 2 shows the correlation between SPT N values and Vs for all soils, the coefficient of determination (R2) is 0.82
and N values up to 95 are considered. The rate of increase of Vs is higher for lower N values.
Vs = 89.31 N0.358m/s (Clay) (6)
Vs = 100.53 N0.265m/s (Sand) (7)
Vs = 95.64 N0.301m/s (All soils) (8)
Anbazhagan and Sitharam [7] developed a correlation between SPT corrected N value ((N1)60cs) and Vsby collecting
ISSN(Online): 2319-8753 ISSN (Print) : 2347-6710
I
nternational
J
ournal of
I
nnovative
R
esearch in
S
cience,
E
ngineering and
T
echnology
(An ISO 3297: 2007 Certified Organization)
Vol. 5, Issue 6, June 2016
Vs = 78 [(N1)60cs] 0.40 (9)
Figure 2: Vsversus SPT N for all soils (Maheshwari et al. [1])
The regression analysis is shown graphically in figure 3, where the coefficient of determination obtained was 0.84.There is a considerable scatter above and below the fitted line. The N values up to 85 were considered in this study.
ISSN(Online): 2319-8753 ISSN (Print) : 2347-6710
I
nternational
J
ournal of
I
nnovative
R
esearch in
S
cience,
E
ngineering and
T
echnology
(An ISO 3297: 2007 Certified Organization)
Vol. 5, Issue 6, June 2016
Sil and Sitharam [8] developed correlation between Vs and SPT N values for the city of Agratala. Shear wave velocity
profile was developed by conducting MASW tests at 27 locations and SPT data was collected from Urban Development Department, Govt. of Tripura. Correlations were developed based on both corrected and uncorrected SPT values as shown in equations (10) and (11). Figure 4 (a) and 4 (b) show the regression analysis for corrected N value and uncorrected N value respectively, where coefficient of determination for corrected N values is higher, R2 = 0.72, than that of uncorrected N values, R2 = 0.65. The dotted lines above and below the line of fit show the trend for ± standard deviation.
Vs = 116 Nc0.27 (Corrected SPT-N) (10)
Vs = 123 N0.22(Uncorrected SPT-N) (11)
(a) (b)
Figure 4: Vs versus SPT N (a) corrected N values (b) uncorrected N values (Sil and Sitharam [8])
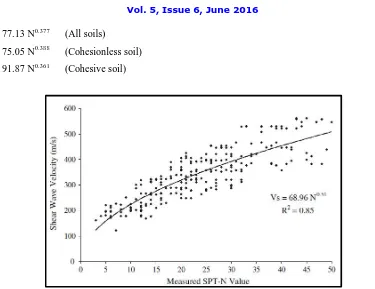
Anbazhagan et al. [9] developed a correlation between SPT N value and shear wave velocity for Lucknow city. Shear wave velocity was measured through MASW test. A total of 17 MASW and SPT tests were used for regression analysis. Correlations were developed for different soil types namely clayey, sandy and all types which are given in equations (12), (13) and (14). Figure 5 shows the graphical validation of the regression analysis for all soils, the R2 value obtained was 0.85 and the SPT N values up to 50 were considered. There also is a higher deviation of data pairs for higher SPT N values and Vs compared to lower values.
Vs = 106.63 N 0.39 (Clay) (12)
Vs = 60.17 N 0.56 (Sand) (13)
Vs = 68.96 N 0.51 (All soils) (14)
Marto et al. [10] developed a universal correlation between shear wave velocity and SPT N values. A total of 60 global correlations were used to formulate a new universal correlation. Two types of equations were developed viz. without outliner boundary and with outliner boundary of ± standard deviation. The correlationswithout outliner for all soils, cohesionless soils and cohesive soils are given in equations (15), (16) and (17) respectively.
Vs = 69.79 N0.401 (All soil) (15)
Vs = 66.56 N0.420 (Cohesionless soil) (16)
Vs = 87.72 N0.361 (Cohesive soil) (17)
ISSN(Online): 2319-8753 ISSN (Print) : 2347-6710
I
nternational
J
ournal of
I
nnovative
R
esearch in
S
cience,
E
ngineering and
T
echnology
(An ISO 3297: 2007 Certified Organization)
Vol. 5, Issue 6, June 2016
Vs = 77.13 N0.377 (All soils) (18)
Vs = 75.05 N0.388 (Cohesionless soil) (19)
Vs = 91.87 N0.361 (Cohesive soil) (20)
Figure 5: Vs versus SPT N value for all soils (Anbazhagan et al. [9])
The graphical correlation for all soils with and without outliner boundaries is shown in figure 6 (a) and 6 (b) respectively. The R2 value is much higher with outliner, i.e. 0.876 as compared to without outliner, which is 0.624. Thus SPT N values above 50 were not considered in the analysis.
Figure 6: Vs versus SPT N value for all soil types (a) with outliner (b) without outliner (Marto et al. [10])
III.CORRELATIONS WITH CONE PENETRATION TEST RESULTS
ISSN(Online): 2319-8753 ISSN (Print) : 2347-6710
I
nternational
J
ournal of
I
nnovative
R
esearch in
S
cience,
E
ngineering and
T
echnology
(An ISO 3297: 2007 Certified Organization)
Vol. 5, Issue 6, June 2016
clay structure. The relation obtained between cone tip resistance (qc) and shear wave velocity (Vs) is given in equation
(21).
Vs = 1.75 (qc) 0.627 (21)
Robertson [12] developed a correlation between Vs and CPT by using approximately 1035 data pairs. The correlation is
as shown in equation (22)
Vs = [αvs (qt – σv)/pa] 0.5 (22)
Where, αvs is the shear wave velocity cone factor calculated from equation (23), qt is the corrected cone tip resistance in kPa, σv is the total overburden pressure in kPa and pa is the atmospheric pressure in the same units.
αvs=10(0.55 Ic + 1.68) (23)
Ic is the soil behaviour type index [13] which is based on the normalized tip resistance (Q) and normalized friction ratio
(F).
Ic = [(3.47-logQt) 2 + (log Fr + 1.22)2]0.5 (24)
Qt and Fr are normalized cone parameters given in equations (25) and (26). Where, σ’v is effective overburden pressure
in kPa and fs is the sleeve friction in kPa. The corrected cone tip resistance can be calculated from equation (27).
Qt = (qt – σv) / σ’v (25)
Fr = [fs (qt – σv)] 100 % (26)
qt = qc + (1-an).u2 (27)
IV.CORRELATIONS WITH SHEAR STRENGTH
Laboratory tests such as unconfined compression test and triaxial tests are conducted on undisturbed soil samples obtained from boreholes. Undrained shear strength obtained from these tests can be used to estimate the shear wave velocity. Dickenson [14] proposed a correlation between undrained shear strength (Su) and shear wave velocity given in
equation (28).
Figure 7: Vs versus Su for cohesive soils (Dickenson [14])
Vs = 18 (Su) 0.475 (28)
Where, Vs is in ft/sec and Su is measured in psf. The correlation was developed for four types of cohesive soil viz.
ISSN(Online): 2319-8753 ISSN (Print) : 2347-6710
I
nternational
J
ournal of
I
nnovative
R
esearch in
S
cience,
E
ngineering and
T
echnology
(An ISO 3297: 2007 Certified Organization)
Vol. 5, Issue 6, June 2016
Figure 7 shows the shear wave velocity (Vs) versus Shear strength(Su), there are more data pairs for lower values of
Vs and Su. The Bay mud data pairs have lower Vs and Su values and Alameda formation data pairs have higher values.
It must be noted that in this figure the shear wave velocity is measured in foot per second (fps) and the shear strength is measured in pounds per square foot (psf).
V. CONCLUSION
Many equations are available to estimate shear wave velocity from SPT N values. Both corrected and uncorrected N values can be used to predict Vs with equal accuracy. However care must be taken to use the correct equation according
to the soil type. To estimate Vs from CPT data for all soils, equation given by Robertson [12] may be used. To estimate
Vs from shear strength, equation from Dickenson [14] should be used only for cohesive soils that are similar to the four
soil types used in the development of correlations, otherwise site specific regression equation should be developed.There is a considerable variation observed in different correlations hence while estimating Vs using
correlation equations it would be beneficial to consider more than one test parameter.
REFERENCES
[1] Maheshwari,U.R., Boominathan, A., andDodagoudar, G. R.,“Use of surface waves in statistical correlations of shear wave velocity and penetration resistance of Chennai soils”, Geotechnical and Geological engineering, Vol.28, No.2, pp.119-137, 2010.
[2] “Caltrans seismic design criteria”, 1.7, California department of transportation, Sacramento, pp. B14-B15, 2013.
[3] “NEHRP recommended provisions for seismic regulations for new buildings and other structures”, Building seismic safety council, Washington, pp. 47-49, 2003.
[4] “California building code”, part 2, California building standards commission, Sacramento, California, pp. 42-45.
[5] Seed, H. B., Idriss, I.M., and Arango, I.,“Evaluation of Liquefaction Potential Using Field Performance Data”, Journal of Geotech. Eng., Vol.109, No.3, pp.458–482, 1983.
[6] Hamumantharao, C., and Ramana, G., “Dynamic soil properties for microzonation of Delhi, India”, Journal of Earth System Science, Vol.117, No.S2, pp. 719-730, 2008.
[7] Anbazhagan P., and Sitharam, T.G., "Mapping of average shear wave velocity for Bangalore region: a case study", Journal of Environmental & Engineering Geophysics, Vol.13, No.2, pp. 69-84, 2008.
[8] Sil, A., and Sitharam, T.G., "Dynamic site characterization and correlation of shear wave velocity with standard penetration test ‘N’values for the city ofAgartala, Tripura state, India", Pure and Applied Geophysics, Vol.171, No.8, pp. 1859-1876, 2014.
[9] Anbazhagan, P., Kumar, A., and Sitharam, T.G., "Seismic site classification and correlation between standard penetration test N value and shear wave velocity for Lucknow City in Indo-Gangetic Basin", Pure and applied geophysics, Vol.170, No.3, pp. 299-318, 2013.
[10] Marto, A., Tan, C.S., and Leong, T.K., "Universal Correlation of Shear Wave Velocity and Standard Penetration Resistance",The electronic journal of Geotech. Engg.,Vol.18, pp. 2727-2738, 2013.
[11] Mayne, Paul, W., and Rix, G.J., "Correlations between Shear Wave Velocity and Cone Tip Resistance in Natural Clays", Soils and Foundations, Vol.35, No.2, pp. 107-110, 1995.
[12] Robertson, P. K., "Interpretation of cone penetration tests-a unified approach", Canadian Geotechnical Journal, Vol.46, No.11, pp. 1337-1355, 2009.
[13] Robertson, P. K., and Wride, C.E., "Evaluating cyclic liquefaction potential using the cone penetration test", Canadian Geotechnical Journal, Vol.35, No.3, pp. 442-459, 1998.
![Figure 1: Vs versus SPT N value for all soils (Hanumanthrao et al. [6])](https://thumb-us.123doks.com/thumbv2/123dok_us/1637875.1204526/2.595.92.527.226.534/figure-vs-versus-spt-value-all-soils-hanumanthrao.webp)
![Figure 2: Vsversus SPT N for all soils (Maheshwari et al. [1])](https://thumb-us.123doks.com/thumbv2/123dok_us/1637875.1204526/3.595.149.452.526.740/figure-vsversus-spt-n-for-all-soils-maheshwari.webp)
![Figure 7: Vs versus Su for cohesive soils (Dickenson [14])](https://thumb-us.123doks.com/thumbv2/123dok_us/1637875.1204526/6.595.181.417.538.705/figure-vs-versus-su-cohesive-soils-dickenson.webp)
