DOI: 10.1534/genetics.105.046169
Fine Mapping and Physical Characterization of Two Linked Quantitative
Trait Loci Affecting Milk Fat Yield in Dairy Cattle on BTA26
Mathieu Gautier,*
,†,1Rosa Roy Barcelona,* Se´bastien Fritz,
‡Ce´cile Grohs,* Tom Druet,
§Didier Boichard,
§Andre´ Eggen* and Theo H. E. Meuwissen
†,**
*Laboratoire de Ge´ne´tique Biochimique et Cytoge´ne´tique and§Station de Ge´ne´tique Quantitative et Applique´e, INRA 78352 Jouy-en-Josas, France,†Department of Animal and Aquacultural Sciences and**Centre for Integrative Genetics, Agricultural University of Norway,
N-1432 Aas, Norway and‡Union Nationale des Coope´ratives d’Elevage et d’Inse´mination Animale, 75595 Paris, France Manuscript received May 27, 2005
Accepted for publication September 12, 2005
ABSTRACT
Previously, a highly significant QTL affecting fat yield and protein yield and mapped to the bovine BTA26 chromosome has been reported to segregate in the French Holstein cattle population. To confirm and refine the location of this QTL, the original detection experiment was extended by adding 12 new families and genotyping 25 additional microsatellite markers (including 11 newly developed markers). Data were then analyzed by an approach combining both linkage and linkage disequilibrium information, making it possible to identify two linked QTL separated by 20 cM corresponding to29 Mb. The presence of a QTL affecting protein yield was confirmed but its position was found to be more telomeric than the two QTLunderlying fat yield. Each identified QTL affecting milk fat yield was physically mapped within a segment estimated to be,500 kb. Two strong functional candidate genes involved, respectively, in fatty acid metabolism and membrane permeability were found to be localized within this segment while other functional candidate genes were discarded. A haplotype comprising the favorable allele at each QTL position appears to be overrepresented in the artificial insemination bull population.
S
INCE the first experiment reported 10 years ago (Georges et al. 1995), several genomewide scansfor QTL have given primary localizations of numerous QTL affecting production, health, or conformational traits in dairy cattle (Khatkaret al.2004). Depending
on the assumed effective size of the population, be-tween 50 and 100 segregating genes are expected to affect the variation of a given quantitative trait (Hayes
and Goddard2001). However, identification of the
cor-responding underlying causal mutations is hampered by the small effect of the QTL on the trait considered. Recently, the development of both dense genetic maps (Barendseet al. 1997; Kappes et al.1997; Iharaet al.
2004) associated with high-throughput genotyping tech-niques and new models for the analysis of data have improved fine-mapping techniques greatly. Indeed, meth-odologies were proposed to combine linkage analysis (LA) and linkage disequilibrium (LD) mapping in-formation on the basis of either variance component (Meuwissenand Goddard2000) or likelihood models
(Farniret al. 2002). These strategies exploit residual
LD existing in the bovine population (Farniret al.2000)
and have demonstrated their efficiency by greatly
re-ducing the interval of location for some QTL (Meuwissen
et al.2002; Olsenet al.2005). Furthermore, they recently
contributed to the characterization of a causal mutation in the DGAT1 gene (Grisartet al.2002, 2004) and of two
other putative causal mutations, respectively, in the GHR gene (Blottet al.2003) and the OPN gene (Schnabelet al.
2005). All these mutations are associated with a strong effect on milk production traits.
In parallel, knowledge on the bovine genome has be-nefited greatly from structural genetics studies. Detailed human/bovine comparative maps have been developed (Hayes1995; Bandet al.2000; Hayeset al.2003),
in-creasing the possibility of exploiting the genome se-quence and the growing functional characterization of reference species such as man (Landeret al.2001), rat
(Gibbset al.2004), or mouse (Waterstonet al.2002).
These data provide new insights to unravel the genetic determinism involved in the variation of some traits of breeding interest (Andersson and Georges 2004).
More recently, a first-generation physical map of the bo-vine genome was released (Schibleret al.2004),
open-ing the way toward the whole bovine genome sequence planned to be assembled at the beginning of 2006.
In this study, most of the available positional cloning tools in cattle were applied for the fine mapping and the physical characterization of a highly significant QTL af-fecting milk fat yield on bovine chromosome 26 (BTA26). This QTL was originally described to segregate in the French Holstein dairy population (Boichard et al.
Sequence data from this article have been deposited with the EMBL/ GenBank Data Libraries under accession nos. AY609062–AY609077.
1Corresponding author:Laboratoire de Ge´ne´tique Biochimique et de
Cytoge´ne´tique, De´partement de Ge´ne´tique Animale, INRA, Domaine de Vilvert, 78352 Jouy-en-Josas, France. E-mail: [email protected]
2003) and was confirmed later in a combined analysis associating French and German families (Bennewitz
et al. 2003). According to the results from a recently published high-resolution comparative map between BTA26 and human chromosome 10 (HSA10) (Gautier
et al.2003), 14 publicly available microsatellite markers and 11 newly developed microsatellite markers were genotyped in the families of the original design ex-tended by the addition of new families originating from the marker-assisted selection (MAS) program initiated in 2000 in France (Boichard et al. 2002). These new
data were then analyzed using a methodology combin-ing LA and LD to identify the most likely QTL marker interval. A detailed physical and comparative map of the corresponding interval was then constructed.
MATERIALS AND METHODS
Animal material: Only Holstein families were included in
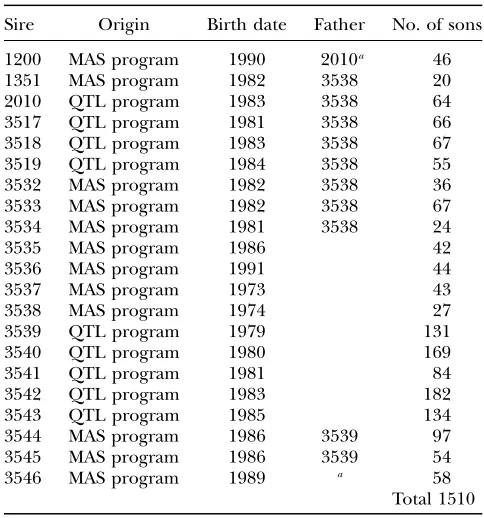
this analysis since it was known that no BTA26 QTL affecting milk production traits segregates in families of the two other breeds (Montbe´liarde and Normande) included in the ini-tial QTL detection protocol (Boichardet al.2003) or MAS program (Boichardet al.2002). Thus, the resulting design consisted of a classical granddaughter design with 21 half-sib families: 9 from the original QTL program and 12 from the MAS program. As shown in Table 1, 1510 half-sib progeny were tested—on average 72 (ranging from 20 to 182) per family—-and some families were strongly related, as some sons ap-peared also as sires in the design.
Daughter yield deviation (DYD) for the five milk produc-tion traits (milk yield, fat yield, protein yield, fat percentage, and protein percentage) and corresponding reliabilities origi-nated from the routinely performed bull genetic evaluations. Effective numbers of daughters were computed from the re-liabilities assuming heritabilities of 0.3 and 0.5 for yield and percentage traits, respectively (Boichardet al.2003). All bull DNAs were available from the previously mentioned studies.
Genotyping data:Previously available genotyping data:Before the beginning of the study, genotypes for four microsatellite markers (ABS12, BMS907, INRA081, and IDVGA59) were available (Boichard et al. 2003). Nevertheless, ABS12 and IDVGA59 were genotyped only on the sons from the nine families of the original QTL program, which explains the lower number of genotyped sons (see Table 2).
Microsatellite marker selection and production:According to the primary localization results and mapping information avail-able for BTA26 (Gautieret al.2003), 19 microsatellite mark-ers from the public database (http://dga.jouy.inra.fr/cgi-bin/ lgbc/main.pl?BASE¼cattle) were selected. Since the number of markers in the linkage map of the centromeric region of BTA26, which corresponded to the most likely QTL region, was too low, we decided to selectively isolate new microsatellite markers in this region from 37 bacterial artificial chromo-somes (BACs) containing at least one of the following 18 genes: AW289352, MBL2, MINPP1, LIPF, ACTA2, CH25H, LIPA, RI58, PPP1R3C, KIAA0940, KNSL1, IDE, HHEX, LGI1, PDE6C, CYP2C19, SH3D5, PDLIM1, and PYCS, these genes mapping to the region of interest (Gautieret al.2003). Some of these genes also represented functional candidate genes. The INRA BAC library was PCR screened as previously de-scribed (Eggenet al.2001) for the gene PRKG1, using primers deriving from the sequence Y08961 (PRKG1F, GCTCCAGGA GAAGATCGAGGA and PRKG1R, GCTGAGATCCTGGATGT
CAAA). Although this gene could not be mapped directly on the BTA26 radiation hybrid (RH) map due to strong sequence similarities among bovine primers and hamster genomic se-quences, comparative mapping results indicate that it repre-sents a good candidate to refine the boundaries between the two blocks of conserved synteny called HB4 and HB5 in one of our previous publications (Gautier et al. 2003). Two addi-tional INRA BAC clones (bI0054A11 and bI0735C02) were thus added to the 37 previously selected ones.
Microsatellite sequence isolation from these 39 bovine BAC clones was performed according to standard procedures (Vaimanet al.1994). The protocol was slightly improved to increase the yield. Briefly, BAC clone DNA was extracted by mini-preparation in 96-well plates using a modified alkaline lysis procedure (Schibleret al.2004). Pools of three to four BAC DNA (300–500 ng each) were mixed, digested to comple-tion with Sau3A (Promega, Madison, WI), and cloned in a dephosphorylated pGEM4Z vector (Promega). Sublibraries were then organized in 96-well plates and individual clones were spotted onto a 22322-cm membrane at a medium den-sity (Amersham, Arlington Heights, IL). Arrays were then screened using (TG)10 and (TC)10 32P-radiolabeled oligonu-cleotides and DNA of positive clones was extracted for se-quencing with an ABI377 sequencer (ABI Prism) according to standard procedures. Of the 32 microsatellite sequences ob-tained, 16 either contained repetitive sequences or were too short to design suitable primers; they were thus discarded from
TABLE 1
Family structure of the granddaughter design used in the study
Sire Origin Birth date Father No. of sons
1200 MAS program 1990 2010a 46
1351 MAS program 1982 3538 20
2010 QTL program 1983 3538 64
3517 QTL program 1981 3538 66
3518 QTL program 1983 3538 67
3519 QTL program 1984 3538 55
3532 MAS program 1982 3538 36
3533 MAS program 1982 3538 67
3534 MAS program 1981 3538 24
3535 MAS program 1986 42
3536 MAS program 1991 44
3537 MAS program 1973 43
3538 MAS program 1974 27
3539 QTL program 1979 131
3540 QTL program 1980 169
3541 QTL program 1981 84
3542 QTL program 1983 182
3543 QTL program 1985 134
3544 MAS program 1986 3539 97
3545 MAS program 1986 3539 54
3546 MAS program 1989 a 58
Total 1510
Each half-sib family is named by the name of the sire. Size (number of progeny-tested sons) and origin (families from the initial design-named QTL program and families originat-ing from the MAS program) are also indicated. The name of the father of the sire is indicated when it is included as a sire in the granddaughter design.
a
further analysis (our unpublished data). PCR primers were designed for the 16 remaining and first tested to screen the BAC library (Eggenet al.2001) to identify or confirm the BAC clone(s) from which the microsatellite markers were isolated. Three additional microsatellite markers (BZ840628, BES26_1, and CC471573) were produced in silico from BAC end se-quences available in the public domain. The chosen BACs were selected according to the first draft of the physical map of the bovine genome (Schibleret al.2004) and their expected positions were checked before genotyping by radiation hybrid mapping on the BTA26 RH map using standard mapping pro-cedures (Gautieret al.2003).
Finally, 42 microsatellite markers were considered in this study (23 publicly available and 19 newly developed), of which 13 were not included in the analysis (see below). The re-maining 29 markers are described in Table 2.
Genotyping procedure: The genotyping procedure consisted of a multiplex fluorescent PCR amplification with one fluo-rescent end-labeled primer (MWG-Biotech). According to the fluorochrome dye and the PCR product length, the 38 micro-satellites were assembled into five groups. For each group, one or two multiplex PCRs were performed and resulting PCR pro-ducts pooled before migration. Multiplex PCR conditions were set up by adjusting the final concentration of marker pri-mers after several successive testing experiments performed on calibrated bovine DNA (20 ng/ml) as template. PCR reac-tions were performed using the Multiplex PCR kit (QIAGEN, Valencia, CA) and according to the QIAGEN recommenda-tions on a PTC-100 thermocycler (MJ Research, Watertown, MA) in a 10-ml final volume. Samples were preheated for 5 min at 94°and subjected to 35 cycles of 94°for 20 sec, 55°for 30 sec, and 72°for 30 sec and then to a final extension step of 5 min at 72°. During the setup process, PCR products were run on a 377 ABI sequencer and raw data were analyzed with the Genotyper software (ABI Prism). PCR products from further genotyping were first purified on Sephadex G50 before running on a MegaBACE 96 capillaries sequencer (Molecular Dynamics, Sunnyvale, CA). Raw data were then analyzed using Genetic Profiler v1.5 (Molecular Dynamics). Three markers, ARO25, INRA320 (AY609072), and INRA325 (AY609075), were dis-carded during the setting up of the multiplex PCR conditions for technical reasons (nonspecific cross products in PCR amplification). Final conditions for the multiplex genotyping of the 35 remaining markers are available upon request.
Linkage map construction:Marker order and map distances
were estimated using the CRIMAP 2.4 software (Greenet al. 1990). First, the marker order was challenged against that of the comprehensive RH map of BTA26 (Gautieret al.2003), using the FLIPS option with a five-marker window to obtain the most likely order given our data set. The CHROMPIC op-tion was subsequently used to identify unlikely double cross-overs, which were considered as missing genotypes (0.2% of the genotypes). Final map distances were computed on the basis of Haldane’s mapping function.
QTL mapping statistical analysis: LA: LA was performed
using a classical regression interval analysis (Haleyand Knott 1992), using the web-based version of the software QTL express (Seatonet al. 2002), with both a one-QTL and a two-QTL model computed every centimorgan along the chromosome. During this step, marker informativity at each position along the chromosome was also computed as the mean (12pij)2, wherepijis the probability for sonjof inheriting from sireione arbitrarily defined chromosome segment at the position con-sidered (Seaton et al.2002). Analyzed data correspond for each trait of interest to twice the so-called DYD of the bulls (Boichardet al.2003) weighted by their respective reliabil-ities. A 95% chromosomewise significance threshold was computed on the basis of 10,000 permutations and a
confi-dence interval was estimated using the bootstrapping option on 10,000 iterations. The heterozygous status of the different sires was established on the basis of the t-test value at the position considered. To evaluate the status at positions other than the maximum peak one, a subset of the data set sur-rounding the position of interest was used.
The variance component-based LA was performed using a similar model to that detailed in the next section except that base haplotypes were considered unrelated (Meuwissenet al. 2002). The fraction of the total additive genetic variance ex-plained by the QTL was estimated as 2sh2/(2sh2 1su2), where sh2andsu2correspond, respectively, to the variance component associated with the haplotype effect and the additive polygenic effect (see below).
Combined linkage disequilibrium and linkage analysis: Fine mapping of the QTL was performed using the same approach previously described (Meuwissenet al.2002). Briefly, it con-sists of a variance component mapping method (Hoeschele et al.1997), which is extended to take into account informa-tion provided by residual LD in the populainforma-tion. The proce-dure consists of three successive steps:
Construction of maternally and paternally inherited marker haplotypes for each recorded individual (Windig and Meuwissen2004).
Computation of the matrix Hpof identity-by-descent (IBD)
probabilities among pairs of base haplotypes at each pu-tative QTL positionp(typically the midpoint of each marker bracket), as previously described (Meuwissenand Goddard 2001). TheGpmatrix of IBD probabilities of all haplotype
pairs at position p is then deduced from the Hp matrix
and from known pedigree information (Fernando and Grossman1989). When the IBD probability of a haplotype pair was.0.95 at a given position, they were considered identical.
Calculation of the likelihood of the data at each position p following the mixed model:y¼m11Zqh1Zau1e, wherey is the vector of DYD records,mis the overall mean,his a vector of random haplotype effects,uis a vector of random additive polygenic effects resulting from the combined effect of background genes,eis a random sampling error, andZqandZaare incidence matrices. The variance matrices Var(u), Var(h), and Var(e) are, respectively, Var(u)¼Asu2 withAbeing the additive genetic relationship matrix based on the pedigree of the bulls, Var(h)¼Gpsh2, and Var(e)¼
Rse2, whereRis a diagonal matrix withnj1on the diagonals (njbeing the effective number of daughters of bullj). The variance components of the random effectssu2,sh2, andse2 and the likelihoodLpof the above model were estimated by the ASREML package (Gilmouret al.2000) at each posi-tionp. The log-likelihood ratio test LRT¼ 2(log(L0) log(Lp)) is then computed, whereL0 corresponds to the likelihood of the null hypothesis model that assumes Var(h) ¼0. This test statistic is approximately chi-square distributed with 1 d.f. (Olsenet al.2004). As above, the fraction of the total genetic variance explained by the QTL was estimated as 2sh2/(2sh2 1s2u), wheresh2 and su2 correspond, respectively, to the variance component asso-ciated with the haplotype effect and the additive polygenic effect.
A two-QTL model linkage disequilibrium and linkage analysis:To confirm and test the presence of two QTL affecting the trait of interest, a two-QTL model was used to perform linkage dis-equilibrium and linkage analysis (LDLA). The records were thus modeled by:y¼m11Zq1h11Zq2h21Zau1e, wherey,m,
u,e, and1are as defined above, andh1andh2are vectors of
matrices. As defined previously, Var(u)¼Asu2, Var(h
1)¼G1sh12 , Var(h2)¼G2s2h2, and Var(e)¼Rse2. The variance components of the random effectssu2,s
h1 2 ,s
h2 2 , ands
e
2and the likelihood Lpq of the above model were estimated by the ASREML package (Gilmouret al.2000) at eachP3(P1)/2 pair of positionspandq(Pbeing the total number of brackets). Two kinds of log-likelihood-ratio tests were then computed:
The two-QTL hypothesisvs.the no-QTL hypothesis: LRT¼ 2(log(L0) log(Lpq)), where L0 corresponds to the likelihood of the null hypothesis model that assumes Var(h1)¼Var(h2)¼0. This test statistic is approximately
chi-square distributed with 2 d.f.
The two-QTL hypothesisvs.the one-QTL hypothesis: LRT¼ 2(log(Lp)log(Lpq))] and LRT¼ 2(log(Lq)log(Lpq)), whereLp(respectivelyLq) corresponds to the likelihood of the model that assumes Var(h2)¼0 [respectively Var(h1)¼
0]. This test statistic is approximately chi-square distributed with 1 d.f.
The fraction of the total genetic variance explained by the QTL at positionpwas estimated as 2sh12 /(2sh12 12sh22 1su2), wheresh12 ,sh22 , andsu2correspond to the variance component associated with the two haplotype effects at marker bracket positionsp and qand the additive polygenic effect, respec-tively. The heterozygous status of an individual at marker bracket positionpwas estimated by testing the difference be-tween its paternal and maternal alleles. The test was thus per-formed using the two-effect estimates difference (Dh¼hmat hpat) and its prediction error variance [PEV¼Cii1Cjj2Cij, whereCklcorresponds to the element (k,l) of the inverse of the mixed-model equation of the haplotype effect], each of the terms of the equation being provided by ASREML. Un-der the null hypothesis, the statisticN¼Dh/PEV0.5follows a T-distribution withn¼npat1nmat2 d.f. (npatandnmat cor-respond to the number of times the paternally or maternally inherited haplotype is observed, respectively). For most sires (npat1nmat) is large enough to assume thatNis approximately standard normally distributed under the null hypothesis.
Physical map construction:As mentioned previously, all the
microsatellite markers considered in this study were screened for in the INRA BAC library (Eggen et al.2001). Together with previous physical and comparative map information for BTA26 (Gautieret al.2003; Schibleret al.2004), these data allowed us to anchor each marker into the INRA first-generation bovine physical map (http://locus.jouy.inra.fr/fpc/cattle). This map is further anchored on the international physical map, which serves as a basis for the genome sequencing con-sortium (http://www.bcgsc.ca/lab/mapping/bovine), using international BAC clones included in both maps and a precise estimate of the location of the INRA contig and of some of their markers on the international physical map. To refine and confirm the bovine-human comparative map, some of the bovine BAC end sequences (BES) from international (Larkin et al.2003) and INRA BAC clones (out of the 30,000 recently produced and submitted to GenBank) in the region were aligned against the HSA10 Build35 sequence assembly (http:// genome.ucsc.edu/), using the BLASTalignment tool (Altschul et al.1997). Repetitive sequences were masked and only those alignments producing hits.80 bp long with at least 85% of overall sequence similarity were considered as significant.
RESULTS
Construction of a high-density integrated genetic and physical map of the BTA26 chromosome:Linkage map construction:Genotypes for 39 microsatellite
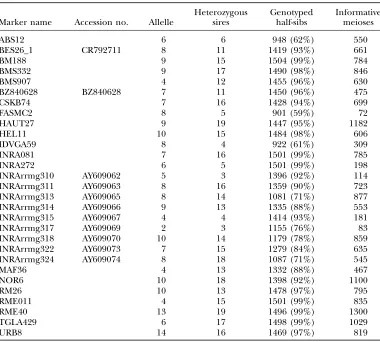
mark-ers were available to build a medium-density BTA26 ge-netic map. Among these, 4 were previously genotyped and 35 were genotyped for the purpose of this study. Six markers had to be discarded during the analysis of raw genotype data because of technical difficulties [BMS4505, INRA319 (AY609071), INRA316 (AY609068), INRA327 (AY609077), and TGLA22] or inheritance inconsisten-cies due to the segregation of a null allele [INRA312 (AY609064)]. Similarly, no polymorphism was observed in our families for INRA326 (AY609076), CC471573, BM7226, and FASMC1, confirming for this latter marker the low heterozygosity level reported previously (http:// www.marc.usda.gov/genome/genome.html).
Finally, 29 markers were considered to build the ge-netic map, displaying on average 645 informative mei-oses, from 72 for FASMC2 to 1300 for RME040 (Table 2). Respectively, 6 and 16 markers (Figure 1A, under-lined ) were in common with the 8-marker IBRP97 map (Barendse et al. 1997) and the updated 63-marker
MARC map (Iharaet al. 2004). Distances and orders
were in perfect agreement especially when comparing with the high-density MARC map. In addition, as shown below, the order is supported by independent results from both RH and physical maps.
Integration of linkage and physical maps (Figure 1B):As previously described (Gautier et al. 2003), almost all
the markers from the BTA26 RH map (Figure 1D) were screened for in the INRA BAC library and thus an-chored to the INRA physical map (Schibleret al.2004).
The resulting first draft of the BTA26 physical map was estimated to cover70% of the total length of the chro-mosome. As shown in Figure 1B, the 29 microsatellite markers of the linkage map belong to 13 different INRA contigs (each containing from 1 to 5 markers). Further details for each of these contigs are accessible online (http://locus.jouy.inra.fr/fpc/cattle/). For the four con-tigs containing.2 markers, physical data confirm the linkage map marker order. Similarly, five (674, 4967, 676, 670, and 151), three (679, 1617, and 680), and two (153 and 684) consecutive INRA contigs are respectively anchored to contig 13420, contig 1154, and contig 10397 from the international physical map (http://www.bcgsc. ca/lab/mapping/bovine).
Integration of linkage and improved comparative map (Figure 1C): Two blocks of conserved synteny between BTA26 and HSA10 have been previously described (Gautieret al.2003). Inside each group, only a few
dis-crepancies in the conservation of the gene order re-mained but they can be attributed to the resolution limit of the RH map (Schibleret al.2004). In this study, each
two blocks of conserved synteny to a region ,100 kb formed by two overlapping BAC clones inside INRA contig 676 (Figure 1C). As a result, the integrated map strongly supports an overall gene content and order conservation inside each of the two blocks of conserved synteny between BTA26 and HSA10. This provides additional support for the marker order in our BTA26 linkage map and its coverage appears to provide a good marker density with no gap exceeding 6 Mb as estimated on the HSA10 genome map (Figure 1C).
QTL mapping results: Linkage analysis: Regression LA on the extended design confirmed the existence of the QTL affecting fat yield (P,0.001) and protein yield (P,0.001) (Figure 2). No significant QTL was detected for the three other milk production traits considered: milk yield, fat percentage, and protein percentage, with an F-value profile never.1.5 along the chromosome. According to thet-test performed at the peak position (14 cM on the map), seven sires (2010, 3517, 3518, 3538, 3539, 3542, and 3544) were heterozygous for the QTL affecting fat yield. The F-value profile for the protein yield trait appears very different, with a very flat peak (position 64 cM) at the end of the chromosome where the informativity is weaker due to a lower marker
den-sity. Five sires were found to be heterozygous, among which only three (3518, 3538, and 3539) are in common with the previous one. Although the 95% bootstrap confidence intervals are overlapping for the two traits (covering almost the entire chromosome for protein yield), our results suggest the segregation of different QTL affecting protein and fat yield. LDLA results con-firmed this hypothesis (see below). We then focused on fat yield and its QTL in the first part of the chromosome where we developed and used a dense marker map. In the following, only fat yield results are presented.
For the fat yield trait, qualitative observations of pa-ternal individual contributions (data not shown) as well as the overall ‘‘double-peak’’ shape (one peak arising at position 14 cM,F-value¼2.75, and the other at position 36 cM,F-value¼2.67) of the QTL location curve seem to indicate the segregation of at least two linked QTL for the trait. Moreover, the two most important contribu-tions to the 90% bootstrap interval, which spans a region from position 9 to 68 cM on the map, are located at the two corresponding peaks (Figure 2).
We thus performed a two-QTL regression analysis. The maximumF-value statistics for the models of two QTLvs.no QTL (42 and 151042¼1478 d.f.) and two
TABLE 2
Characteristics of the microsatellite markers from BTA26 used in this study
Marker name Accession no. Allelle
Heterozygous sires
Genotyped half-sibs
Informative meioses
ABS12 6 6 948 (62%) 550
BES26_1 CR792711 8 11 1419 (93%) 661
BM188 9 15 1504 (99%) 784
BMS332 9 17 1490 (98%) 846
BMS907 4 12 1455 (96%) 630
BZ840628 BZ840628 7 11 1450 (96%) 475
CSKB74 7 16 1428 (94%) 699
FASMC2 8 5 901 (59%) 72
HAUT27 9 19 1447 (95%) 1182
HEL11 10 15 1484 (98%) 606
IDVGA59 8 4 922 (61%) 309
INRA081 7 16 1501 (99%) 785
INRA272 6 5 1501 (99%) 198
INRArrmg310 AY609062 5 3 1396 (92%) 114
INRArrmg311 AY609063 8 16 1359 (90%) 723
INRArrmg313 AY609065 8 14 1081 (71%) 877
INRArrmg314 AY609066 9 13 1335 (88%) 553
INRArrmg315 AY609067 4 4 1414 (93%) 181
INRArrmg317 AY609069 2 3 1155 (76%) 83
INRArrmg318 AY609070 10 14 1179 (78%) 859
INRArrmg322 AY609073 7 15 1279 (84%) 635
INRArrmg324 AY609074 8 18 1087 (71%) 545
MAF36 4 13 1332 (88%) 467
NOR6 10 18 1398 (92%) 1100
RM26 10 13 1478 (97%) 795
RME011 4 15 1501 (99%) 835
RME40 13 19 1496 (99%) 1300
TGLA429 6 17 1498 (99%) 1029
QTLvs.one QTL (42 and 21 d.f.)¼2.27 (P2vs.0,8.33
106) and 1.75 (
P2vs.1,0.084), respectively. On the
two-QTL regression modelF-value contour plot curve along the two-dimensional map surface, the surface harboring anF-value superior to an arbitrarily chosen threshold 2.1 was found to cover regions from position 10 to 14 cM for the first fitted QTL (corresponding to the peak value under a one-QTL model) and 33–39 cM and 44–79 cM for the second fitted QTL (the highestF-value being for two QTL located at positions 15 and 68 cM). However, position results should be considered with care because of lack of informativity at the end of the chromosome (see above) and modest resolution of the regression model. Thus, the hypothesis of at least two segregating QTL seems likely.
A variance component LA using linkage information alone (i.e., using LD within the known pedigree) was also performed (Figure 3) and provided an estimate of the QTL effect considered here as the proportion of the total additive genetic variance explained. The curve was found to be slightly different since the two-peak shape was less clear than previously, the first peak being smaller than the second one. Nevertheless, this analysis seems also to agree with the hypothesis of the segregation of two QTL. The QTL variance as estimated over the entire chromosome was found to explain on average 12.8% (from 8.9 to 17.3) of the total additive genetic variance.
LDLA fine-mapping results: LDLA mapping results support the hypothesis of the segregation of two QTL underlying fat yield as mentioned earlier. Indeed, two
peaks of approximately the same size were found for the marker brackets [BMS907/INRA311] and [BES26_1-HAUT27] (Figure 3). Their respective positions (span-ning from position 10.0 to 12.5 cM for [BMS907/ INRA311] and from position 31.3 to 34.3 cM for [BES26_1-HAUT27]) are in agreement with the results from LA described above.
To test this hypothesis of two segregating QTL, we performed a two-QTL model LDLA (Figure 4). The maximum LRT (LRT¼26.22) value in two dimensions was obtained for the position fitting haplotype effects for both the [BMS907/INRA311] and [BES26_1/ HAUT27] brackets. As shown in Figure 3, the likelihood-ratio test of the LDLA model fitting two QTL (at po-sitions [BMS907/INRA311] and [BES26_1/HAUT27])
against the one-QTL model including only the effect of the [BMS907/INRA311] haplotype is 7.28 (P,0.007). Similarly, against the one-QTL model fitting only the effect of the [BES26_1/HAUT27] haplotype, the LRT¼
7.68 (P,0.006).
LDLA mapping results for the protein yield trait gave the last marker bracket [TGLA429/MAF36] as the most likely, in agreement with results from LA alone. This also adds credit to the hypothesis of different QTL acting on fat yield and protein yield rather than one or several QTL with a pleiotropic effect. Nevertheless, we cannot exclude a possible pleiotropic effect on fat yield for the QTL affecting protein yield, which may cause the segregation of a third QTL for the trait of interest. However, the marker density in this region was too low to appropriately test this hypothesis and propose a fine characterization of this QTL.
Figure2.—Linkage analysis results from re-gression LA. The number of bootstrap sam-ples and the informativity have been rescaled.
Figure3.—LDLA results and comparison with results from variance component linkage analysis alone. The two-QTL LDLA model 1 (respectively, 2) LRT curve plots the test of the LDLA model fitting the two-QTL bracket effect against the model fitting one QTL at the [BMS907/INRA311] (re-spectively, [BES26_1/HAUT27]) marker bracket.
Haplotype effect:Following LDLA results, the [BMS907/ INRA311] and the [BES26_1/HAUT27] marker brack-ets were found to explain, respectively, 1.8 and 2.5% of the total fat yield additive genetic variance under the two-QTL model. Under the one-QTL LDLA, these esti-mates were 4.34 and 2.50%, which might indicate the cosegregation of a haplotype carrying alleles of similar effect at the two QTL positions (see below). For the [BMS907/INRA311] and the [BES26_1/HAUT27] marker brackets, respectively, 442 and 247 different identity-by-descent haplotypes were found to segregate in the pedigree. The two corresponding distributions appear approximately bimodal (Figure 5), thus suggest-ing a biallelic effect for each of the QTL positions, with one favorable allele (increasing fat yield). However, for the [BMS907/INRA311] marker bracket effect distri-bution, 10 IBD haplotypes seem to have a clear de-creasing effect. Some clustering procedures might help to confirm this trend.
For each of the corresponding IBD haplotypes, the allelic combination was built when possible. In the case of the [BMS907/INRA311] bracket, an allelic combina-tion (1_2_1) at the marker BMS907-INRA311-INRA314 (this latter marker being added because it is very close to INRA311) was found to be clearly associated with an increasing haplotype effect. Similarly, most of the favor-able marker bracket effects pertain to IBD haplotypes carrying the allelic combination 1_3 for marker bracket [BES26_1/HAUT27].
Haplotype analysis among the sires:Interestingly, 5 sires (2010, 3518, 3538, 3542, and 3544) found to be het-erozygous after regression LA (see above) at the two QTL positions share a common haplotype from marker NOR6 to RME040 (Figure 6). Among the 16 other sires, 8 (1200, 1351, 3519, 3532, 3534, 3539, 3545, and 3546) also share this haplotype. Nevertheless, 5 are homozy-gous at the two QTL positions (1351, 3532, 3534, 3545, and 3546), 2 (1200 and 3519) are heterozygous only at the second position, and 1 (3539) only at the first posi-tion according to thet-test (Figure 6). These sires may have inherited a favorable allele from their dam. For
instance, sire 1351 has inherited at the first QTL posi-tion a haplotype identical by state to the haplotype of interest and containing in particular the allelic combi-nation 1_2_1 (see above). However, some sires, such as 3532 and 3534, have inherited a maternal haplotype harboring an effect significantly different from the pa-ternal one (respectively,P,0.076 andP,0.003) at the second position analyzed. Thus, their homozygous status declared after regression LA could originate from lack of power of thet-test (particularly because of their small family size). More generally, status at the two QTL positions appears to be broadly concordant from both regression LA andN-value test statistics. Differences may be attributed to a greater power of the LDLA (because the clustering process is equivalent to an increased family size). Moreover, their close location makes it difficult to discriminate status at the two QTL positions from thet-test derived from regression, whereas LDLA succeeds in a better disentangling of the two linked QTL by accounting for many more recombination events.
Together with the estimate of the marker bracket effects at the two corresponding QTL positions, the results strongly suggest that the haplotypes mentioned above (Figure 6) carry the two favorable alleles. There-fore, as expected, sire 3517 having inherited from 3538 a recombinant haplotype between the two QTL tions was estimated to be heterozygous at the first posi-tion and homozygous at the second. The widespread presence of this large haplotype among the different sires might be explained by a strong positive selection acting on it because of an overall favorable effect on fat yield, since all these sires were also widely used as arti-ficial insemination (AI) bulls. Moreover, a positive cor-relation of 0.3 between the haplotype effect at the two QTL positions was observed among the individual hap-lotypes of the sons and of 0.2 when considering only maternally inherited haplotypes.
A physical map of the two QTL:As shown in Figure 1, we assigned the marker bracket [BMS907-INRA311] to the BAC contig 676. According to the anchorage of this contig on the HSA10 orthologous region and the overall conservation of the region (Gautier et al.2003), the
size of the interval was estimated to be700 kb. This contig is also anchored to the international contig 13420, which has an estimated size of 3079 kb. On the basis of the relative positions of BACs mapped to both INRA and international contigs and flanking the marker of interest (see materials and methods), the size of
the bracket was found to be 250 kb on the bovine physical map.
Similarly, as shown in Figure 1, the INRA BAC contigs containing HAUT27 (680) and BES26_1 (1617) were anchored on the HSA10 orthologous region. They are also both integrated in the INRA contig 679 (contain-ing BMS332) and the INRA contig 1909 anchored on a unique international contig (1730) with an estimated size of 1148 kb. According to the comparative map results,
the marker bracket [BES26_1/HAUT27] was estimated to cover an orthologous region of,1 Mb on the HSA10 chromosome. As above, the size of the bracket was found to be300 kb on the bovine physical map.
DISCUSSION
A highly significant QTL affecting milk production traits including milk yield, protein yield, and fat yield in Holstein dairy cattle mapping to BTA26 was reported in several studies (Planteet al.2001; Bennewitzet al.
2003; Boichardet al.2003). However, the location of
the QTL remained very imprecise. In an attempt to refine its location, 25 additional microsatellite markers, including 11 newly developed ones, were genotyped in the French QTL detection granddaughter design. The original granddaughter design corresponded to nine Holstein families and was further extended by 12 families originating from the French MAS program (Boichardet al.2002). As a first step, a dense linkage
map of chromosome BTA26 was constructed and anchored to the INRA bovine physical map (Schibler
et al. 2004). LA with a classical one-QTL regression model confirmed the existence of the QTL affecting fat
yield at a very high significance level (P , 0.001) but suggested the segregation of two linked QTL. Analysis of the data using a two-QTL regression model supported this hypothesis. A QTL affecting protein yield was also detected but the location of this QTL appeared to be more telomeric than the previous ones. No significant QTL on BTA26 chromosome was found for milk yield, fat percentage, or protein percentage. While not ex-pected, the existence of QTL significant only for fat and protein yields and not for milk yield (which is negatively correlated) or percentages has already been observed (Boichardet al.2003) and is difficult to explain before
the complete molecular characterization of the QTL. Indeed, this allows a more precise estimation of the effect of the QTL on each correlated trait (a significant QTL for a given trait might be nonsignificant for a highly correlated trait but still have an effect on it).
We further focused mainly on the milk fat yield trait. To refine the position of the QTL and confirm the hy-pothesis of the segregation of two linked QTL, we used a combined LDLA approach that has already proved to be powerful by taking advantage of the structure of the livestock population (Grisartet al.2002; Meuwissen
et al.2002; Blott et al.2003). Two approaches
(one-QTL and two-(one-QTL models) were applied to our data set. First, the locations of the QTL affecting fat yield and the QTL affecting protein yield were clearly separated, dis-agreeing with the hypothesis of the existence of a QTL with a pleiotropic effect (Bennewitzet al. 2003).
Sec-ond, the existence of two QTL affecting milk fat yield was confirmed by both the one-QTL and the two-QTL model LDLAs. The most likely location of these two QTL was refined to two marker brackets, [BMS907-INRA311] and [BES26_1/HAUT27], separated from each other by a distance of 20 cM. Their respective sizes were es-timated at 700 and 300 kb. According to comparative map results, the physical distance separating these two QTL covers29 Mb on the HSA10 conserved region.
Interestingly, among the sires of the granddaughter design, most of them also used as AI bulls, a long haplo-type containing the two favorable alleles at the two QTL positions was found to be overrepresented. This might be the consequence of selection acting positively on this favorable combination. This is particularly notable when observing the offspring of sire 3538. Historically, this bull is one of the most-used AI bulls in France. Among its 10 closely related descendants (eight sons, 1351, 2010, 3517, 3518, 3519, 3532, 3533, and 3534; and two grandsons, 1200, a son of 2010, and 3546 from the maternal side) included as sires in the granddaughter design, 8 carry the full haplotype, 1 a recombinant haplotype, and only 1 the other haplotype. This also holds true when observing the two sons of sire 3539, which inherited the same favorable haplotype. The close relationship among most families is inherent to the granddaughter design since it uses populations from production farms (Welleret al.1990). As a result, a bias is
introduced in the regression LA, which assumed all fami-lies to be independent. Nevertheless, this bias seems rela-tively weak since variance components LA, which take into account relationships among sires, gave similar results.
One of the main advantages of LDLA over LA is that it uses historical recombinations, the information of which is carried mainly by maternal haplotypes. Since only one generation of recombination is analyzed in LA and since the two QTL are 20 cM apart,,20% of the sons are expected to be recombinants between the two positions (and ,4% double recombinants). This ex-plains the lack of resolution of the two-QTL regression model even if the meiosis could be traced almost with certainty (in our case 15 markers are mapped between the two positions). This results in lack of precision when estimating the status of the sires at the two QTL posi-tions. This tendency is more pronounced as the family size decreases, thus making discrimination of the effect of the two QTL more difficult. LDLA, even with a one-QTL model, appeared to be far less sensitive to the seg-regation of linked QTL because of the large number of different and informative maternal haplotypes. The es-timation of the QTL effect (respectively 1.8 and 2.5% of the total genetic variance) was still slightly over-estimated using a one-QTL model compared to the two-QTL model for LDLA.
Several genes involved in lipid metabolism or catab-olism pathways are located on BTA26, as revealed by direct mapping or suggested by comparative mapping (Gautieret al.2003). They all werea prioristrong
func-tional candidate genes. Among these, from the centro-mere to the telocentro-mere we can quote LIPF (gastric lipase), LIPA (lipase A, cholesterol esterase), SCD (stearyl co-A desaturase), or GPAM (glycerol-3-phosphate acyltrans-ferase, mitochondrial). For the last three, microsatellite markers close to each of these genes (respectively, INRA318, INRA272, and RME011), were included and genotyped and thus could be excluded as positional candidate genes. In contrast, INRA311 is a microsatel-lite marker developed from a BAC containing the LIPF gene. Whereas no clear effect of any of the INRA311 alleles on fat yield was established (data not shown), this gene appears to represent a strong positional and func-tional candidate gene. One of its alleles, if associated to a putative mutation inside this gene, could be frequent in the population. This is suggested by the high popula-tion frequency of allele ‘‘2’’ belonging to the allelic combination associated with the favorable IBD haplo-type at the marker bracket.
does not represent a clear functional candidate gene. However, in both mouse and rat orthologous regions, an additional gene is described, the insulin 1 precursor (INS1). This gene is a strong functional candidate gene since insulin is known to accelerate glycolysis and gly-cogen synthesis in liver and additionally to increase cell permeability to fatty acids. However, the presence of a similar functional short sequence mapping to the corre-sponding bovine genome orthologous region needs to be confirmed and potential bovine polymorphisms need to be analyzed.
We thank J. Lecardonnel and F. Piumi for their help in microsatellite isolation, S. Taourit for help in sequencing, and H. Hayes for English correction of the manuscript. This project was funded by the De-partment of Animal Genetics of the Institut National de la Recherche Agronomique.
LITERATURE CITED
Altschul, S. F., T. L. Madden, A. A. Schaffer, J. Zhang, Z. Zhang et al., 1997 Gapped BLAST and PSI-BLAST: a new generation of protein database search programs. Nucleic Acids Res.25:3389– 3402.
Andersson, L., and M. Georges, 2004 Domestic-animal genomics:
deciphering the genetics of complex traits. Nat. Rev. Genet.5:
202–212.
Band, M. R., J. H. Larson, M. Rebeiz, C. A. Green, D. W. Heyenet al.,
2000 An ordered comparative map of the cattle and human genomes. Genome Res.10:1359–1368.
Barendse, W., D. Vaiman, S. J. Kemp, Y. Sugimoto, S. M. Armitage et al., 1997 A medium-density genetic linkage map of the bovine genome. Mamm. Genome8:21–28.
Bennewitz, J., N. Reinsch, C. Grohs, H. Leveziel, A. Malafosse et al., 2003 Combined analysis of data from two granddaughter designs: a simple strategy for QTL confirmation and increas-ing experimental power in dairy cattle. Genet. Sel. Evol. 35:
319–338.
Blott, S., J. J. Kim, S. Moisio, A. Schmidt-Kuntzel, A. Cornetet al.,
2003 Molecular dissection of a quantitative trait locus: a phenyl-alanine-to-tyrosine substitution in the transmembrane domain of the bovine growth hormone receptor is associated with a major effect on milk yield and composition. Genetics163:253–266. Boichard, D., C. Grohs, F. Bourgeois, F. Cerqueira, R. Faugeras
et al., 2003 Detection of genes influencing economic traits in three French dairy cattle breeds. Genet. Sel. Evol.35:77–101. Boichard, D., S. Fritz, M. N. Rossignol, M. Y. Boscher, A. Malafosse
et al., 2002 Implementation of marker-assisted selection in French dairy cattle. Proceedings of the 7th World Congress on Genetics Ap-plied to Livestock Production, Montpellier, France, paper 22–03. Eggen, A., M. Gautier, A. Billaut, E. Petit, H. Hayes et al.,
2001 Construction and characterization of a bovine BAC library with four genome-equivalent coverage. Genet. Sel. Evol.33:543– 548.
Farnir, F., B. Grisart, W. Coppieters, J. Riquet, P. Berziet al.,
2002 Simultaneous mining of linkage and linkage disequilib-rium to fine map quantitative trait loci in outbred half-sib pedi-grees: revisiting the location of a quantitative trait locus with major effect on milk production on bovine chromosome 14. Genetics161:275–287.
Farnir, F., W. Coppieters, J. J. Arranz, P. Berzi, N. Cambisanoet al.,
2000 Extensive genome-wide linkage disequilibrium in cattle. Genome Res.10:220–227.
Fernando, R., and M. Grossman, 1989 Marked assisted selection
using best linear unbiased prediction. Genet. Sel. Evol.21:467– 477.
Gautier, M., H. Hayesand A. Eggen, 2003 A comprehensive
radi-ation hybrid map of bovine chromosome 26 (BTA26): compara-tive chromosomal organization between HSA10q and BTA26 and BTA28. Mamm. Genome14:711–721.
Georges, M., D. Nielsen, M. Mackinnon, A. Mishra, R. Okimoto et al., 1995 Mapping quantitative trait loci controlling milk pro-duction in dairy cattle by exploiting progeny testing. Genetics
139:907–920.
Gibbs, R. A., G. M. Weinstock, M. L. Metzker, D. M. Muzny, E. J.
Sodergrenet al., 2004 Genome sequence of the Brown Norway
rat yields insights into mammalian evolution. Nature428:493– 521.
Gilmour, A. R., B. R. Cullis, S. J. Welham and R. Thompson,
2000 ASREML Reference Manual(ftp.res.bbsrc.ac.uk/pub/aar). Green, E., K. Fallsand S. Crooks, 1990 Documentation for CRI-MAP,
Version 2.4. Washington University, St. Louis.
Grisart, B., W. Coppieters, F. Farnir, L. Karim, C. Fordet al.,
2002 Positional candidate cloning of a QTL in dairy cattle: identification of a missense mutation in the bovine DGAT1 gene with major effect on milk yield and composition. Genome Res.
12:222–231.
Grisart, B., F. Farnir, L. Karim, N. Cambisano, J. J. Kimet al.,
2004 Genetic and functional confirmation of the causality of the DGAT1 K232A quantitative trait nucleotide in affecting milk yield and composition. Proc. Natl. Acad. Sci. USA101:2398– 2403.
Haley, C. S., and S. A. Knott, 1992 A simple regression method for
mapping quantitative trait loci in line crosses using flanking markers. Heredity69:315–324.
Hayes, H., 1995 Chromosome painting with human
chromosome-specific DNA libraries reveals the extent and distribution of con-served segments in bovine chromosomes. Cytogenet. Cell. Genet.
71:168–174.
Hayes, B., and M. E. Goddard, 2001 The distribution of the effects
of genes affecting quantitative traits in livestock. Genet. Sel. Evol.
33:209–229.
Hayes, H., C. Elduque, M. Gautier, L. Schibler, E. Cribiuet al.,
2003 Mapping of 195 genes in cattle and updated comparative map with man, mouse, rat and pig. Cytogenet. Genome Res.102:
16–24.
Hoeschele, I., P. Uimari, F. E. Grignola, Q. Zhangand K. M. Gage,
1997 Advances in statistical methods to map quantitative trait loci in outbred populations. Genetics147:1445–1457. Ihara, N., A. Takasuga, K. Mizoshita, H. Takeda, M. Sugimoto
et al., 2004 A comprehensive genetic map of the cattle genome based on 3802 microsatellites. Genome Res.14:1987–1998. Kappes, S. M., J. W. Keele, R. T. Stone, R. A. McGraw, T. S. Sonstegard
et al., 1997 A second-generation linkage map of the bovine ge-nome. Genome Res.7:235–249.
Khatkar, M. S., P. C. Thomson, I. Tammenand H. W. Raadsma,
2004 Quantitative trait loci mapping in dairy cattle: review and meta-analysis. Genet. Sel. Evol.36:163–190.
Lander, E. S., L. M. Linton, B. Birren, C. Nusbaum, M. C. Zody et al., 2001 Initial sequencing and analysis of the human ge-nome. Nature409:860–921.
Larkin, D. M., A. Everts-van derWind, M. Rebeiz, P. A. Schweitzer,
S. Bachmanet al., 2003 A cattle-human comparative map built
with cattle BAC-ends and human genome sequence. Genome Res.13:1966–1972.
Meuwissen, T. H., and M. E. Goddard, 2000 Fine mapping of
quantitative trait loci using linkage disequilibria with closely linked marker loci. Genetics155:421–430.
Meuwissen, T. H., and M. E. Goddard, 2001 Prediction of identity
by descent probabilities from marker-haplotypes. Genet. Sel. Evol.33:605–634.
Meuwissen, T. H., A. Karlsen, S. Lien, I. Olsakerand M. E. Goddard,
2002 Fine mapping of a quantitative trait locus for twinning rate using combined linkage and linkage disequilibrium mapping. Genetics161:373–379.
Olsen, H. G., S. Lien, M. Svendsen, H. Nilsen, A. Rosethet al.,
2004 Fine mapping of milk production QTL on BTA6 by com-bined linkage and linkage disequilibrium analysis. J. Dairy Sci.
87:690–698.
Olsen, H. G., S. Lien, M. Gautier, H. Nilsen, A. Roseth et al.,
2005 Mapping of a milk production quantitative trait locus to a 420-kb region on bovine chromosome 6. Genetics169:275– 283.
Plante, Y., J. P. Gibson, J. Nadesalingam, H. Mehrabani-Yeganeh,
affecting milk production traits on 10 chromosomes in Holstein cattle. J. Dairy Sci.84:1516–1524.
Schibler, L., A. Roig, M. F. Mahe, J. C. Save, M. Gautieret al.,
2004 A first generation bovine BAC-based physical map. Genet. Sel. Evol.36:105–122.
Schnabel, R. D., J. J. Kim, M. S. Ashwell, T. S. Sonstegard, C. P. Van
Tassellet al., 2005 Fine-mapping milk production quantitative
trait loci on BTA6: analysis of the bovine osteopontin gene. Proc. Natl. Acad. Sci. USA102:6896–6901.
Seaton, G., C. S. Haley, S. A. Knott, M. Kearseyand P. M. Visscher,
2002 QTL Express: mapping quantitative trait loci in simple and complex pedigrees. Bioinformatics18:339–340.
Vaiman, D., D. Mercier, K. Moazami-Goudarzi, A. Eggen,
R. Ciampoliniet al., 1994 A set of 99 cattle microsatellites:
char-acterization, synteny mapping, and polymorphism. Mamm. Genome5:288–297.
Waterston, R. H., K. Lindblad-Toh, E. Birney, J. Rogers, J. F.
Abrilet al., 2002 Initial sequencing and comparative analysis
of the mouse genome. Nature420:520–562.
Weller, J. I., Y. Kashiand M. Soller, 1990 Power of daughter and
granddaughter designs for determining linkage between marker loci and quantitative trait loci in dairy cattle. J. Dairy Sci.73:
2525–2537.
Windig, J. J., and T. H. Meuwissen, 2004 Rapid haplotype
recon-struction in pedigrees with dense marker maps. J. Anim. Breed. Genet.121:26–39.