HIGHLIGHTED ARTICLE
| INVESTIGATION
The Spectrum of Replication Errors in the Absence of
Error Correction Assayed Across the Whole Genome of
Escherichia coli
Brittany A. Niccum,* Heewook Lee,†,1Wazim MohammedIsmail,†Haixu Tang,†and Patricia L. Foster*,2 *Department of Biology and†School of Informatics, Computing, and Engineering, Indiana University, Bloomington, Indiana 47405 ORCID IDs: 0000-0002-3528-6833 (H.L.); 0000-0001-8963-8155 (H.T.); 0000-0002-7236-4378 (P.L.F.)
ABSTRACTWhen the DNA polymerase that replicates theEscherichia colichromosome, DNA polymerase III, makes an error, there are two primary defenses against mutation: proofreading by the esubunit of the holoenzyme and mismatch repair. In proofreading-deficient strains, mismatch repair is partially saturated and the cell’s response to DNA damage, the SOS response, may be partially induced. To investigate the nature of replication errors, we used mutation accumulation experiments and whole-genome sequencing to determine mutation rates and mutational spectra across the entire chromosome of strains deficient in proofreading, mismatch repair, and the SOS response. We report that a proofreading-deficient strain has a mutation rate 4000-fold greater than wild-type strains. While the SOS response may be induced in these cells, it does not contribute to the mutational load. Inactivating mismatch repair in a proofreading-deficient strain increases the mutation rate another 1.5-fold. DNA polymerase has a bias for converting G:C to A:T base pairs, but proofreading reduces the impact of these mutations, helping to maintain the genomic G:C content. Thesefindings give an unprecedented view of how polymerase and error-correction pathways work together to maintainE. coli’s low mutation rate of 1 per 1000 generations.
KEYWORDSDNA proofreading; mutation accumulation; mutation hotspots; DNA replicationfidelity; mismatch repair
A
CCURATE mutation rates have recently been determined for a variety of wild-type and mutant strains ofEscherichia coliusing mutation accumulation (MA) experiments coupled with whole-genome sequencing (WGS). Such experiments re-vealed that, at least in a laboratory setting, few DNA repair pathways are essential for maintainingE. coli’slow mutation rate of 1 mutation per 103generations (Leeet al.2012; Foster et al.2015). Of 11E. colistrains each defective in a major DNA repair pathway, only those unable to repair oxidative damage showed a substantial increase in spontaneous mutation rates (Foster et al.2015). Thus, the major determinants of repli-cation accuracy are the intrinsic fidelity of DNA replication,replication proofreading, and postreplication mismatch repair (MMR).
E. coli’s replicative DNA polymerase, polymerase III (Pol III), is a multiprotein machine. As measuredin vitro, the po-lymerase subunit,a(encoded by thednaEgene), has an in-trinsic error rate of one per 104–105nucleotides incorporated
(Bloomet al.1997). The major determinant of this accuracy is a restrictive active site that sterically prevents most mis-matches (Johnson 2010). The 39 to 59exonuclease of the proofreading subunit of Pol III, e (encoded by the dnaQ
gene), improves accuracy by removing mismatched nucleo-tides, allowing polymerase to resynthesize the DNA.In vitro, proofreading improves the accuracy of DNA synthesis 10- to 100-fold (Bloomet al.1997). Based on the mutation rates of reporter genes, estimates of proofreader’s contribution to replication accuracyin vivohave ranged from 102- to 105-fold
(Fowleret al.1974; Cox and Horner 1982; Schaaper 1988, 1993; Nowosielskaet al.2004). Using an MA protocol, Tsuru
et al.(2015) reported that proofreading improved accuracy only 25-fold (Tsuruet al.2015). However, theE. colistrain used in that study carried a deletion of thednaQgene, and
Copyright © 2018 by the Genetics Society of America
doi:https://doi.org/10.1534/genetics.117.300515
Manuscript received November 14, 2017; accepted for publication June 14, 2018; published Early Online June 15, 2018.
Supplemental material available at Figshare: https://doi.org/10.25386/genetics.
6513035.
1Present address: Computational Biology Department, School of Computer Science,
Carnegie Mellon University, Pittsburgh, PA 15213.
2Corresponding author: Department of Biology, Indiana University, Jordan Hall 142,
such strains rapidly accumulate suppressor mutations in the
dnaE gene, some of which lower the mutation rate (Lancy
et al.1989; Fijalkowska and Schaaper 1995).
To obtain an accurate estimate of the intrinsic error rate of DNA Pol IIIin vivo, proofreading must be eliminated. How-ever, in addition to its proofreading functions,eis an impor-tant structural component of the core polymerase and its loss causes severe growth defects. Partial function alleles ofdnaQcan overcome this problem and allow the contribu-tion of proofreading to the overall mutacontribu-tion rate to be eval-uated (Cox and Horner 1982; Taft-Benz and Schaaper 1998). For the study reported here, we used the mutD5
allele of dnaQ, which reduces the exonuclease activity by 98% while maintaining the core polymerase structure (Fijalkowska and Schaaper 1996; Taft-Benz and Schaaper 1998; Perrino et al. 1999). The mutational phenotypes of the mutD5 allele have been extensively investigated using reporter gene assays (Fowler et al. 1974; Cox and Horner 1982; Schaaper 1988, 1993). Here, we extend this work to the entire chromosome by using an MA protocol followed by WGS.
Several factors complicate the mutational analysis of
mutD5mutant strains. Strains carrying certain mutantdnaQ
alleles are induced to various degrees for the SOS response (Slateret al.1994; Gautamet al.2012; Whatley and Kreuzer 2015), which could alter the mutational profile. In addition, the mutator phenotype ofmutD5mutant strains is medium-dependent; mutation rates are 10- to 1000-fold higher when
mutD5mutant strains are grown on rich medium rather than on minimal medium (Cox and Horner 1982; Schaaper 1988). Finally, as mentioned above, suppressor mutations may arise that could alter the mutational profile.
To obtain a better estimate of the intrinsic error rate of DNA Pol III and a more complete understanding of the role ofein replicationfidelity, we used the MA/WGS approach to ana-lyze the mutation rates and mutational spectra of a mutD5
mutant strain and amutD5 mutant strain also defective in MMR. We evaluated the impact of growth on richvs.minimal media. In addition, we show that the SOS-induced error-prone polymerases do not contribute to the mutation rate or spectra ofE. colistrains carrying themutD5allele.
Materials and Methods
Bacterial strains and media
All strains used in this study, the methods of their construction, and the media used are given in Supplemental Material, Table S1. Genetic constructions were confirmed by PCR analyses using the oligonucleotides listed in Table S2. Further details are in the supplemental materials and methods.
Estimation of mutation rate fromfluctuation assays
Mutation rates were determined as described (Foster 2006; Hallet al.2009), using mutation to nalidixic acid resistance (NalR) as the reporter.
MA experiments
The MA procedure has been described previously (Leeet al.
2012; Fosteret al.2015). Generations were estimated from the colony diameters as previously described (Lee et al.
2012). More details are given in the supplemental materials and methods.
With these highly mutating strains, several precautions were taken to minimize the occurrence of mutations before or during the MA procedure that might modify the mutation rates or spectra. MA lines were initiated from at least two founders so that lines derived from founders that, after se-quencing, proved to carry known mutator or antimutator mutations could be eliminated. The MA procedure was re-stricted to three to six passages to minimize selection. After sequencing, any MA lines that had known mutators or anti-mutators, or had mutation rates.2 SD above or below the mean, were eliminated.
Genomic DNA preparation, library construction, sequencing, and SNP and insertion/deletion calling
Genomic DNA (gDNA) was isolated from an aliquot of an overnight culture (in rich or minimal medium as appropriate) inoculated from freezer stocks made after the last passage of each MA line. That the constructed deletions were present in each MA line was confirmed using diagnostic PCR of the gDNA before library construction; the oligonucleotides used are listed in Table S2. Library construction, sequencing, SNP and insertion/deletion (indel) calling, and mutation annota-tion are described in the supplemental materials and methods. Some MA lines were eliminated because of poor sequence coverage. Identical mutations in two or more lines arose if mutations occurred in the founder colony or if cross contam-ination occurred during streaking. If lines shared.50% of their mutations, then only one line was retained for analysis. If lines shared,50%, each mutation was randomly assigned to only one of the lines.
Estimation of mutation rates from MA experiments
For each experiment, the mutation rate was estimated by dividing the total number of mutations accumulated by all the MA lines by the total number of generations that were un-dergone. This value for mutations per generation was then divided by the appropriate number of sites (A:T sites, G:C sites,
etc.) to give the conditional mutation rate. The individual mutation rates for each line were used to compute confidence limits (CLs) (see the supplemental materials and methods for further details).
Statistical analysis
Standard statistical analysis was used (Zar 1984). Means and CLs were calculated from the MA lines for each experiment as described (Fosteret al.2018). Values and 95% CLs for ratios between variables were calculated as in Rice (1995). The expected values forx2tests were calculated from the
of 1000 Monte Carlo simulations for each strain, as described (Leeet al.2012).
Data availability
Strains are available upon request. File S1 contains the sup-plemental materials and methods. File S2 contains supple-mental tables, which include strain genotypes, methods of strain construction, oligonucleotide sequences, and detailed data from each experiment. File S3 contains supplemental
figures that are referenced in the text. The sequences, SNPs, and indels reported in this paper have been deposited in the National Center for Biotechnology Information Sequence Read Archive [https://trace.ncbi.nlm.nih.gov/Traces/sra/
(accession no. SRP013707)] and in the IUScholarWorks Repository (hdl.handle.net/2022/20340). Supplemental material available at Figshare: https://doi.org/10.25386/ genetics.6513035.
Results
Mutational profile of mutD5 and mutD5 mutL mutant strains growing on rich medium
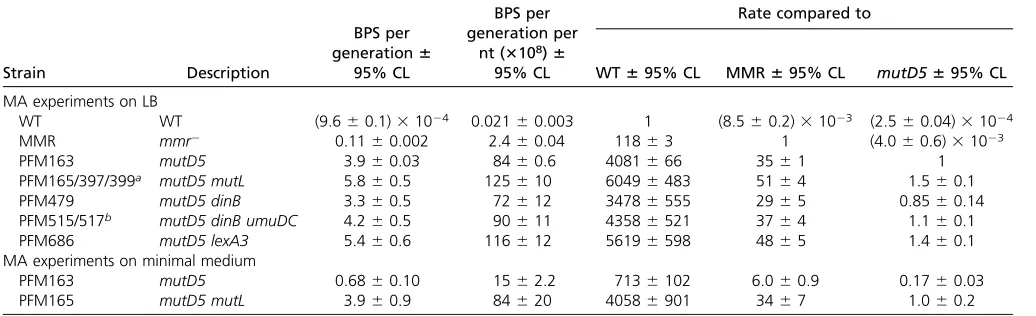
Base pair substitution rates: The base pair substitution (BPS) rate of themutD5mutant strain growing on rich (LB) medium was 84 3 1028 BPS/generation/nt, 4000-fold
greater than that of the wild-type strain and 35-fold greater than that of the MMR-defective strains (Table 1). This increase relative to wild-type is in the middle of the 102–104-fold range reported in previous studies (Fowler et al.1974; Schaaper 1988, 1993; Fijalkowska and Schaaper 1996; Nowosielska et al. 2004). To estimate the intrinsic error rate of DNA Pol III, we deleted themutLgene in the
mutD5mutant strain, creating a strain deficient in the two most important pathways for correcting replication errors:
MMR and proofreading. The BPS rate of the mutD5 mutL
mutant strain was 12531028BPS/generation/nt, 1.5-fold
greater than that of themutD5mutant strain (Table 1), an increase slightly smaller than the 1.6–3.4 range previously reported (Schaaper 1993).
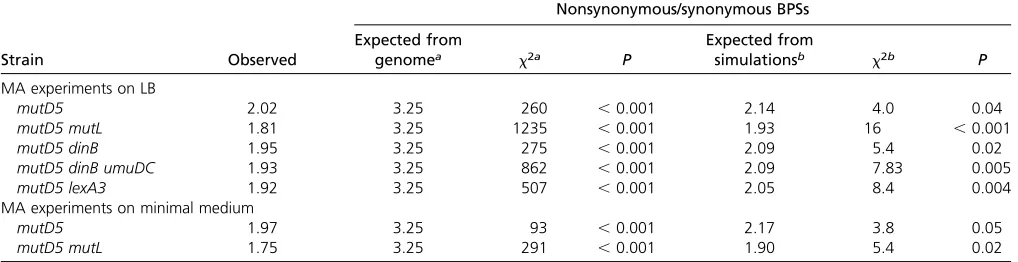
Selective pressure during the MA experiment: Selective pressure is usually evaluated by the ratio of nonsynonymous to synonymous (NS/S) BPSs. Based on the codon usage in
E. coliMG1655, the expected NS/S ratio is 3.25 (Leeet al.
2012), and this was significantly greater than the ratios for themutD5andmutD5 mutLmutant strains (Table 2). One thousand Monte Carlo simulations using the BPS spectra of the mutant strains yielded NS/S ratios of2, slightly (6%), but statistically significantly, greater than the observed ratios (Table 2). Thus, the mutD5 and the mutD5 mutL mutant strains appear to be under mild selective pressure, likely because they have poor viability, as previously observed (Fijalkowska and Schaaper 1996).
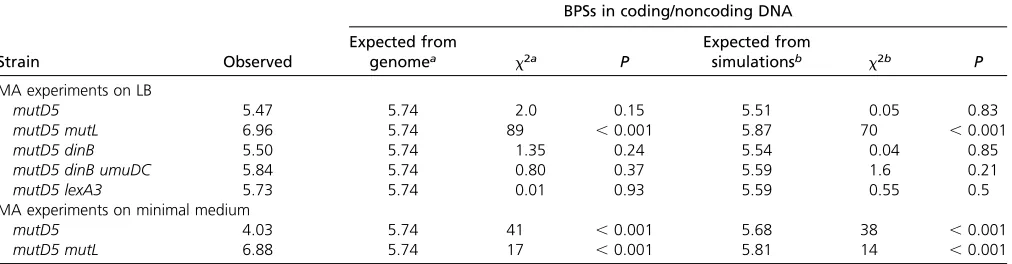
If mutations accumulate in a neutral manner, the number of BPSs in coding and in noncoding (C/NC) DNA should reflect the numbers of base pairs in each (Leeet al.2012). We pre-viously observed that the C/NC ratio was significantly less than expected in wild-type strains, but slightly greater than expected in MMR-defective strains, suggesting that MMR preferentially repairs coding DNA (Lee et al. 2012). The C/NC ratio of the mutD5strain was 5.47, not significantly different from the 5.74 ratio based on the genome or the 5.51 ratio obtained from Monte Carlo simulations using the BPS spectrum of themutD5mutant strain (Table 3). However, the C/NC ratio in the mutD5 mutLmutant strain, 6.96, was a significant 20% greater than the expected ratios both from the genome and from simulations, and 30% greater than the ratio of themutD5strain (x2= 74.5,P,0.001) (Table 3).
Table 1 Comparisons of BPS rates among strains
Strain Description
BPS per generation6
95% CL
BPS per generation per
nt (3108)6 95% CL
Rate compared to
WT695% CL MMR695% CL mutD5695% CL
MA experiments on LB
WT WT (9.660.1)31024 0.02160.003 1 (8.560.2)31023 (2.560.04)31024
MMR mmr2 0.1160.002 2.460.04 11863 1 (4.060.6)31023
PFM163 mutD5 3.960.03 8460.6 4081666 3561 1
PFM165/397/399a mutD5 mutL 5.860.5 125610 60496483 5164 1.560.1
PFM479 mutD5 dinB 3.360.5 72612 34786555 2965 0.8560.14
PFM515/517b mutD5 dinB umuDC 4.260.5 90611 43586521 3764 1.160.1
PFM686 mutD5 lexA3 5.460.6 116612 56196598 4865 1.460.1
MA experiments on minimal medium
PFM163 mutD5 0.6860.10 1562.2 7136102 6.060.9 0.1760.03
PFM165 mutD5 mutL 3.960.9 84620 40586901 3467 1.060.2
95% CLs are the SDs of the BPSs of the MA lines for each strain multiplied by the critical value of thetdistribution (seeMaterials and Methods). All comparisons are with
strains grown on LB medium. Values labeled WT are the combined data from eight MA experiments previously reported (Leeet al.2012; Fosteret al.2015); the strains used
are PFM2, wild-type (two data sets, 3K and 6K generations); PFM35,uvrA; PFM40,alkA tagA; PFM88,ada ogt; PFM91,nfi; PFM101,umuDC dinB; and PFM133,umuDC dinB
polB, all of which had nearly identical BPS rates and spectra. Values labeled MMR are the combined data from 10 experiments withmmr2mutant strains reported in Leeet al.
(2012) and Fosteret al.(2018); the strains used are PFM5,mutL; PFM144,mutL; PFM288,mutL; PFM304,mutLS; PFM342,mutS; PFM343,mutS; PFM555/556,mutS;
PFM197,mutH; and PFM567/568,mutLSH, all of which had nearly identical BPS rates and spectra. BPS, base pair substitution; CL, confidence limit; WT, wild-type; MMR,
Mismatch repair; MA, mutation accumulation; nt, nucleotide.
aTwo separate transductions of theDmutLScallele into themutD5mutant strain, PFM163; PFM397 and PFM399 are two isolates from the same transduction.
However, it was close to the 6.63 reported for amutLmutant strain (Leeet al.2012) (x2= 0.4,P= 0.5), suggesting that
the apparent preference to repair coding DNA in wild-type strains is solely due to MMR, and that proofreader does not have this preference.
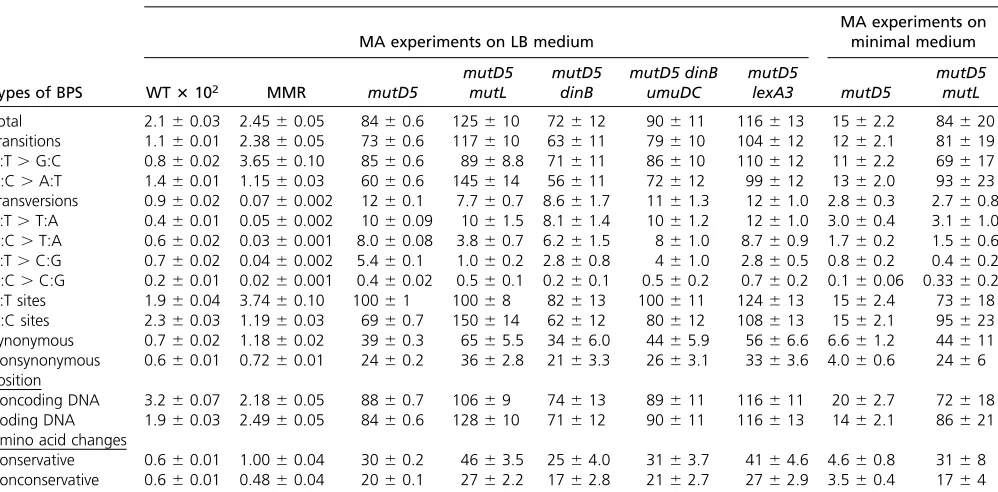
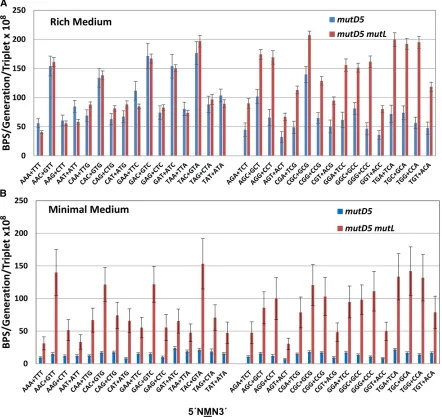
The BPS spectra:The spectrum of BPS accumulated by the
mutD5 mutant strain growing on rich medium is shown in Figure 1A and detailed in Table 4 (the numbers of BPSs are given in Table S3). As has been previously reported (Schaaper 1988, 1993; Fijalkowska and Schaaper 1996; Nowosielska et al.2004), transitions occurred sixfold more frequently than transversions. The A:T transition rate was only 1.4-fold greater than the G:C transition rate (x2 =
138, P , 0.001), less than the threefold observed with MMR-defective strains (Leeet al.2012; Fosteret al.2018). The rates of the various transversions also varied significantly (x2= 501,P,0.001) in the order A:T to T:A.G:C to T:A.
A:T to C:G..G:C to C:G, a pattern similar to that observed for MMR-mutant strains (Leeet al.2012; Fosteret al.2018). Deleting MMR repair in the mutD5 mutLmutant strain resulted in a 2.4-fold increase in the G:C transition rate, which in this strain exceeded the A:T transition rate by 1.6-fold (x2= 1229,P, ,0.001) (Figure 1A, Table 4, and Table
S3). This increase in G:C transitions entirely accounted for the difference in mutation rates between the mutD5 and
mutD5 mutL mutant strains, and resulted in a spectrum of BPSs closely resembling that of the wild-type strain (Table 4). In contrast, other studies have found that the rate of A:T transitions exceeds that of G:C transitions in MMR-defective
mutD5mutant strains (Schaaper 1993) (seeDiscussion). The rates of the various transversions occurred in the same pat-tern in themutD5 mutLmutant strain as in themutD5mutant strain.
The DNA strand bias of BPSs:In MMR-defective strains, A:T transitions are 2.4-fold more frequent when A is on the lagging strand template (LGST) and T is on the leading strand tem-plate (LDST) than in the opposite orientation. Likewise, G:C
transitions are 2.3-fold more frequent when C is on the LGST and G is on the LDST than in the opposite orientation (Leeet al.
2012; Bhagwatet al.2016; Fosteret al.2018). Neither the
mutD5 nor the mutD5 mutL mutant strain exhibited these strong strand biases (Table 5). In themutD5mutant strain, A:T transitions were only 1.17-fold more frequent when A was on the LGST than on the LDST, and there was no strand bias for G:C transitions. In themutD5 mutLmutant strain, A:T and G:C transitions occurred 1.19- and 1.03-fold more fre-quently with A and C on the LGST. While statistically signif-icant, these 10–20% strand biases are much less prominent than the twofold biases exhibited by MMR-defective proof-reading-proficient strains, suggesting that nucleotide misin-corporation during DNA replication is not strand biased but proofreading is (seeDiscussion).
The local sequence context of BPS:The sequence context in which a base pair appears affects its mutability (Lee et al.
2012; Sunget al.2015). In both themutD5and themutD5 mutLmutant strains, the adjacent bases are the most impor-tant determinants (Figures S1 and S2). Therefore, we ana-lyzed the influence of only the bases immediately 59and 39to the mutated base. While there are 64 possible triplets, in double-stranded DNA only 32 are nonredundant. A triplet and its reverse complement (each read 59to 39) are equiva-lent since each pairs with the other on the opposite DNA strand.
As shown in Figure 2, the mutation rate of A:T base pairs in the triplets 59NAC39+59GTN39wastwofold greater than the average rate of A:T base pairs in the other triplets (throughout this report, a triplet and its complement are both presented 59to 39with the mutated base in the middle). This pattern is similar to that observed for both the wild-type and MMR-mutant strains, except that the dominance of 59NAC39+59GTN39sites (10- to 16-fold) was more dramatic in the MMR-defective strains (Lee et al.2012; Fosteret al.
2018). In themutD5mutant strain, the mutation rate of G:C base pairs in the triplets 59NGC39+59GCN39was also about twofold greater than the average mutation rate of G:C base
Table 2 Evaluation of selective pressure during the MA experiments: type of BPS
Nonsynonymous/synonymous BPSs
Strain Observed
Expected from
genomea x2a P
Expected from
simulationsb x2b P
MA experiments on LB
mutD5 2.02 3.25 260 ,0.001 2.14 4.0 0.04
mutD5 mutL 1.81 3.25 1235 ,0.001 1.93 16 ,0.001
mutD5 dinB 1.95 3.25 275 ,0.001 2.09 5.4 0.02
mutD5 dinB umuDC 1.93 3.25 862 ,0.001 2.09 7.83 0.005
mutD5 lexA3 1.92 3.25 507 ,0.001 2.05 8.4 0.004
MA experiments on minimal medium
mutD5 1.97 3.25 93 ,0.001 2.17 3.8 0.05
mutD5 mutL 1.75 3.25 291 ,0.001 1.90 5.4 0.02
BPS, base pair substitution; MA, mutation accumulation.
ax2values were calculated comparing the observed value to the expected value calculated from the ratio of all possible nonsynonymous vs. synonymous changes in the
MG1655 genome, which is 3.25 (Leeet al.2012).
pairs in the other triplets, but in the mutD5 mutL mu-tant strain, this ratio dropped to 1.2- to 1.6-fold. Thus, these sites are not as prominent in themutD5 mutL spectrum as 59NAC39+59GTN39sites. Based on the results from all the strains examined to date, mutations are potentiated by a C 39to the purine or a G 59to the pyrimidine at A:T base pairs and, to a lesser extent, at G:C base pairs. Interestingly, the context bias of BPSs in the mutD5 mutL mutant strain is similar in pattern and relative magnitude to that in the wild-type strain (Figure S3), which will be further discussed below (seeDiscussion).
Conclusions based on the phenotype of mutD5 mutant strains are complicated by the possibility that MMR becomes saturated when proofreader is deficient (Schaaper 1988). Comparison of the mutation rates of themutD5andmutD5 mutL mutant strains (Table 4) indicates that the ability of MMR to prevent A:T mutations was saturated, but not its ability to prevent G:C mutations; the G:C mutation rate of the mutD5 mutant strain increased an additional 2.17 6 0.05-fold with the loss of MMR (mean 6 95% CL) (see
Discussion).
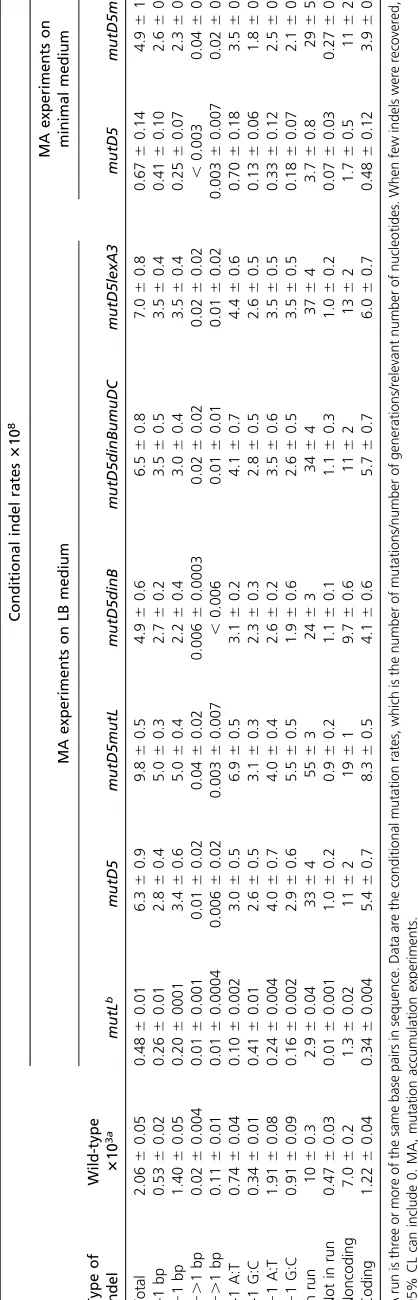
Spontaneous indel rates and spectra:As previously observed for wild-type and MMR-defective strains (Leeet al.2012), in both themutD5andmutD5 mutLmutant strains, the rates of small (#4 bp) indels were one-tenth the BPS rates (Table 6). Also as expected from previous studies (Streisingeret al.1966; Leeet al.2012), in both themutD5and themutD5 mutL mu-tant strains, homopolymeric runs were hotspots for indels and the indel rate increased exponentially with the length of a run (Figure 3A). In the mutD5mutant strain, all types of indels occurred at nearly the same rates. However, in themutD5 mutL
mutant strain, A:T insertions dominated, occurring 1.7-fold more often as A:T deletions (x2= 60,P,0.001) and 2.1-fold
more often as G:C insertions (x2= 108,P,0.001) (Figure 4A
and Table 6). G:C deletions were also prominent, occurring 1.8-fold more frequently than G:C insertions (x2= 56,P,
0.001) and 1.4-fold more frequently than A:T deletions (x2=
23,P,0.001).
Mutational profile of mutD5 and mutD5 mutL mutant strains growing on minimal medium
The BPS profile: Growing strains carrying themutD5 allele on minimal rather than on rich medium lowers the mutation rate (Fowleret al.1974; Cox and Horner 1982; Schaaper 1988). To evaluate the resulting mutational profile, we performed MA/ WGS experiments with the mutD5 and mutD5 mutL mutant strains growing on glucose minimal medium. Relative to growth on rich medium, the BPS rate of themutD5mutant strain de-clined sixfold, to 15 31028BPS/generation/nt, whereas the
BPS rate of themutD5 mutLmutant strain declined only 1.5-fold, to 8431028BPS/generation/nt (Table 4).
The ratios of NS/S BPSs of themutD5and themutD5 mutL
mutant strains growing on minimal medium, 1.97 and 1.75, were significantly less than expected from the genome or from simulations (Table 2), but not significantly different from that observed when the cells were grown on LB medium (x2= 0.4,P= 0.53 andx2= 1.5,P= 0.23, respectively).
Thus, themutD5andmutD5 mutLmutant strains appear to be under some selective pressure whether they are growing on rich or on minimal medium.
The ratio of BPSs in C/NC DNA for themutD5mutant strain grown on minimal medium was significantly less than ex-pected based on the genome or simulations (Table 3), and also significantly less than the ratio obtained when it was grown on rich medium (x2= 31,P,0.001). Thus, the lower
mutation rate of the mutD5strain on minimal medium re-sults in a slight bias for BPSs to occur in noncoding DNA. In contrast, themutD5 mutLmutant strain grown on minimal medium showed the same bias for BPS to occur in coding DNA as it did when it was grown on rich medium (x2=
0.1, P = 0.7) (Table 3). Thus, on both types of media, MMR appears to preferentially prevent mutations in coding DNA, as previously observed (Leeet al.2012).
The BPS spectra for themutD5 andmutD5 mutLstrains grown on minimal medium are shown in Figure 1B and given in Table 4 (also see Figure S4A and Table S3). Overall, the differences in the BPS spectra between the two growth media were modest. When the mutD5 mutant strain was grown
Table 3 Evaluation of selective pressure during the MA experiments: position of BPS
BPSs in coding/noncoding DNA
Strain Observed
Expected from
genomea x2a P
Expected from
simulationsb x2b P
MA experiments on LB
mutD5 5.47 5.74 2.0 0.15 5.51 0.05 0.83
mutD5 mutL 6.96 5.74 89 ,0.001 5.87 70 ,0.001
mutD5 dinB 5.50 5.74 1.35 0.24 5.54 0.04 0.85
mutD5 dinB umuDC 5.84 5.74 0.80 0.37 5.59 1.6 0.21
mutD5 lexA3 5.73 5.74 0.01 0.93 5.59 0.55 0.5
MA experiments on minimal medium
mutD5 4.03 5.74 41 ,0.001 5.68 38 ,0.001
mutD5 mutL 6.88 5.74 17 ,0.001 5.81 14 ,0.001
BPS, base pair substitution; MA, mutation accumulation.
ax2values were calculated comparing the observed value to the expected value calculated from the ratio of codingvs.noncoding nucleotides in the MG1655 genome,
which is 5.74 (Leeet al.2012).
on minimal medium, A:T transitions declined disproportion-ally relative to G:C transitions (7.6-foldvs.4.7-fold;x2= 160, P,0.001). When themutD5 mutLmutant strain was grown on minimal medium, the ratio of transitions to transversions was double the ratio seen when the strain was grown on rich medium, largely due to a threefold decline in the relative rate of transversions. G:C transitions also declined slightly; their rate was 1.3-fold higher than that of A:T transitions (x2=
87P,0.001), compared to 1.6-fold higher when themutD5 mutLmutant strain was grown on LB.
DNA strand bias:Overall, growth on minimal medium did not change the strand biases from those observed when the strains were grown on LB. The one exception was a 1.2-fold increase in the frequency at which G:C transitions occurred with C on the LGST in themutD5mutant strain, which was significantly greater than expected (Table 5).
The local sequence context of BPSs: Growing the mutD5 mutLstrain on minimal medium resulted in nearly the same
pattern of local sequence biases as growth on rich me-dium (Figure 2B). In particular, mutations at A:T base pairs were two- to threefold more frequent in the context 59NAC39+59GTN39, just as they were when the cells were grown on LB, indicating that DNA polymerase makes these errors frequently when cells are growing on either medium. However, in themutD5mutant strain, the influence of the 39C was nearly gone, suggesting that MMR is better able to cor-rect these errors when the cells are growing on minimal me-dium, probably because of the lower error rate (Figure 2B and Figure S4B).
Spontaneous indel rates and spectra: As observed when strains were grown on rich medium, when the mutant strains were grown on minimal medium, indel rates were 10-fold lower than BPS rates (Table 6), homopolymeric runs were hotspots for indels, and the indel rate increased exponen-tially with the length of the run (Figure 3B). The spectra of indels in the two media were also similar (Figure 4B, Figure S5, Table 6, and Table S4). The only striking difference was the dominance of A:T insertions in themutD5mutant strain, which occurred at a twofold higher rate than A:T deletions (x2 = 11,P= 0.001) and a fivefold higher rate than G:C
insertions (x2= 34,P=,0.001.
The SOS response does not contribute to the mutational load of the mutD5 mutant strain
Previous studies have reported that the SOS response is in-duced to various degrees in cells carrying mutant alleles of
dnaQ (Slateret al. 1994; Gautamet al.2012; Whatley and Kreuzer 2015). However, we have not investigated the extent to which SOS may be induced in our strains under the con-ditions of the MA experiments. The SOS response controls the expression of the two error-prone DNA polymerases, DNA Pol IV (encoded by thedinBgene) and Pol V (encoded by the
umuDC genes) (Kenyon and Walker 1980; Fernández de Henestrosaet al.2000), which could contribute to the muta-tional load of themutD5mutant strain. To test this hypothesis, we performed MA/WGS experiments with mutD5 mutant strains in whichdinB, or bothdinBandumuDC, were deleted, or which carried an allele of the SOS repressor, lexA3, that constitutively represses the SOS response (Mountet al.1972). As shown in Tables 1 to 5, deletion of thedinBgene, or both the dinBand theumuDCgenes, in themutD5mutant strain made no significant difference in the BPS rates, spectra, or the other mutational parameters tested. Likewise, the rates and spectra of indels were unaffected by the deletions (Table 6). Surprisingly, the BPS rate of themutD5 lexA3strain was 1.4-fold higher than that of themutD5strain (t= 13, d.f. = 2,
P = 0.005) (Table 4), suggesting that some other LexA-repressed gene may act to prevent some BPSs. Otherwise, thelexA3allele did not affect the mutational profile of the
mutD5mutant strain. All of these results indicate that neither the error-prone polymerases nor the SOS response overall contributes to the mutational load of the mutD5 mutant strain in our MA experiments.
Discussion
The results of our studies ofE. coliwith a deficiency in proof-reading can be summarized as follows.
1. The mutation rate of strains carrying the mutD5mutant allele is4000-fold higher than the mutation rate of the wild-type strain. This factor falls in the middle of previous estimates of 102–105. Loss of MMR increases this factor
1.5-fold.
2. As revealed in a strain defective for both proofreading and MMR, the replicative polymerase, Pol III, has a bias for making the errors that produce transitions, especially A:T transitions at 59NAC39+59GTN39sites and, to a lesser de-gree, G:C transitions at 59NGC39+59GCN39sites. However, overall, the spectrum of replication errors is dominated by G:C transitions.
3. Pol III has little strand bias for making errors. However, proofreading is strand-biased, resulting in the 23 bias observed for G:C transitions in wild-type strains, and for both G:C and A:T transitions in MMR-deficient strains. 4. Both proofreading and MMR have a bias for correcting the
errors that produce A:T transitions, thus these transitions become prominent when either one is defective. Proof-reader is also efficient at correcting the mismatches lead-ing to G:C transitions, but, since these are the more prominent replication errors, G:C transitions dominate the wild-type spectrum.
5. When themutD5mutant strain is grown on minimal me-dium, its mutation rate is sixfold lower than when it is grown on LB, but this factor is only 1.5-fold if MMR is defective.
6. Neither the activities of the error-prone polymerases nor the SOS response overall contributes to the mutation load of themutD5mutant strain.
Our results differ in certain respects to those of previous studies ofmutD5andmutD5 mutLmutant strains. Using muta-tion to LacI2das the reporter, Schaaper (1988, 1993) found that
the BPS spectrum of themutD5mutant strain was dominated by G:C transitions, whereas that of the mutD5 mutLmutant strain was dominated by A:T transitions. In contrast, our results showed that the BPS spectrum of themutD5mutant strain was slightly biased toward A:T transitions, whereas the BPS spec-trum of themutD5 mutLmutant strain was biased toward G:C transitions. There are a number of possible reasons for these differences. First, while the LacI2dphenotype can result from a
number of mutational events (Schaaper and Dunn 1991), the target is only 210 bp and does not include every possible se-quence context in the genome. Second, themutD5alleles may differ. ThemutD5allele used in early studies by Schaaper and others had a long history of passages and genetic manipula-tions. Indeed, we sequenced thednaQgene of a strain derived from the originalmutD5mutant isolate (Degnen and Cox 1974) and discovered that it was actually the gene fromE. coliB, not
E. coliK12. Finally, as mentioned above, these highly mutating
Table 4 Conditional BPS rates during the MA experiments
Conditional BPS rates3108695% CL
MA experiments on LB medium
MA experiments on minimal medium
Types of BPS WT3102 MMR mutD5
mutD5 mutL
mutD5 dinB
mutD5 dinB umuDC
mutD5
lexA3 mutD5
mutD5 mutL
Total 2.160.03 2.4560.05 8460.6 125610 72612 90611 116613 1562.2 84620 Transitions 1.160.01 2.3860.05 7360.6 117610 63611 79610 104612 1262.1 81619 A:T.G:C 0.860.02 3.6560.10 8560.6 8968.8 71611 86610 110612 1162.2 69617 G:C.A:T 1.460.01 1.1560.03 6060.6 145614 56611 72612 99612 1362.0 93623 Transversions 0.960.02 0.0760.002 1260.1 7.760.7 8.661.7 1161.3 1261.0 2.860.3 2.760.8 A:T.T:A 0.460.01 0.0560.002 1060.09 1061.5 8.161.4 1061.2 1261.0 3.060.4 3.161.0 G:C.T:A 0.660.02 0.0360.001 8.060.08 3.860.7 6.261.5 861.0 8.760.9 1.760.2 1.560.6 A:T.C:G 0.760.02 0.0460.002 5.460.1 1.060.2 2.860.8 461.0 2.860.5 0.860.2 0.460.2 G:C.C:G 0.260.01 0.0260.001 0.460.02 0.560.1 0.260.1 0.560.2 0.760.2 0.160.06 0.3360.2 A:T sites 1.960.04 3.7460.10 10061 10068 82613 100611 124613 1562.4 73618 G:C sites 2.360.03 1.1960.03 6960.7 150614 62612 80612 108613 1562.1 95623 Synonymous 0.760.02 1.1860.02 3960.3 6565.5 3466.0 4465.9 5666.6 6.661.2 44611 Nonsynonymous 0.660.01 0.7260.01 2460.2 3662.8 2163.3 2663.1 3363.6 4.060.6 2466 Position
Noncoding DNA 3.260.07 2.1860.05 8860.7 10669 74613 89611 116611 2062.7 72618 Coding DNA 1.960.03 2.4960.05 8460.6 128610 71612 90611 116613 1462.1 86621 Amino acid changes
Conservative 0.660.01 1.0060.04 3060.2 4663.5 2564.0 3163.7 4164.6 4.660.8 3168 Nonconservative 0.660.01 0.4860.04 2060.1 2762.2 1762.8 2162.7 2762.9 3.560.4 1764
Data are the conditional mutation rates, which are the numbers of mutations/numbers of generations/relevant numbers of nucleotides or possible amino acid changes; for
example, the conditional mutation rate of A:T.G:C transitions is the number of A:T.G:C transitions/generations/A:T base pairs in the genome. The 95% CLs are the SDs
of the BPSs of the MA lines for each strain multiplied by the critical value of thetdistribution (seeMaterials and Methods). Data for WT and MMR are from Fosteret al.
strains accumulate mutational enhancers and suppressors that can change the mutational profile.
Because of these considerations, we took precautions to ensure that our results were due only to loss of proofreading. First, we used recombineering to transfer only theE. coliK12
dnaQgene carrying themutD5mutation, a C to T mutation at position 44 of the coding sequence (Fijalkowska and Schaaper 1996), to our parental strain. Before being used in a MA experiment, we sequenced thednaQanddnaEgenes of each derived strain to verify that thednaQgene carried only themutD5mutation and that thednaEgene was wild-type. Also, before use, we performed fluctuation tests to ensure that strains had the expected mutation rates. After sequenc-ing the MA lines, we eliminated any that had known mutators or antimutators, or that had mutation rates.2 SD above or below the mean, which would indicate that unknown muta-tion rate modifiers had appeared during the experiment.
Previous studies have found that MMR is saturated, at least partially, in strains that carry the mutD5 allele (Schaaper 1988). Here, we show that when growing on LB, themutD5 mutL2mutant strain has a BPS rate 1.5-fold higher and an indel rate 1.6-fold higher than themutD5mutant strain, in-dicating that MMR is able to correct errors in the mutD5
strain. While this difference is much less than the120-fold increase in the BPS rate observed when MMR is inactive in a proofreading-proficient strain (Table 1), the number of BPSs that MMR prevents in themutD5mutant strain,2 per gen-eration, is greater than the number that MMR prevents in the wild-type strain, 0.1 per generation. A similar conclusion can be made for the effect of MMR on indel formation;0.2 indels per generation are prevented by MMR in themutD5
mutant background, but only 0.02 in the wild-type back-ground (Table 6 and Lee et al. 2012). However, although MMR may be working at high efficiency in themutD5 mu-tant strain, it clearly cannot drive the mutation rate down to wild-type levels. In addition, when proofreader is defective, MMR appears to be nearly saturated for BPSs at A:T sites but not at G:C sites. Although in the absence of proofreading 59NAC39+59GTN39are hotspots, A:T BPSs also arise at high rates at the other A:T sites, and these are relatively poor substrates for MMR [see the accompanying article in this issue by Fosteret al.(2018)].
Most, if not all, of the increase in mutation rate ofmutD5
mutant strains when growing in LB rather than minimal me-dium is due to the thymidine in LB (Degnen and Cox 1974; Erlich and Cox 1980). The most likely mechanism is a direct interaction between dTTP and ɛ that partially inactivates proofreading (Biswas and Kornberg 1984). Previous work has shown that because of the lower error rate, MMR is not saturated when mutD5 strains are grown on minimal me-dium (Schaaper 1988). From our data, MMR was able to prevent 3 BPSs per generation when themutD5 mutant strain was growing on minimal medium, less than a twofold increase in efficiency over when themutD5mutant strain was growing on LB. Thus, in confirmation of previous results, the sixfold increase in mutation rate when themutD5 strain is growing on LB medium must be due to some factors in addi-tion to further saturaaddi-tion of MMR.
Our data show that neither the SOS response overall, nor the error-prone polymerases specifically, contribute to the mutation rate of strains carrying the mutD5 allele. The error-prone polymerases also did not add to the mutation
Table 5 DNA strand biases of the BPSs accumulated in the MA experiments
LGST LDST LGST/LDST LGST LDST LGST/LDST
Strain Aobs Aexp Aobs Aexp Aobs Aexp Pa Cobs Cexp Cobs Cexp Cobs Cexp Pa
MA experiments on LB
A:T transitions G:C transitions
mutD5 3649 3365 3108 3392 1.17 0.99 ,0.001 2440 2402 2522 2560 0.97 0.94 0.4
mutD5 mutL 7702 7046 6450 7105 1.19 0.99 ,0.001 12194 11628 11824 12390 1.03 0.94 ,0.001
mutD5 dinB 3403 3038 2698 3063 1.26 0.99 ,0.001 2498 2374 2406 2530 1.04 0.94 0.5
mutD5 dinB umuDC 3314 2967 2644 2991 1.25 0.99 ,0.001 2599 2491 2547 2655 1.02 0.94 0.03
mutD5 lexA3 5523 5001 4520 5042 1.22 0.99 ,0.001 4694 4525 4652 4821 1.01 0.94 0.01
A:T transversions G:C transversions
mutD5 613 608 608 613 1.01 0.99 0.8 311 332 374 353 0.83 0.94 0.3
mutD5 mutL 881 899 924 906 0.95 0.99 0.6 299 344 412 367 0.73 0.94 0.02
mutD5 dinB 447 464 485 468 0.92 0.99 0.4 226 275 342 293 0.66 0.94 0.003
mutD5 dinB umuDC 447 489 536 494 0.83 0.99 0.06 282 295 327 314 0.86 0.94 0.5
mutD5 lexA3 643 654 670 659 0.96 0.99 0.67 408 432 484 460 0.84 0.94 0.26
MA experiments on minimal medium
A:T transitions G:C transitions
mutD5 967 855 750 862 1.29 0.99 ,0.001 1073 976 943 1039 1.14 0.94 0.002
mutD5 mutL 1964 1722 1496 1737 1.31 0.99 ,0.001 2555 2342 2284 2496 1.12 0.94 ,0.001
A:T transversions G:C transversions
mutD5 278 289 302 291 0.92 0.99 0.5 133 137 149 145 0.89 0.94 0.8
mutD5 mutL 82 85 89 86 0.92 0.99 0.7 42 48 58 51 0.72 0.94 0.4
LGST, lagging strand template; LDST, leading strand template; obs, observed; exp, expected; MA, mutation accumulation experiments.
aPis the probability of thex2value calculated comparing the observed to the expected values. The expected values were calculated from the ratios of nucleotides of each
rate during MA experiments with wild-type E. coli(Foster
et al.2015). We hypothesize that, in our strains and under our conditions, the SOS response may not be induced to sufficient levels to produce mutations. In support of this hypothesis, overproduction of the mutD5 allele, which is dominant, did not induce the SOS-response as measured by prophage induction (Gautamet al.2012). Whatley and Kreuzer (2015) found that even in highly mutating dnaQ
mutant strains the level of SOS induction, as measured by a
lacZfusion to the SOS-induced genedinD, was only twofold higher than in wild-type strains; these authors concluded that mutation rate and SOS induction were not coupled in
dnaQmutant strains.
In the absence of MMR and proofreading, mutations were biased toward conversion of G:C to A:T base pairs and for creation of +1 A:T indels (Table 4 and Table 6). We assume that these biases are intrinsic to DNA Pol III. A long-standing a hypothesis, called the“A-rule,”postulates that some (but not all) DNA polymerases are biased for binding and inserting As when replicating past abasic sites and certain other DNA lesions [reviewed in Strauss (2002)]. However, this process creates mainly transversions, whereas the spectrum in our MA experiments is dominated by transitions, and also would be unlikely to produce +1 A:T indels. In addition, the esti-mated rate of spontaneous depurination during replication fails by two orders of magnitude to account for the mutation
rates observed in the mutD5 mutant strains (Lee et al.
2012). Thus, our results suggest that DNA Pol III has a preference for inserting A’s even when replicating undam-aged DNA.
The spectrum and context bias of BPSs in themutD5 mutL
mutant strain is similar in pattern and relative magnitude to that in the wild-type strain (Figure S3 and Table 4), suggesting that the effects of MMR and proofreading are synergistic, but nonetheless leave the signature of replica-tion errors to appear in wild-type cells, albeit at a 6000-fold lower rate. Both MMR and proofreading are more efficient at preventing BPSs at A:Ts than at G:Cs, but this factor for
Table 6 Condit io nal rate s o f indels ac cumulate d in the MA experi men ts Conditional indel rates 3 10 8 MA experiments o n L B medium MA experiments on minimal medium Type of indel Wild-type 3 10 3 a mutL b mutD5 mutD5mutL mutD5dinB mutD5dinBumuDC mutD5lexA3 mutD5 mutD5mutL Total 2.06 6 0.05 0.48 6 0.01 6.3 6 0.9 9.8 6 0.5 4.9 6 0.6 6 .5 6 0.8 7.0 6 0.8 0 .67 6 0.14 4.9 6 1.0 +1 bp 0.53 6 0.02 0.26 6 0.01 2.8 6 0.4 5.0 6 0.3 2.7 6 0.2 3 .5 6 0.5 3.5 6 0.4 0 .41 6 0.10 2.6 6 0.5 2 1 b p 1.40 6 0.05 0.20 6 0001 3.4 6 0.6 5.0 6 0.4 2.2 6 0.4 3 .0 6 0.4 3.5 6 0.4 0 .25 6 0.07 2.3 6 0.5 1. 1 b p 0.02 6 0.004 0.01 6 0.001 0 .01 6 0.02 0 .04 6 0.02 0.006 6 0.0003 0.02 6 0.02 0.02 6 0.02 , 0.003 0.04 6 0.06 2. 1 b p 0.11 6 0.01 0.01 6 0.0004 0.006 6 0.02 0.003 6 0.007 , 0.006 0.01 6 0.01 0.01 6 0.02 0.003 6 0.007 0.02 6 0.04 +1 A:T 0.74 6 0.04 0.10 6 0.002 3.0 6 0.5 6.9 6 0.5 3.1 6 0.2 4 .1 6 0.7 4.4 6 0.6 0 .70 6 0.18 3.5 6 0.7 +1 G:C 0.34 6 0.01 0.41 6 0.01 2.6 6 0.5 3.1 6 0.3 2.3 6 0.3 2 .8 6 0.5 2.6 6 0.5 0 .13 6 0.06 1.8 6 0.5 2 1 A :T 1.91 6 0.08 0.24 6 0.004 4.0 6 0.7 4.0 6 0.4 2.6 6 0.2 3 .5 6 0.6 3.5 6 0.5 0 .33 6 0.12 2.5 6 0.6 2 1 G :C 0.91 6 0.09 0.16 6 0.002 2.9 6 0.6 5.5 6 0.5 1.9 6 0.6 2 .6 6 0.5 3.5 6 0.5 0 .18 6 0.07 2.1 6 0.5 In run 1 0 6 0.3 2.9 6 0.04 33 6 45 5 6 32 4 6 33 4 6 43 7 6 4 3.7 6 0.8 2 9 6 5 Not in run 0.47 6 0.03 0.01 6 0.001 1.0 6 0.2 0.9 6 0.2 1.1 6 0.1 1 .1 6 0.3 1.0 6 0.2 0 .07 6 0.03 0.27 6 0.15 Noncoding 7.0 6 0.2 1.3 6 0.02 11 6 21 9 6 19 .7 6 0.6 1 1 6 21 3 6 2 1.7 6 0.5 1 1 6 2 Coding 1.22 6 0.04 0.34 6 0.004 5.4 6 0.7 8.3 6 0.5 4.1 6 0.6 5 .7 6 0.7 6.0 6 0.7 0 .48 6 0.12 3.9 6 0.9 A run is three or more o f the same base p airs in sequence. Data are the conditional mutation rates, which is the number o f mutations/number o f generation s/relevant n umber of nucleotides. When few indels were recovered, the 95% C L can include 0. MA, mutation accumulation experiments. aData from Foster et al. (2015) for strains PFM2, PFM35, PFM40, PFM88, PFM91, PFM101, and PFM122. bCombined results from the mutL mutant strains PFM5, PFM144, a nd PFM288.
MMR is about fourfold whereas for proofreader it is only twofold. Given that replication errors are biased toward G: C transitions, and that proofreader is 40-fold more powerful than MMR but only slightly biased against preventing G:C mutations, the result is that G:C transitions dominate the wild-type spectrum. But within that context, A:T BPSs at 59NAC39+59GTN39sites and, to a lesser degree, G:C BPSs at 59NGC39+59GCN39 sites, are hotspots in every genetic background. These mutations, particularly the A:T muta-tions, are well corrected by MMR but not preferentially corrected by proofreader, and so also appear in the wild-type spectrum.
The G:C content of the E. coli genome is50%. In the absence of error correction, the mutational bias of replication would tend to increase the A:T content unless selection re-versed the trend. The results presented here indicate that proofreading is the major error-correcting activity maintain-ing the G:C content of the genome, reducmaintain-ing the nearly two-fold bias for replacing G:C with A:T base pairs to the 1.4-two-fold bias seen in wild-type cells.
Acknowledgments
We thank the following past members of the P.L.F. labora-tory for technical assistance: H. Bedwell-Ivers, C. P. Coplen, J. Eagan, N. Gruenhagen, N. Ivers, E. Popodi, I. Rameses, D. Simon, K. Smith, K. Storvik, J. P. Townes, and L. Whitson.; Roel Schaaper for the strain provided; and the anonymous reviewers of this paper for helpful suggestions. The National BioResource Project at the (Japanese) National Institute of Genetics provided bacterial strains and plasmids. This work was supported by the National Institutes of Health (T32 GM-007757 to B.A.N.) and the US Army Research Office Multidisciplinary University Research Initiative Award (W911NF-09-1-0444 to P.L.F. and H.T.).
Note added in proof:See Foster et al. 2018 (pp. 1029–
1042) in this issue for a related work.
Literature Cited
Bhagwat, A. S., W. Hao, J. P. Townes, H. Lee, H. Tang et al., 2016 Strand-biased cytosine deamination at the replication fork causes cytosine to thymine mutations in Escherichia coli. Proc. Natl. Acad. Sci. USA 113: 2176–2181. https://doi.org/ 10.1073/pnas.1522325113
Biswas, S. B., and A. Kornberg, 1984 Nucleoside triphosphate binding to DNA polymerase III holoenzyme of Escherichia coli. A direct photoaffinity labeling study. J. Biol. Chem. 259: 7990–7993. Bloom, L. B., X. Chen, D. K. Fygenson, J. Turner, M. O’Donnellet al.,
1997 Fidelity of Escherichia coliDNA polymerase III holoen-zyme. The effects of beta, gamma complex processivity proteins and epsilon proofreading exonuclease on nucleotide misincor-poration efficiencies. J. Biol. Chem. 272: 27919–27930.https:// doi.org/10.1074/jbc.272.44.27919
Cox, E. C., and D. L. Horner, 1982 Dominant mutators in Escher-ichia coli. Genetics 100: 7–18.
Degnen, G. E., and E. C. Cox, 1974 Conditional mutator gene in Escherichia coli: isolation, mapping, and effector studies. J. Bacteriol. 117: 477–487.
Erlich, H. A., and E. C. Cox, 1980 Interaction of anEscherichia coli mutator gene with a deoxyribonucleotide effector. Mol. Gen. Genet. 178: 703–708.https://doi.org/10.1007/BF00337881
Fernández de Henestrosa, A. R., T. Ogi, S. Aoyagi, D. Chafin, J. J. Hayeset al., 2000 Identification of additional genes belong-ing to the LexA regulon in Escherichia coli. Mol. Microbiol. 35: 1560–1572. https://doi.org/10.1046/j.1365-2958.2000. 01826.x
Fijalkowska, I. J., and R. M. Schaaper, 1995 Effects ofEscherichia coli dnaEantimutator alleles in a proofreading-deficientmutD5 strain. J. Bacteriol. 177: 5979–5986.https://doi.org/10.1128/ jb.177.20.5979-5986.1995
Fijalkowska, I. J., and R. M. Schaaper, 1996 Mutants in the Exo I motif of Escherichia coli dnaQ: defective proofreading and in-viability due to error catastrophe. Proc. Natl. Acad. Sci. USA 93: 2856–2861.https://doi.org/10.1073/pnas.93.7.2856
Foster, P. L., 2006 Methods for determining spontaneous muta-tion rates. Methods Enzymol. 409: 195–213. https://doi.org/ 10.1016/S0076-6879(05)09012-9
Foster, P. L., H. Lee, E. Popodi, J. P. Townes, and H. Tang, 2015 Determinants of spontaneous mutation in the bacte-riumEscherichia colias revealed by whole-genome sequenc-ing. Proc. Natl. Acad. Sci. USA 112: E5990–E5999.https:// doi.org/10.1073/pnas.1512136112
Foster, P. L., B. A. Niccum, E. Popodi, J. P. Townes, H. Leeet al., 2018 Determinants of base-pair substitution patterns revealed by whole-genome sequencing of DNA mismatch repair defective Escherichia coli. Genetics 209: 1029–1042
Fowler, R. G., G. E. Degnen, and E. C. Cox, 1974 Mutational specificity of a conditional Escherichia coli mutator, mutD5. Mol. Gen. Genet. 133: 179–191. https://doi.org/10.1007/ BF00267667
Gautam, S., R. Kalidindi, and M. Z. Humayun, 2012 SOS induc-tion and mutagenesis by dnaQ missense alleles in wild type cells. Mutat. Res. 735: 46–50. https://doi.org/10.1016/j. mrfmmm.2012.05.004
Hall, B. M., C. X. Ma, P. Liang, and K. K. Singh, 2009 Fluctuation analysis CalculatOR: a web tool for the determination of muta-tion rate using Luria-Delbruckfluctuation analysis. Bioinfor-matics 25: 1564–1565.https://doi.org/10.1093/bioinformatics/ btp253
Johnson, K. A., 2010 The kinetic and chemical mechanism of high-fidelity DNA polymerases. Biochim. Biophys. Acta 1804: 1041–1048.https://doi.org/10.1016/j.bbapap.2010.01.006
Kenyon, C. J., and G. C. Walker, 1980 DNA-damaging agents stimulate gene expression at specific loci in Escherichia coli. Proc. Natl. Acad. Sci. USA 77: 2819–2823. https://doi.org/ 10.1073/pnas.77.5.2819
Lancy, E. D., M. R. Lifsics, D. G. Kehres, and R. Maurer, 1989 Isolation and characterization of mutants with deletions indnaQ, the gene for the editing subunit of DNA polymerase III in Salmonella typhimurium. J. Bacteriol. 171: 5572–5580.
https://doi.org/10.1128/jb.171.10.5572-5580.1989
Lee, H., E. Popodi, H. Tang, and P. L. Foster, 2012 Rate and molecular spectrum of spontaneous mutations in the bacterium Escherichia coli as determined by whole-genome sequencing. Proc. Natl. Acad. Sci. USA 109: E2774–E2783. https://doi. org/10.1073/pnas.1210309109
Mount, D. W., K. B. Low, and S. J. Edmiston, 1972 Dominant mutations (lex) inEscherichia coliK-12 which affect radiation sensitivity and frequency of ultraviolet light-induced mutations. J. Bacteriol. 112: 886–893.
Nowosielska, A., C. Janion, and E. Grzesiuk, 2004 Effect of de-letion of SOS-induced polymerases, pol II, IV, and V, on spon-taneous mutagenesis in Escherichia coli mutD5. Environ. Mol. Mutagen. 43: 226–234.https://doi.org/10.1002/em.20019
Perrino, F. W., S. Harvey, and S. M. McNeill, 1999 Two functional domains of the epsilon subunit of DNA polymerase III. Biochem-istry 38: 16001–16009.https://doi.org/10.1021/bi991429+
Rice, J. A., 1995 Mathematical Statistics and Data Analysis. Wadsworth Publishing Company, Belmont, CA.
Schaaper, R. M., 1988 Mechanisms of mutagenesis in the Escher-ichia coli mutatormutD5: role of DNA mismatch repair. Proc. Natl. Acad. Sci. USA 85: 8126–8130.https://doi.org/10.1073/ pnas.85.21.8126
Schaaper, R. M., 1993 Base selection, proofreading, and mis-match repair during DNA replication in Escherichia coli. J. Biol. Chem. 268: 23762–23765.
Schaaper, R. M., and R. L. Dunn, 1991 Spontaneous mutation in theEscherichia coli lacIgene. Genetics 129: 317–326.
Slater, S. C., M. R. Lifsics, M. O’Donnell, and R. Maurer, 1994 holE, the gene coding for the theta subunit of DNA polymerase III of Escherichia coli: characterization of aholE mutant and comparison with adnaQ (epsilon-subunit) mu-tant. J. Bacteriol. 176: 815–821. https://doi.org/10.1128/ jb.176.3.815-821.1994
Strauss, B. S., 2002 The“A”rule revisited: polymerases as deter-minants of mutational specificity. DNA Repair (Amst.) 1: 125– 135.https://doi.org/10.1016/S1568-7864(01)00014-3
Streisinger, G., Y. Okada, J. Emrich, J. Newton, A. Tsugita et al., 1966 Frameshift mutations and the genetic code. Cold Spring Harb. Symp. Quant. Biol. 31: 77–84.https://doi.org/10.1101/ SQB.1966.031.01.014
Sung, W., M. S. Ackerman, J. F. Gout, S. F. Miller, E. Williams et al., 2015 Asymmetric context-dependent mutation pat-terns revealed through mutation-accumulation experiments. Mol. Biol. Evol. 32: 1672–1683. https://doi.org/10.1093/ molbev/msv055
Taft-Benz, S. A., and R. M. Schaaper, 1998 Mutational analysis of the 39/59 proofreading exonuclease of Escherichia coliDNA polymerase III. Nucleic Acids Res. 26: 4005–4011.https://doi. org/10.1093/nar/26.17.4005
Tsuru, S., Y. Ishizawa, A. Shibai, Y. Takahashi, D. Motookaet al., 2015 Genomic confirmation of nutrient-dependent mutability of mutators in Escherichia coli. Genes Cells 20: 972–981.
https://doi.org/10.1111/gtc.12300
Whatley, Z., and K. N. Kreuzer, 2015 Mutations that separate the functions of the proofreading subunit of theEscherichia coli rep-licase. G3 (Bethesda) 5: 1301–1311.https://doi.org/10.1534/ g3.115.017285
Zar, J. H., 1984 Biostatistical Analysis. Prentice Hall, Englewood Cliffs, NJ.