An approach for Recognition of Numeric
Character using Principal Component
Analysis
Sudipto Basak1, Md. Iqbal Qurashi2
Department of Information Technology, Kalyani Government Engineering College, West Bengal, India1
Department of Information Technology, Kalyani Government Engineering College, West Bengal, India2
ABSTRACT: Digital Image Processing has contributed a lot in research domain. In this paper we mainly concentrate
on recognition of English numeric characters. At first we have collected lots of sample of numeric character images of 0-9 and then resize them into a fixed dimension. Then we have performed a thresholding operation based on similarity of pixel value in gray scale to get the binary images. After getting those binary images feature extraction have been performed to collect different property like area, eccentricity, Euler no, major & minor axis length etc. Then feature reduction is performed. After that well-known Principal Component Analysis (PCA) has been run over selected data. Finally classification of each numeric character has been done based on the results obtained from application of PCA. At last different graph has plotted to check the accuracy and efficiency of the proposed system.
KEYWORDS: Euler Number, Principal Component Analysis, Digital Image Processing, Numeric Character Images
I. INTRODUCTION
It is well known that lots of research have been done in the image processing field and various method have been proposed in recognition character of different language. Before proceeding to our approach we will go through some of well known work related to character recognition.
Rakesh Kumar Mondal et. el. [1] suggested column wise segmentation of binary images followed by fed back the result to ANN. Before proceeding image has been resized and compressed to a specific value in order to eliminate non-informatics value of image matrix. Comparison of Multilayer Perceptron, Neural Network, Stroke method have been described in [2].
In [3] author proposes new concept like boundary detection, normalization of binary images and finally the result is run into feed forward neural network. Similar data are deleted in order to extract boundary. In Normalization process specific rows and column are selected. Application of Convolution Neural Network (CNN) with LeNet-5 CNN model has been proposed in [4]. From this paper we understand the detail architecture of LeNet-5 model, its step by step implementation and its application towards character recognition.
Lots of research have been done in Optical Character Recognition (OCR) [5] so far, but not limited only in recognition of character rather than it is extended towards text to speech conversion as described in [6]. It can be used in modern day’s android platform as well as in various sectors. Introduction of Touch less English Character (TER) have been proposed in [7]. Webcam is used in sensing of color object and Scale Conjugate Gradient (SCG) method along with ANN has been used for faster training process.
Application of Hidden Markov Model (HMM) along with Sobel Mask based feature extraction is introduced in [8]. Concentration is given on direction of strokes of handwritten character [8][9]. Besides ANN, Kohonen self organization map is used for pattern classification [10] which help to tolerate with changing condition of input. Zonal wise segmentation along with 40 point feature extraction method is introduced in [11].
PCA, linear discriminant analysis and SVM. Recognition of Arabic character has been demonstrated in [14]. Classification and feature extraction using PCA have been suggested in [15].
Muhammad Naeem Ayyaz1 et. el. [16] proposed a hybrid feature extraction method for recognition of handwritten character which includes SVM based classification. Li Fangyi et. El [17] proposed an efficient approach for Chinese character recognition. Fuzzy-entropy based metric has been used for recognition and classification. Besides Chinese Japanese character recognition has been presented by Sobu Y. et. El [18]. In this paper author proposes a binary-tree based clustering approach to reduce time consumption. Recognition in these languages is more troublesome and time consuming because of their no. and similar character type.
The rest of the paper has been presented as follows. Section II describes step by step of our implementation of our proposed approach which includes sample collection, feature extraction and application of PCA. Results and discussion are stated in Section III and we conclude the paper in Section IV.
II. IMPLEMENTATION
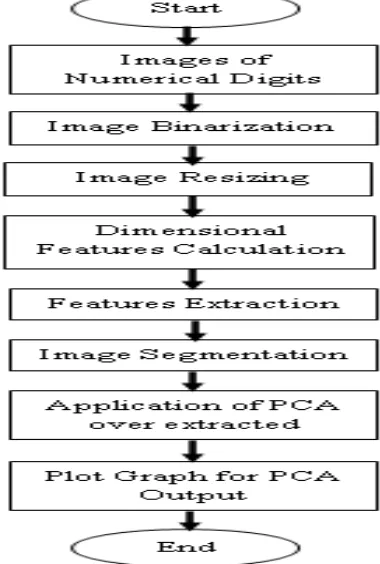
In this section of the paper we describe step by step implementation of our proposed approach. Besides implementation we also provide Flowchart for better understanding of our proposed approach. Flowchart has been provided in Figure 1.
Figure 1: Flowchart of our Proposed Approach
Step 1: Sample collection
As we are interested only in English numerical character recognition we have collected nearly 25-30 samples for every digit. For our working purpose we have collected different types of numeric character images from internet. Here we have demonstrated some of our samples taken for our work as shown in Figure 2.
After collection, we resize each of our samples into 25 X 25 image matrix that will give us standard result for a fixed dimension. After this step we have performed Feature classification.
Step 2: Image Binarization
In this section we have performed several operations on the collected samples and extract some features from them. At first all the samples are converted to gray scale to carry out our operation. Then we converted these images into binary images by applying a suitable thresholding algorithm over it. Instead of fix any particular value for thresholding we concentrated on similarity of pixel value for our working purpose. Finally we converted the resultant image matrix consists of two values, i.e. 255 for white and 0 for black. To get consistent result we fixed black and white as foreground and background color respectively. Here we also demonstrated some of our samples after performing thresholding as shown in Figure 3.
Figure 3: Binarization output of input image
After obtaining binary images we calculate some dimensional feature that will require for our working purpose. Some of those features that we figured out are area, Euler no, eccentricity, orientation, equivalence diameter, major and minor axis length etc. We also provided a snapshot of some of our calculated feature in the next section.
Step 4: Image Segmentation
We not only restricted our interest on the above mentioned features. We also extended our interest of segmenting of these binary images. We segment every image into four parts and then calculate no of black pixel, i.e. value 0 in image matrix in each of those parts. These features add extra benefit of our procedure. Here we also demonstrated sectional segmentation as shown in Figure 4. We mainly give names like 1st, 2nd, 3rd, 4th quadrant for our four segmented section which is similar with conventional geometry system. Beside segmentation we calculate the no of black pixel for each quadrant which are demonstrated in Table 2.1-2.10.
Figure 4: Segmentation of Binary image
Step 4: Feature Reduction
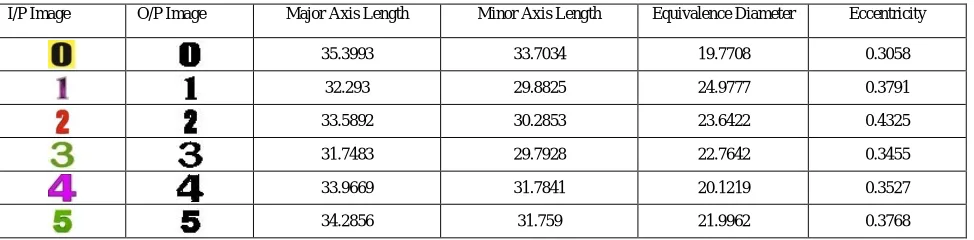
As we mentioned of our calculated feature in our previous section, we have realized that some of these feature are extraneous, i.e. they contribute almost same value for all types of samples. So we reject those features and concentrated on those features that give us variable output for different samples. Here we demonstrated those features in Table 1 that are taken for granted.
Table 1: Calculation of Dimensional Feature
I/P Image O/P Image Major Axis Length Minor Axis Length Equivalence Diameter Eccentricity
35.3993 33.7034 19.7708 0.3058
32.293 29.8825 24.9777 0.3791
33.5892 30.2853 23.6422 0.4325
31.7483 29.7928 22.7642 0.3455
33.9669 31.7841 20.1219 0.3527
36.0208 33.215 19.0158 0.3869
33.6677 28.8176 23.5883 0.5171
31.184 30.2231 20.2795 0.2463
31.6856 30.5779 19.9949 0.2621
Step 5: Application of PCA
In this section of our paper we combine our entire extracted feature and run PCA algorithm over it to get the desired output. As it is well known that PCA concentrated on statistical technique, we use this concept for our work. We run PCA over both of our output calculated over dimensional feature and sectional segmentation as mentioned in the previous step. We get a specific range of values as an output of PCA for each of the data item.
III. RESULTS AND DISCUSSION
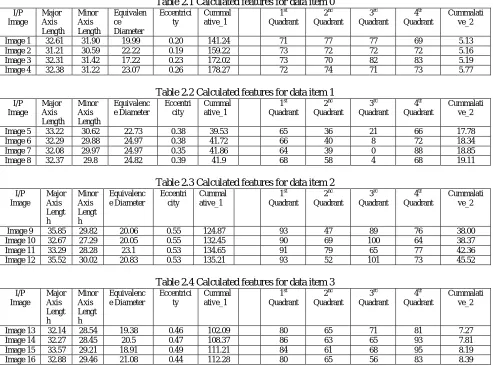
In this section we have shown dimensional feature values along with segmentation output of every data item. Besides we add an attribute named “cumulative” which we got by performing PCA over the values of extracted features. Since it is quite tedious to show these values of every data item we have shown just a few of them to present our result. We also rounded off the obtained result and also ignore exponent part of it for easy representation. It is demonstrated in Table 2.1-2.10.
Table 2.1 Calculated features for data item 0
I/P Image Major Axis Length Minor Axis Length Equivalen ce Diameter Eccentrici ty Cummal ative_1 1st Quadrant 2nd Quadrant 3rd Quadrant 4th Quadrant Cummalati ve_2
Image 1 32.61 31.90 19.99 0.20 141.24 71 77 77 69 5.13
Image 2 31.21 30.59 22.22 0.19 159.22 73 72 72 72 5.16
Image 3 32.31 31.42 17.22 0.23 172.02 73 70 82 83 5.19
Image 4 32.38 31.22 23.07 0.26 178.27 72 74 71 73 5.77
Table 2.2 Calculated features for data item 1
I/P Image Major Axis Length Minor Axis Length Equivalenc e Diameter Eccentri city Cummal ative_1 1st Quadrant 2nd Quadrant 3rd Quadrant 4th Quadrant Cummalati ve_2
Image 5 33.22 30.62 22.73 0.38 39.53 65 36 21 66 17.78
Image 6 32.29 29.88 24.97 0.38 41.72 66 40 8 72 18.34
Image 7 32.08 29.97 24.97 0.35 41.86 64 39 0 88 18.85
Image 8 32.37 29.8 24.82 0.39 41.9 68 58 4 68 19.11
Table 2.3 Calculated features for data item 2
I/P Image Major Axis Lengt h Minor Axis Lengt h Equivalenc e Diameter Eccentri city Cummal ative_1 1st Quadrant 2nd Quadrant 3rd Quadrant 4th Quadrant Cummalati ve_2
Image 9 35.85 29.82 20.06 0.55 124.87 93 47 89 76 38.00
Image 10 32.67 27.29 20.05 0.55 132.45 90 69 100 64 38.37
Image 11 33.29 28.28 23.1 0.53 134.65 91 79 65 77 42.36
Image 12 35.52 30.02 20.83 0.53 135.21 93 52 101 73 45.52
Table 2.4 Calculated features for data item 3
I/P Image Major Axis Lengt h Minor Axis Lengt h Equivalenc e Diameter Eccentrici ty Cummal ative_1 1st Quadrant 2nd Quadrant 3rd Quadrant 4th Quadrant Cummalati ve_2
Image 13 32.14 28.54 19.38 0.46 102.09 80 65 71 81 7.27
Image 14 32.27 28.45 20.5 0.47 108.37 86 63 65 93 7.81
Image 15 33.57 29.21 18.91 0.49 111.21 84 61 68 95 8.19
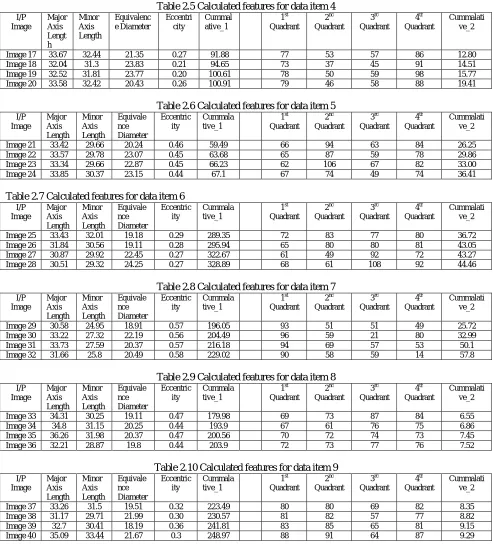
Table 2.5 Calculated features for data item 4 I/P Image Major Axis Lengt h Minor Axis Length Equivalenc e Diameter Eccentri city Cummal ative_1 1st Quadrant 2nd Quadrant 3rd Quadrant 4th Quadrant Cummalati ve_2
Image 17 33.67 32.44 21.35 0.27 91.88 77 53 57 86 12.80
Image 18 32.04 31.3 23.83 0.21 94.65 73 37 45 91 14.51
Image 19 32.52 31.81 23.77 0.20 100.61 78 50 59 98 15.77
Image 20 33.58 32.42 20.43 0.26 100.91 79 46 58 88 19.41
Table 2.6 Calculated features for data item 5
I/P Image Major Axis Length Minor Axis Length Equivale nce Diameter Eccentric ity Cummala tive_1 1st Quadrant 2nd Quadrant 3rd Quadrant 4th Quadrant Cummalati ve_2
Image 21 33.42 29.66 20.24 0.46 59.49 66 94 63 84 26.25
Image 22 33.57 29.78 23.07 0.45 63.68 65 87 59 78 29.86
Image 23 33.34 29.66 22.87 0.45 66.23 62 106 67 82 33.00
Image 24 33.85 30.37 23.15 0.44 67.1 67 74 49 74 36.41
Table 2.7 Calculated features for data item 6
I/P Image Major Axis Length Minor Axis Length Equivale nce Diameter Eccentric ity Cummala tive_1 1st Quadrant 2nd Quadrant 3rd Quadrant 4th Quadrant Cummalati ve_2
Image 25 33.43 32.01 19.18 0.29 289.35 72 83 77 80 36.72
Image 26 31.84 30.56 19.11 0.28 295.94 65 80 80 81 43.05
Image 27 30.87 29.92 22.45 0.27 322.67 61 49 92 72 43.27
Image 28 30.51 29.32 24.25 0.27 328.89 68 61 108 92 44.46
Table 2.8 Calculated features for data item 7
I/P Image Major Axis Length Minor Axis Length Equivale nce Diameter Eccentric ity Cummala tive_1 1st Quadrant 2nd Quadrant 3rd Quadrant 4th Quadrant Cummalati ve_2
Image 29 30.58 24.95 18.91 0.57 196.05 93 51 51 49 25.72
Image 30 33.22 27.32 22.19 0.56 204.49 96 59 21 80 32.99
Image 31 33.73 27.59 20.37 0.57 216.18 94 69 57 53 50.1
Image 32 31.66 25.8 20.49 0.58 229.02 90 58 59 14 57.8
Table 2.9 Calculated features for data item 8
I/P Image Major Axis Length Minor Axis Length Equivale nce Diameter Eccentric ity Cummala tive_1 1st Quadrant 2nd Quadrant 3rd Quadrant 4th Quadrant Cummalati ve_2
Image 33 34.31 30.25 19.11 0.47 179.98 69 73 87 84 6.55
Image 34 34.8 31.15 20.25 0.44 193.9 67 61 76 75 6.86
Image 35 36.26 31.98 20.37 0.47 200.56 70 72 74 73 7.45
Image 36 32.21 28.87 19.8 0.44 203.9 72 73 77 76 7.52
Table 2.10 Calculated features for data item 9
I/P Image Major Axis Length Minor Axis Length Equivale nce Diameter Eccentric ity Cummala tive_1 1st Quadrant 2nd Quadrant 3rd Quadrant 4th Quadrant Cummalati ve_2
Image 37 33.26 31.5 19.51 0.32 223.49 80 80 69 82 8.35
Image 38 31.17 29.71 21.99 0.30 230.57 81 82 57 77 8.82
Image 39 32.7 30.41 18.19 0.36 241.81 83 85 65 81 9.15
Image 40 35.09 33.44 21.67 0.3 248.97 88 91 64 87 9.29
Figure: 5a PCA output of Dimensional Feature 5b PCA output of Segmentation
IV. CONCLUSION
From the previous section we see that in figure 5a we can distinguish every data item and in figure 5b only image value 7 shows the overlapping section. This is the only limitation of our proposed approach. Our proposed approach gives satisfactory result. As we can see calculating PCA for dimensional feature and segmentation give some overlapping values. So for better result we combine these two outputs for more potent result.
REFERENCES
[1]Rakesh Kumar Mondal, N R Manna, “Hand Written English Character Recognition using Column-wise Segmentation of Image Matrix (CSIM)”, WSEAS TRANSACTIONS on COMPUTERS.
[2]Tirtharaj Das, Tanistha Nayak, “ English Character Recognition using Artificial Neural Network”, Proceedings of National Conference on AIRES-2012, Andhra University.
[3]Md Fazlul Kader and Kaushik Deb,” Neural Network Based English Alphanumeric Character Recognition”, International Journal of Computer Science, Engineering and Applications (IJCSEA) Vol.2, No.4, August 2012.
[4]Aiquan Yuan, Gang Bai, Lijing Jiao, Yajie Liu,” Offline Handwritten English Character Recognition based on Convolutional Neural Network”, 2012 10th IAPR International Workshop on Document Analysis Systems.
[5]Shalin A. Chopra, Amit A. Ghadge, Onkar A. Padwal, Karan S. Punjabi, Prof. Gandhali S. Gurjar, “Optical Character Recognition”, International Journal of Advanced Research in Computer and Communication Engineering Vol. 3, Issue 1, January 2014.
[6]Ravina Mithe, Supriya Indalkar, Nilam Divekar, “Optical Character Recognition”, International Journal of Recent Technology and Engineering (IJRTE) ISSN: 2277-3878, Volume-2, Issue-1, March 2013.
[7]Bikash Chandra Karmokar, M. A. Parvez Mahmud, Md. Kibria Siddiquee, Kawser Wazed Nafi, Tonny Shekha Kar, “Touchless Written English Characters Recognition using Neural Network”, International Journal of Computer & Organization Trends –Volume2Issue3- 2012.
[8] Binod Kumar Prased, Goutam Sanyal,” A Model Approach to Off-line English Character Recognition”, International Journal of Scientific and Research Publications Volume 2, Issue 6, June 2012.
[9]Hailong Liu and Xiaoqing Ding “Handwritten Character recognition Using Gradient feature and Quadratic Classifier with Multiple Discrimination Schemes, Proceedings of the 2005Eight International Conference on Document Analysis and Recognition (ICDAR’ 2005). [10]Dr. Pankaj Agarwal, “Hand-Written Character Recognition Using Kohonen Network”, IJCST Vol. 2, Issue 3, September 2011.
[11]Sandeep Saha, Nabarag Paul, Sayam Kumar Das, Sandip Kundu,” Optical Character Recognition using 40-Point Feature Extraction and Artificial Neural Network”, IJARCSSE, Volume 3 Issue 4 April 2013.
[12]B.B. Chaudhuri and A. Majumdar, “Curvelet–based Multi SVM Recognizer for Offline Handwritten Bangla: A Major Indian Script”, In Proceedings of Ninth International Conference on Document Analysis and Recognition (ICDAR), 2007.
[14]Abdelwadood Mesleh, Ahmed Sharadqh, Jamil Al-Azzeh, MazenAbu-Zaher, Nawal Al-Zabin, Tasneem Jaber, Aroob Odeh, and Myssa'a Hasn, “An Optical Character Recognition”, Contemporary Engineering Sciences, Vol. 5, 2012, no. 11, 521 – 529.
[15]J. Novakovic, S. Rankov, “Classification Performance Using Principal Component Analysis and Different Value of the Ratio R”, Int. J. of Computers, Communications & Control, ISSN 1841-9836, E-ISSN 1841-9844 Vol. VI (2011), No. 2 (June), pp. 317-327.
[16]Muhammad Naeem Ayyaz, Imran Javed and Waqar Mahmood 1 2: Handwritten Character Recognition Using Multiclass SVM Classification with Hybrid Feature Extraction, Pak. J. Engg. & Appl. Sci. Vol. 10, Jan., 2012 (p. 57-67).
[17]Li Fangyi, Shen Qiang, Li Ying, Parthalain Neil Mac, “A fuzzy image congealing-based handwritten Chinese character recognition and classification system”, Computational Intelligence (UKCI), 2014 14th UK Workshop.