MOUSE GENETIC RESOURCES
Varying Coef
fi
cient Models for Mapping
Quantitative Trait Loci Using Recombinant
Inbred Intercrosses
Yi Gong and Fei Zou1
Department of Biostatistics, University of North Carolina at Chapel Hill, Chapel Hill, North Carolina 27599
ABSTRACTThere has been a great deal of interest in the development of methodologies to map quantitative trait loci (QTL) using experimental crosses in the last 2 decades. Experimental crosses in animal and plant sciences provide important data sources for mapping QTL through linkage analysis. The Collaborative Cross (CC) is a renewable mouse resource that is generated from eight genetically diverse founder strains to mimic the genetic diversity in humans. The recombinant inbred intercrosses (RIX) generated from CC recombinant inbred (RI) lines share similar genetic structures ofF2individuals but with up to eight alleles segregating at any one locus. In contrast toF2mice, genotypes of RIX can be inferred from the genotypes of their RI parents and can be produced repeatedly. Also, RIX mice typically do not share the same degree of relatedness. This unbalanced genetic relatedness requires careful statistical modeling to avoid false-positive findings. Many quantitative traits are inherently complex with genetic effects varying with other covariates, such as age. For such complex traits, if phenotype data can be collected over a wide range of ages across study subjects, their dynamic genetic patterns can be investigated. Parametric functions, such as sigmoidal or logistic functions, have been used for such purpose. In this article, we propose a flexible nonparametric time-varying coefficient QTL mapping method for RIX data. Our method allows the QTL effects to evolve with time and naturally extends classical parametric QTL mapping methods. We model the varying genetic effects nonparametrically with the B-spline bases. Our model investigates gene-by-time interactions for RIX data in a very flexible nonparametric fashion. Simulation results indicate that the varying coefficient QTL mapping has higher power and mapping precision compared to parametric models when the assumption of constant genetic effects fails. We also apply a modified permutation procedure to control overall significance level.
D
URING the past 2 decades, there has been considerable development in statistical methodologies for mapping quantitative trait loci (QTL), since Lander and Botstein (1989) implemented a maximum-likelihood approach to the interval-mapping technique (Goldgar 1990; Amos 1994; Jansen and Stam 1994; Zeng 1994; Almasy and Blangero 1998; Kaoet al.1999; Zouet al.2001; Xuet al.2005). In addition to the interval-mapping approach, many other statistical approaches have been used in QTL map-ping, such as regression analyses (Haley and Knott 1992)
and Bayesian approaches (Satagopanet al.1996; Sillanpaa and Arjas 1998; Yi and Xu 2000; Yi 2004; Hoeschele 2007).
While these methods have been instrumental for QTL identification, they are not able to capture the temporal pattern of QTL effect. Many quantitative traits, such as body size, are inherently too complex to be described by a single value, because their phenotypes, for example, change with age. Instead of being measured at onefixed time point, each subject’s phenotype may be measured at different time points across samples, which allows us to study genetic effects that vary with the change of time. For example, ge-netic correlations among age-specific weights in a laboratory population of rats were shown to involve variable gene ac-tion at different ages (Cheverudet al.1983). Vaughnet al.
(1999) located QTL responsible for age-specific weights in mice, and they found that some QTL affect the early growth patterns and some affect the late growth patterns. To study
Copyright © 2012 by the Genetics Society of America doi: 10.1534/genetics.111.132522
Manuscript received July 10, 2011; accepted for publication November 17, 2011 Supporting information is available online athttp://www.genetics.org/lookup/suppl/ doi:10.1534/genetics.111.132522/-/DC1
genetic determination of such functional traits, Wu and col-leagues (Maet al.2002; Wuet al.2002, 2004; Lin and Wu 2006) developed the functional mapping approach. They used growth curve data as an example of functional traits, and the genetic effect was modeled by a parametric function such as sigmoidal or logistic function (Maet al.2002). While the parametric nature of functional mapping offers tremen-dous biological and statistical advantages, a reliance on the availability of mathematical functions limits its applicability (Yanget al.2009).
Varying coefficient models are very useful statistical tools for exploring dynamic effects. The varying coefficient models were introduced by Cleveland et al. (1991), and discussed by Hastie and Tibshirani (1993) in more detail, to extend the applications of local regression techniques from one-dimensional to multidimensional settings. In varying coefficient models, there are many ways to model the function of the varying effect, such as polynomials, Fourier series, piecewise polynomials, and more general nonparametric functions (Hastie and Tibshirani 1993). For nonparametric varying-coefficient models, various ba-sis systems can be used, and the most common choice is the B-spline basis (He and Shi 1998; Pittman 2002; Huang
et al. 2004; Wang et al. 2007, 2008). One advantage of B-splines over some other nonparametric approaches, like smoothing splines, is that the smoother matrix is indepen-dent of the responses. Yanget al.(2009) proposed a non-parametric functional mapping framework for genetic mapping of QTL controlling for a dynamic trait, imple-mented with B-splines.
Although important, QTL mapping in humans is difficult, time consuming, expensive, and hampered by ethical prob-lems and uncontrollable environments. These obstacles are nearly all overcome in laboratory mice. Furthermore, most human genes have functional mouse counterparts and both genomes are organized similarly. Hence, the laboratory mouse has become an important model organism in mapping QTL related to human disease. Recombinant inbred (RI) lines have contributed greatly to genetic dissection of simple and complex traits. A major advantage of RI panels over other commonly used mapping approaches is their ability to support genetic mapping and correlations among many traits, even under different environmental conditions (Plomin et al. 1991). However, the traditional inbred mice have a limited amount of variation (Darvasi 1998). Typical mouse RI panels have only 15–35 strains from a single pair of parental inbred lines (Zou et al.
2005; Tsaihet al.2005). This is a particularly acute problem when one wants to examine numerous gene–environment interactions or study disease progression at many stages and ages (Zouet al.2005). Mouse RI panels generally have low power and precision compared to other resources because of their small size.
The Collaborative Cross (CC) project (Threadgill et al.
2002; Churchill et al. 2004; Collaborative Cross Consor-tium 2012) has been carried out to create a large panel
of new RI mouse strains. The CC RI lines are generated from an eight-way cross using eight genetically diverse founder strains, which makes the CC RI lines closer to natural populations than regular RI lines with more genetic variation. A novel derivative of RI lines, called recombinant inbred intercrosses (RIX), has been designed that permits repeated interrogations of afixed genotype to reduce non-genetic variance while increasing the power of the original RI panel (Threadgillet al.2002; Collaborative Cross Con-sortium 2012). The RIX panel is created as F1 hybrids of RI lines. Linkage analyses can be performed, using these resources, to fine map genetic loci that are responsible for most inheritable complex traits. Since all RI mice are homozygous at each locus, the genotypes of the derivative RIX mice will be known in advance by imputing from the genotypes of the parental RI lines. RIX mice with identical genotypes can be regenerated whenever needed. Com-pared to RI, the RIX design has several advantages that include twice the number of recombination sites in a single individual since each is derived from two parental RI, dom-inance effects can be estimated, there is a large expansion of different RIX genomes over the parental RI, and, because of the buffering capacity of their heterogeneous genome structure, RIX genomes should provide more reliable trait means than the parental RIs. The RIX approach also has advantages over classical crosses like the F2 design since
each RIX has a higher recombination density than a single
F2individual when performing interval mapping (Broman
2005; Broman 2012), RIX are especially useful for long-term collaborative research because their genotypes are renewable making the phenotypic data cumulative within the research community, and since RIX genomes are easily replicated, experiments with different environmental vari-ables or temporal relationships can be performed on the same genotypes. At the individual level, although the ge-nome of each RIX mouse has similar genetic structures of
F2 individuals, statistical analyses for F2 data cannot be
directly applied to RIX data. This is because some RIX indi-viduals share a common parental RI line, making them genetically more related to each other than those that do not share any parental lines. Several QTL mapping meth-ods have been introduced (Zou et al. 2005; Tsaih et al.
2005; Yuanet al.2011) for dealing with the special genetic structure of RIX data. However, none has considered the situation in which the QTL effect varies with other covari-ates. In this study, we propose a new method to properly model both the (time) varying genetic effects and the genetic complexity of RIX data. The proposed model inves-tigates gene-by-time interactions in aflexible nonparamet-ric fashion for RIX data.
Methods
scheme is the loop design as described by Zouet al.(2005) and Yuanet al.(2011). With the loop design,LRI lines were randomly ordered to form a circle. Then each RI line is mated with the nextJRI lines after it, resulting in total of
LJ samples. That is, we mate RI1 with RI2, RI3, . . ., and
RIJ11;. . .; RIiwith RIm(i11,L), RIm(i12,L),. . ., and RIm(i1j,L);
. . .; and RILwith RI1, RI2,. . ., and RIJ,where
mðx;LÞ5
x; if x#L; x2L; if x.L:
Not only in the loop design, but in many RIX populations, pairs of RIX sharing one parent are more closely related than those RIX that do not share a parent. For example, RIX produced by crossing RI1and RI2(RIX12) is expected to be
more similar to RIX produced by crossing RI1 and RI3
(RIX13) than to RIX from crosses between RI3 by RI4
(RIX34) since (RIX12) and (RIX13) share a parental RI
(RI1) while (RIX12) and (RIX34) do not share any parental
RI lines.
To study the RIX data, we fit a mixed-effect model by applying a random effect to model the polygenic effect. For simplicity, a model with only additive effect is considered. Also, we assume that all putative QTL are located on markers. For individual i, define the observed data as {yi,
ti,xi1,. . .xiM}, whereyiis the phenotype,tiis the measure of
the covariate and is nonconstant across subjects, M is the total number of markers, andximis the genotype at themth marker, coded as21, 0, or 1 for genotypes aa, Aa, and AA, respectively. We consider one putative QTL at a time and therefore suppress the subindexmin the sequel. The model can be expressed as
yi5mðtiÞ1xibðtiÞ1
XL
l51
ailal1ei;
where m(t) and b(t) are the overall population mean and QTL effect that vary with time t, respectively. The random polygenic effect alfollowsNð0;sa2Þ forl¼ 1, 2,. . .,L; the
random erroreifollowsNð0;s20Þ ; and
ail5
1; if one of ith individual’s parents is RIl;
0; otherwise:
This model can be applied to any RIX population in addition to the loop design as described above. The hypotheses for whether there exists any major QTL at a given locus areH0: b(t)¼0vs. Ha:b(t)6¼0.
We incorporate B-spline bases to model the varying coefficient functionsb(t) and m(t). The smoothness of the function modeled by B-splines is controlled by the parame-terK¼nj1d11, wherenjis the number of interior knots anddis the degree of spline. The interior knots of the splines can be either equally spaced or placed on the sample quan-tiles of the data, so that there are about the same number of observations between any two adjacent knots. We use
equally spaced knots for all numerical examples for this study, and henceBk(t) is determined for any givent.
The mixed-effects model becomes
yi5
XK
k51
g0kBkðtiÞ1
XK
k51
gkBkðtiÞxi1
XL
l51
ailal1ei;
where Bk(ti)’s are basis functions of B-splines of orderK, andg0k’s andgk’s are coefficients for B-spline basis. Here m(t) is approximated by PKk51g0kBk ðtÞ and b(t) is
ap-proximated by PKk51gkBkðtÞ. To test for genetic effect of
QTL, the hypotheses H0: b(t) ¼ 0 vs. Ha: b(t) 6¼ 0 are
equivalent to H0: g1 ¼ . . . ¼ gK ¼ 0 vs. Ha: not all the gksare 0.
We can rewrite the model above in the matrix form as
y5Xg1Aa1e;
wherey¼(y1,. . .yn)T; g¼(g01. . .g0K,g1. . .gK)T;Xis the
corresponding n · 2K design matrix for the time-varying fixed effect;a ¼(a1,. . .aL)T;e¼(e1,. . .en)T; andAis an n · L design matrix for the random polygenic effect. The design matrix Xcan be expressed as
X5 0
@B1⋮ðt1Þ . . .⋮ BK⋮ðt1Þ x1B1⋮ðt1Þ . . . x1BKðt1Þ B1ðtnÞ . . . BKðtnÞ xnB1ðtnÞ . . . xnBKðtnÞ
1 A:
We therefore observeyN(Xg,S) withS5s2aAAT1s2 0I,
which can be reparameterized asS5s2
0ðuD1IÞ5s20V, with u5s2
a=s20;D¼AAT, andV¼uD1I. Regardless of the form
of the covariance matrix S, the generalized least squares (GLS) is an appropriate estimate for parametergas
^
g5XTV21X21XTV21y:
The profile log-likelihood functions with only unknown parameters in S, based on the maximum likelihood (ML) and restricted/residual maximum likelihood (REML), can be written as
22ls2 0;ujy
5logjVj1n logs2 0
1s22
0 rTV21r1n logð2pÞ;
for ML and
22lR
s2
0;ujy
5logjVj1ðn2pÞlogs2 0
1logjXTV21Xj1s22
0 rTV21r1ðn2pÞlogð2pÞ
for REML, where p is the rank of X and r ¼ y 2 X (XTV21X)21XTV21yis a function ofu.
To simplify the computation, we further solve for the ML or REML estimate of s2
0 as a function ofu,
^
s2 05
1
nr TV21r;
for ML and
^
s2 05
1
for REML. Substitute the expressions above, we obtain the final profile log-likelihoods foruas
22lðujyÞ5logjVj1n logrTV21r1n logð2pÞ;
and
22lRðujyÞ5logjVj1logjXTV21Xj1ðn2pÞlog
rTV21r1ðn2pÞlogð2pÞ:
Note that the profile log-likelihood above involves only the nuisance parameter u. Hence its MLE can be easily computed by the Newton–Raphson algorithm. Once uis estimated,gand s2
0 can be subsequently
esti-mated by
^
g5XTV^21X21XTV^21y;
and
^
s2 05
1
nðy2X^gÞ
TV^21ðy2X^gÞ;
for ML and
^
s2 05
1
n2pðy2Xg^Þ
TV^21ðy2Xg^Þ;
for REML. We use REML in the following simulation studies, since it has some advantages over ML, such as taking into account the degrees of freedom forfixed effects (Mcculloch and Searle 2001).
Once the parameters are estimated, likelihood-ratio (LR) tests can be performed to evaluate the evidence of QTL effect, and LOD scores can be calculated at the locations of all genetic markers
LOD5log10LR
^
g;^u;s^2 0
2log10LR
0;~u;se2 0
;
whereð~u;es2
0Þis the MLE underH0:g1¼. . .¼gK¼0.
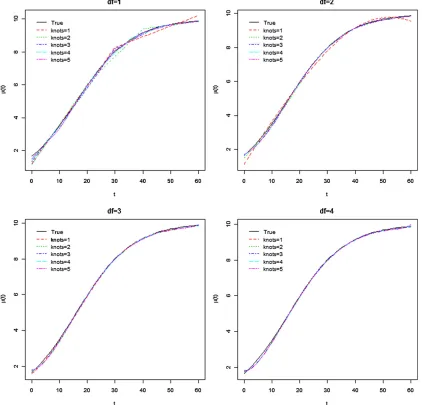
Figure 1 The varying coefficientmðtÞ510=ð115e20:1tÞ(solid curve). Dotted curves are the mean estimates ofm(t) for different combinations ofn
j
Since the hypothesis testing is performed on a number of markers, it is necessary to adjust the significance level for multiple testing. The threshold, in practice, is usually obtained by permutation procedures (Churchill and Doerge 1994). However, it is quite complicated to obtain appropri-ate threshold values for RIX data, because direct permuta-tion will not only destroy the relapermuta-tionship between QTL and the trait, but also destroy the relationship between polygenes and the trait, which will result in incorrect thresholds (Anderson and Ter Braak 2003; Zou et al.
2005; Churchill and Doerge 2008). To overcome this diffi-culty, Zouet al.(2005) extended the permutation method of Churchill and Doerge (1994) to a novel permutation method for the RIX data. The modified permutation method starts with permuting parental RI strain numbers 1, 2, . . .,Lintof(1),f(2),. . .,f(L). Then the permuted marker genotypes of RIXijwill be the corresponding marker
genotypes of RIXmin(f(i), f(j))max(f(i), f(j)) in the original
data. The permuted samples are analyzed with the same
model as the original data to generate an empirical distri-bution of maximum LOD scores, where the threshold value can be obtained.
Results
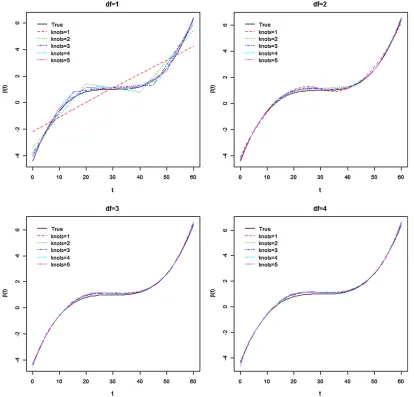
All analysis and simulation code used below are included in supporting information, File S1. In simulation studies, we set the number of parental RI linesL¼100, and applied the loop design with J¼3 to generate a total of 300 RIX sam-ples (Zouet al.2005). A single chromosome with 101 evenly spaced markers was simulated with either a 2-cM interval or 5-cM interval between nearby markers (resulting in a total length of 2 M or 5 M, respectively). The QTL is located at the 41th marker, which is at either 80 or 200 cM, for the two marker densities, respectively. The marker genotypes were simulated using R/qtl (Bromanet al.2003). We setm(t), the mean temporal growth function for QTL genotype Aa to 10=ð115e20:1tÞ, which is a logistic growth curve (Maet al. Figure 2 The varying coefficientbðtÞ511ð302tÞ3=5000(solid curve). Dotted curves are the mean estimates ofb(t) for different combinations ofnj
2002; Yang et al. 2009). We randomly generated ti from (0, 60) for each subject.
We considered the three different functions forb(t): Case 1:
bðtÞ5113 sin pt
30
;
Case 2:
bðtÞ511ð302tÞ
3
5000 ;
Case 3:
bðtÞ53
2
arctan
t230 4
1p
2
:
Cases 1 and 2 are nonlinearly increasing functional effects, used in simulation studies by Wang et al.(2008). Case 3 mimics the situation in which the genetic effect is hardly perceptible until after certain age, such as some breast can-cer-susceptibility genes (Foulkes et al. 2004). To test the performance of the model under various signal/noise ratios, two different sets of variances for random effect and random error were considered for each case:s2
a510,s20520 and s2
a530, s20530. In all cases, the average heritability is
between 0.02 and 0.18.
To choose a good combination of the interior knot numbernjand the degree of splinedfor the genetic effect, 500 runs of simulation were performed. In those simula-tions, we set s2
a 530,s20530, and the interval length to
5 cM. Figure 1 and Figure 2 plotted the meanm^ðtÞand mean ^
bðtÞ for case 2 with different combinations of nj and d.
Thefigures showed that relatively smallnjanddin general
fit the curves well, and the same is true for the other two cases. We calculated the squared differences (SQD) be-tween m^ðtÞ and m(t), and between b^ðtÞ and b(t) as SQD5 R060fðm^ðtÞ2mðtÞÞ21ðb^ðtÞ2bðtÞÞ2gdt for each of the
njanddcombination. We recorded the number of combina-tions ofnjanddwith the smallest SQD in Table 1, left. The results suggest that the combination ofnj¼1 andd¼2 is the best for cases 1 and 2, while for case 3, it isnj¼2 and
d ¼1.
In practice, the trueb(t) is unknown, so the choice ofnj
and d needs to be estimated. We propose the following approach to choose njand d using the AIC (Akaike 1970, 1974) as the selection criterion. First, we setnj¼1 andd¼
1 and identify the marker with the highest LOD score. Then at the selected marker, we calculate the AIC values for a set ofnjandd, and choose the one with the smallest AIC. In the simulation study, we computed the AIC values for the 500
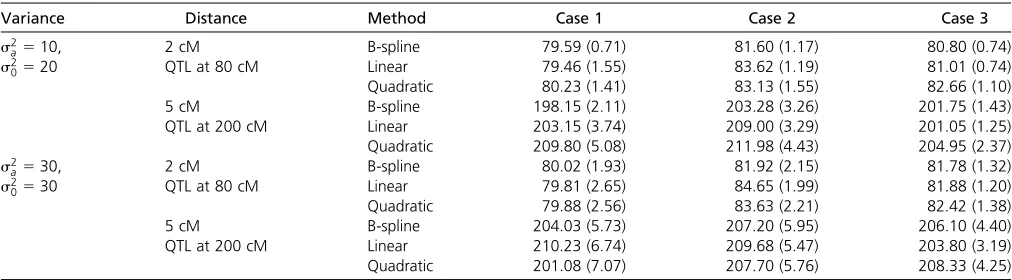
Table 2 Mean estimated locations of QTL (in centimorgans) and standard errors
Variance Distance Method Case 1 Case 2 Case 3
s2
a510, 2 cM B-spline 79.59 (0.71) 81.60 (1.17) 80.80 (0.74)
s2
0520 QTL at 80 cM Linear 79.46 (1.55) 83.62 (1.19) 81.01 (0.74)
Quadratic 80.23 (1.41) 83.13 (1.55) 82.66 (1.10)
5 cM B-spline 198.15 (2.11) 203.28 (3.26) 201.75 (1.43)
QTL at 200 cM Linear 203.15 (3.74) 209.00 (3.29) 201.05 (1.25)
Quadratic 209.80 (5.08) 211.98 (4.43) 204.95 (2.37)
s2
a530, 2 cM B-spline 80.02 (1.93) 81.92 (2.15) 81.78 (1.32)
s2
0530 QTL at 80 cM Linear 79.81 (2.65) 84.65 (1.99) 81.88 (1.20)
Quadratic 79.88 (2.56) 83.63 (2.21) 82.42 (1.38)
5 cM B-spline 204.03 (5.73) 207.20 (5.95) 206.10 (4.40)
QTL at 200 cM Linear 210.23 (6.74) 209.68 (5.47) 203.80 (3.19)
Quadratic 201.08 (7.07) 207.70 (5.76) 208.33 (4.25)
Table 1 Counts based on the smallest SQD or AIC
SQD AIC
nk¼ 1 2 3 4 5 1 2 3 4 5
Case 1 d¼1 0 73 39 10 0 40 126 36 21 3
d¼2 326 19 4 1 1 182 14 9 4 3
d¼3 17 2 0 0 0 28 4 2 2 1
d¼4 6 1 0 1 0 7 8 5 2 3
Case 2 d¼1 47 73 32 7 0 122 85 28 18 6
d¼2 257 34 5 1 1 155 17 12 4 2
d¼3 36 2 0 0 0 19 2 2 2 3
d¼4 3 1 0 1 0 7 7 4 2 3
Case 3 d¼1 68 259 13 18 1 136 180 12 24 6
d¼2 114 4 6 1 1 78 6 10 2 4
d¼3 9 1 0 0 0 13 2 1 2 3
simulations. Table 1, right, shows the number of combina-tions of nj and d with the smallest AIC. The results are consistent with the SQD results presented in Table 1, left.
For model comparison, we alsofittedb(t) parametrically. Specifically, we used polynomial functions
bðtÞ5X s
k50 gktk:
We sets¼1 ands¼2, for linear and quadratic polynomial functions, in the simulation studies.
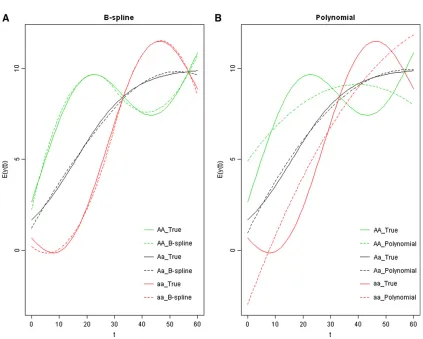
Under each case, 200 runs of simulation were conducted for all models mentioned above. For each case, we estimated b(t) using both B-splines and the polynomial functions. Hypothesis testings were performed on H0: b(t)¼0vs. Ha:b(t)6¼0, and LOD scores were calculated. For accessing the significance of the hypothesis testing,
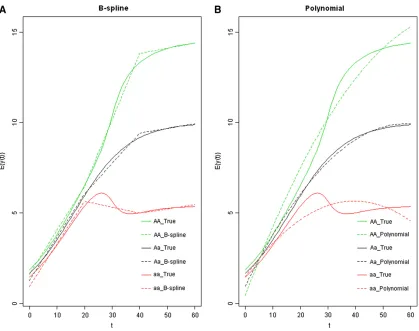
Figure 3 The varying coefficientbðtÞ5113 sinðpt=30Þ. (A) The estimated phenotypic mean curves by the B-spline method (in dotted lines) with the true genetic curves (in solid lines). (B) The estimated phenotypic mean curves by the polynomial method (in dotted lines) with the true genetic curves (in solid lines).
Table 3 Power of likelihood ratio test
Variance Distance (cM) Method Case 1 Case 2 Case 3
s2
a510,s20520 2 B-spline 0.855 0.765 0.925
Linear 0.620 0.735 0.920
Polynomial 0.595 0.685 0.895
5 B-spline 0.845 0.735 0.930
Linear 0.610 0.730 0.910
Polynomial 0.590 0.695 0.875
s2
a530,s20530 2 B-spline 0.470 0.425 0.630
Linear 0.220 0.415 0.640
Polynomial 0.230 0.370 0.605
5 B-spline 0.450 0.430 0.685
Linear 0.220 0.400 0.685
simulations were carried out from the following null model:
yi5mðtiÞ1
XL
l51
ailal1ei:
Total 1000 runs of simulations were performed and the 95% percentile of the maximum LOD score was calculated.
The QTL position was estimated as the location where the maximum LOD is reached. The mean and standard error of the estimated QTL position, by the three approaches, are listed in Table 2. Power is listed in Table 3. All the three methods have similar performance on estimating the QTL position and power for mapping QTL under cases 2 and 3. However, the B-spline approach has substantially higher power than the other two approaches under case 1, as well as higher precision in estimating the QTL location. The mean of the estimated phenotypic curves ^yðtÞ5m^ðtÞ1xb^ðtÞ are plotted along time in Figure 3, Figure 4, and Figure 5, for all cases with 5-cM intervals, s2
a 510 and s 2
0 520. The nonparametric
approach provides better fit to the true underlying phe-notypic curves than the parametric approach in all three cases. Overall speaking, the B-spline method outperforms the parametric method.
To evaluate the performance of the modified permuta-tion, we further carried out the following simulation studies. From 100 RI lines, 300 RIX subjects were simu-lated. A single 100-cM chromosome with evenly spaced markers was simulated with the QTL located at 40 cM. There were either 51 markers separated by 2-cM intervals or 21 markers separated by 5-cM intervals, on the chromosome. Two different b(t) functions, as described in cases 1 and 2 above, were simulated. We set mðtÞ510=ð115e20:1tÞ, s2
a530, ands20530. A total of 100 simulations were
con-ducted. Within each simulation, 1000 permutations were per-formed and the permutation threshold was calculated. To obtain the empirical thresholds, we ran additional 5000 sim-ulations underH0:b(t)¼0. We compared the permutation
thresholds with the empirical ones. The results listed in Table 4 indicate that the modified permutation performs reasonably well. The permutation thresholds were close to the empirical ones. Type I errors were slightly inflated. This is probably due to the small number of RI lines used in the simulations, as well as the sampling variation due to the small number (100) of simulations conducted.
Besides the biallelic marker data, our method can be extended to model founder effects by fitting individual functional curve for each of the eight CC founder alleles. Assuming additive model, wefit
yi5
X8
j51
bjðtiÞxij1
XL
l51
ailal1ei;
wherexijis the number of thejth founder alleles in theith RIX sample and bj(t) is the functional effect of the jth
founder allele (j¼1,. . ., 8). To modelbj(t)
nonparametri-cally, we usePKk51gjkBkðtÞto approximate it.
We carried out a simple simulation study to demonstrate the performance of this model. We again simulated 300 RIX subjects from 100 RI lines by the loop design. Every parental RI line has the same probability, 1/8, to carry one of the eight founder alleles. We setbjðtÞ510=ð115e20:1tÞforj¼
1, 2, 3, 4 and bjðtÞ5113 sinðpt=30Þ for j ¼ 5, 6, 7, 8,
respectively. We further sets2a510 ands 2
0 520. The
sim-ulations were conducted for 100 runs. In the simsim-ulations, we
assumed that the founder alleles were known for all RI lines. The means of the estimated functions of the eight founder alleles were plotted in Figure 6. All estimate the true func-tions well. With no prior knowledge that the genetic effects of the first four founder alleles were the same, our model obtained four very similar estimated curves, which allows us to group founder alleles with similar genetic effects.
Discussion
This study is largely motivated by the availability of the CC lines (Collaborative Cross Consortium 2012; Kelada et al.
2012). The CC project aims to generate and maintain .300 multiparental CC RI lines, and our ability to map complex traits will be greatly increased by making use of Figure 5 The varying coefficientbðtÞ53
2ðarctanððt230Þ=4Þ1p=2Þ. (A) The estimated phenotypic mean curves by the B-spline method (dotted) with
the true genetic curves (solid). (B) The estimated phenotypic mean curves by the polynomial method (dotted) with the true genetic curves (solid).
Table 4 Threshold and power estimates with LOD scores
Permutation
Interval (cM) Empirical b(t)¼0 Case 1 Case 2
LOD score 2 3.92 3.83 3.82 3.80
5 3.70 3.56 3.54 3.67
Power 2 0.05 0.07 0.60 0.66
these resources. RIX samples derived from CC RI lines pro-cess some good properties from both RI lines andF2
popu-lations. Genotypes of RIX can be directly inferred from those of their parental RI lines. Unlike the parental RIs whose genotypes are homozygous, the genetic structure of an RIX resembles F2 animals, reducing the phenotypic anomalies
associated with inbred genomes. However, RIX animals typ-ically do not share the same degree of relatedness. This un-balanced genetic relatedness requires careful statistical modeling to avoid a large number of false-positivefindings. The functional mapping idea is not new in statistical genet-ics community (Ma et al.2002; Wu et al.2002, 2004; Lin and Wu 2006; Yanget al.2009). However, this article is the first one that develops the functional mapping method for the RIX data and specifically models the unique genetic structure of RIX samples. In addition to B-spline approxima-tion, other nonparametric approaches can be used to model the varying coefficients, such as the local polynomial regres-sion (Fan and Gijbels 1996), the smoothing splines (Hastie and Tibshirani 1993; Hoover et al. 1998), and wavelet-based approaches (Donoho and Johnstone 1994). One ad-vantage of using B-splines is that the smoother matrix {Bk(ti)} is independent of the responses. Unlike other non-parametric approaches, how to determine the smoothness is
still an open question, although the choice of the number of knots is generally not critical (Yang et al.2009). Our simu-lation results (for example, Figures 1 and 2) show that the estimated functional effects are not very sensitive to the choices ofdandnj.
In our simulations, we applied single marker analysis because the high marker density of the parental RI (Aylor
et al.2011; Durrantet al.2011; Collaborative Cross Consor-tium 2012; Keladaet al.2012), and thus RIX, makes results similar to those that would be obtained using more compli-cated mapping methods, such as traditional interval map-ping (Lander and Botstein 1989) or regression interval mapping (Haley and Knott 1992). We also assume no parent-of-origin QTL and polygenic effects. The model can be ex-tended to include additional effects. For example, with two random effects—one for the maternal effect and another for the paternal effect—we can model the parent-of-origin poly-genic effects. Our method mainly considers quantitative trait nucleotide (QTN) mapping, we have shown by simulation studies that it can be extended to model founder allelic effects
by fitting one functional curve for each of the eight CC
founder alleles. Although our model considers only the addi-tive genetic effects, the dominant effects can be easily in-cluded in the model by adding additional functional effects. Figure 6 (A) The true varying genetic effect,bj(t), for founder alleles 1, 2, 3, and 4 equals10=ð115e20:1tÞ(solid curve). Dotted curves are the mean
estimates ofbj(t) forj¼1, 2, 3, 4. (B) The true varying genetic effect,bj(t), for founder alleles 5, 6, 7, and 8 equals113 sinðpt=30Þ(solid curve). Dotted
This is not a concern for QTN models but for models with founder allelic effects, the subsequent increase in the number of parameters can be very large. We may need to consider grouping certain founder alleles with some prior knowledge or genetic similarity as was done in haplotype analysis (Schaidet al.2002; Park et al.2003; Wanget al.2004; Lin
et al.2005) to maximize mapping power.
When more than one QTL is on a chromosome, the test statistic at one position will be affected by all the other QTL, the genetic estimates are likely to be biased, and QTL can be mapped to wrong positions (Knott and Haley 1992; Martinez and Curnow 1992). Our model can be extended to multiple regression for multiple QTL mapping, and some model selec-tion approaches can be modified for QTL selecselec-tion.
Our model investigates gene-by-time interactions for RIX data in a flexible nonparametric fashion. In this model, correlations among subjects are modeled as a function of their relatedness, which dramatically simplifies the covari-ance matrix of the data. Thefinal result is a framework for mapping in complex genetic designs, which is computation-ally tractable.
Acknowledgments
The authors are grateful for constructive comments and suggestions from the reviewers and the associate editor. Support was provided in part by National Institute of General Medical Sciences R01GM074175 and NIMH/NHGRI Center of Excellence in Genomic Sciences (P50MH090338).
Literature Cited
Akaike, H., 1970 Statistical predictor identification. Ann. Inst. Stat. Math. 22: 203–217.
Akaike, H., 1974 A new look at the Statistical model identifi ca-tion. IEEE Trans. Automat. Contr. 19: 716–723.
Almasy, L., and J. Blangero, 1998 Multipoint quantitative-trait linkage analysis in general pedigrees. Am. J. Hum. Genet. 62: 1198–1211.
Amos, C. I., 1994 Robust variance-components approach for as-sessing genetic linkage in pedigrees. Am. J. Hum. Genet. 54: 535–543.
Anderson, M. J., and C. J. F. ter Braak, 2003 Permutation tests for multi-factorial analysis of variance. J. Statist. Comput. Simula-tion 73: 85–113.
Aylor, D. L., W. Valdar, W. Foulds-Mathes, R. J. Buus, R. A. Verdugo
et al., 2011 Genetic analysis of complex traits in the emerging
Collaborative Cross. Genome Res. 21: 1213–1222.
Broman, K. W., 2005 The genomes of recombinant inbred lines. Genetics 169: 1133–1146.
Broman, K. W., 2012 Genotype probabilities at intermediate gen-erations in the construction of multiple-strain recombinant in-bred lines. Genetics 190: 403–412.
Broman, K. W., H. Wu, S. Sen, and G. A. Churchill, 2003 R/qtl: QTL mapping in experimental crosses. Bioinformatics 19: 889– 890.
Cheverud, J. M., J. J. Rutledge, and W. R. Atchley, 1983 Quan-titative genetics of development: genetic correlations among
age-specific trait values and the evolution of ontogeny. Evolu-tion 37: 895–905.
Churchill, G. A., and R. W. Doerge, 1994 Empirical threshold values for quantitative trait mapping. Genetics 138: 963–971. Churchill, G. A., and R. W. Doerge, 2008 Naive application of
permutation testing leads to inflated type I error rates. Genetics 178: 609–610.
Churchill, G. A., D. C. Airey, H. Allayee, J. M. Angel, A. D. Attie
et al., 2004 The Collaborative Cross, a community resource for
the genetic analysis of complex traits. Nat. Genet. 36: 1133– 1137.
Cleveland, W. S., E. Grosse, and W. M. Shyu, 1991 Local regres-sion models, pp. 309–376 inStatistical Models in S, edited by J. M. Chambers, and T. J. Hastie. Wadsworth & Brooks, Pacific Grove, CA.
Collaborative Cross Consortium, 2012 The genome architecture of the Collaborative Cross mouse genetic reference population. Genetics 190: 389–401.
Darvasi, A., 1998 Experimental strategies for the genetic dissec-tion of complex traits in animal models. Nat. Genet. 18: 19–24. Donoho, D. L., and I. M. Johnstone, 1994 Ideal spatial adaptation
by wavelet shrinkage. Biometrika 81: 425–455.
Durrant, C., H. Tayem, B. Yalcin, J. Cleak, L. Goodstadt et al., 2011 Collaborative Cross mice and their power to map host susceptibility to Aspergillus fumigatus infection. Genome Res. 21: 1239–1248.
Fan, J., and I. Gijbels, 1996 Local Polynomial Modeling and Its
Applications, Chapman & Hall, London.
Foulkes, W. D., K. Metcalfe, P. Sun, W. M. Hanna, H. T. Lynchet al., 2004 Estrogen receptor status in BRCA1- and BRCA2-related breast cancer: the influence of age, grade, and histological type. Clin. Cancer Res. 10: 2029–2034.
Goldgar, D. E., 1990 Multipoint analysis of human quantitative genetic-variation. Am. J. Hum. Genet. 47: 957–967.
Haley, C. S., and S. A. Knott, 1992 A simple regression method for mapping quantitative trait loci in line crosses using flanking markers. Heredity 69: 315–324.
Hastie, T. J., and R. J. Tibshirani, 1993 Varying-coefficient mod-els. J. R. Stat. Soc., B 55: 757–796.
He, X. M., and P. D. Shi, 1998 Monotone B-spline smoothing. J. Am. Stat. Assoc. 93: 643–650.
Hoeschele, I., 2007 Mapping quantitative trait loci in outbred populations, pp. 623–677 inHandbook of Statistical Genetics, Vol. 1, edited by D. J. Balding, M. Bishop, and C. Cannings. Wiley, New York.
Hoover, D. R., J. A. Rice, C. O. Wu, and L. P. Yang, 1998 Non-parametric smoothing estimates of time-varying coefficient models with longitudinal data. Biometrika 85: 809–822. Huang, J. Z., C. O. Wu, and L. Zhou, 2004 Polynomial spline
estimation and inference for varying coefficient models with longitudinal data. Statist. Sinica 14: 763–788.
Jansen, R. C., and P. Stam, 1994 High-resolution mapping of quantitative traits into multiple loci via interval mapping. Ge-netics 136: 1447–1455.
Kao, C. H., Z. B. Zeng, and R. D. Teasdale, 1999 Multiple interval mapping for quantitative trait loci. Genetics 152: 1203–1216. Kelada, S. N. P., D. L. Aylor, B. C. E. Peck, J. F. Ryan, U. Tavarez
et al., 2012 Genetic analysis of hematological parameters in
incipient lines of the Collaborative Cross. G3: Genes, Genomes, Genetics 2: 157–165.
Knott, S. A., and C. S. Haley, 1992 Aspects of maximum likelihood methods for the mapping of quantitative trait loci in line crosses. Genet. Res. 60: 139–151.
Lin, D. Y., D. Zeng, and R. Millikan, 2005 Maximum likelihood estimation of haplotype effects and haplotype-environment interactions in association studies. Genet. Epidemiol. 29: 299– 312.
Lin, M., and R. L. Wu, 2006 A joint model for nonparametric functional mapping of longitudinal trajectories and time-to-events. BMC Bioinformatics 7: 138.
Ma, C., G. Casella, and R. L. Wu, 2002 Functional mapping of quantitative trait loci underlying the character process: a theo-retical framework. Genetics 161: 1751–1762.
Martinez, O., and R. N. Curnow, 1992 Estimation the locations and the sizes of the effects of quantitative trait loci usingfl ank-ing markers. Theor. Appl. Genet. 85: 480–488.
McCulloch, C. E., and S. R. Searle, 2001 Generalized, Linear and
Mixed Models, Wiley-Interscience, New York.
Park, Y. G., R. Clifford, K. H. Buetow, and K. W. Hunter, 2003 Multiple cross and inbred strain haplotype mapping of complex-trait candidate genes. Genome Res. 13: 118–121. Pittman, J., 2002 Adaptive splines and genetic algorithms. J.
Comput. Graph. Statist. 11: 615–638.
Plomin, R., G. E. McClearn, G. Gora-Maslak, and J. M. Neiderhiser, 1991 An RI QTL cooperative data bank for recombinant inbred quantitative trait loci analyses. Behav. Genet. 21: 97–98. Satagopan, J. M., B. S. Yandell, M. A. Newton, and T. C. Osborn,
1996 A Bayesian approach to detect quantitative trait loci us-ing Markov chain Monte Carlo. Genetics 144: 805–816. Schaid, D. J., C. M. Rowland, D. E. Tines, R. M. Jacobson, and G. A.
Poland, 2002 Score tests for association between traits and haplotypes when linkage phase is ambiguous. Am. J. Hum. Genet. 70: 425–434.
Sillanpaa, M. J., and E. Arjas, 1998 Bayesian mapping of multiple quantitative trait loci from incomplete inbred line cross data. Genetics 148: 1373–1388.
Threadgill, D. W., K. W. Hunter, and R. W. Williams,
2002 Genetic dissection of complex and quantitative traits: from fantasy to reality via a community effort. Mamm. Genome 13: 175–178.
Tsaih, S. W., L. Lu, D. C. Airey, R. W. Williams, and G. A. Churchill, 2005 Quantitative trait mapping in a diallel cross of recombi-nant inbred lines. Mamm. Genome 16: 344–355.
Vaughn, T. T., L. S. Pletscher, A. Peripato, K. King-Ellison, E. Adams
et al., 1999 Mapping quantitative trait loci for murine growth:
a closer look at genetic architecture. Genet. Res. 74: 313–322.
Wang, L., G. Chen, and H. Li, 2007 Group SCAD regression anal-ysis for microarray time course gene expression data. Bioinfor-matics 23: 1486–1494.
Wang, L., H. Li, and J. Z. Huang, 2008 Variable selection in non-parametric varying-coefficient models for analysis of repeated measurements. J. Am. Stat. Assoc. 103: 1556–1569.
Wang, X., R. Korstanje, D. Higgins, and B. Paigen, 2004 Hap-lotype analysis in multiple crosses to identify a QTL gene. Ge-nome Res. 14: 1767–1772.
Wu, R. L., C. Ma, R. Littell, and G. Casella, 2002 A statistical model for the genetic origin of allometric scaling laws in biology. J. Theor. Biol. 217: 275–287.
Wu, R. L., C. Ma, M. Lin, and G. Casella, 2004 A general frame-work for analyzing the genetic architecture of developmental characteristics. Genetics 166: 1541–1551.
Xu, Z. L., F. Zou, and T. J. Vision, 2005 Improving QTL mapping resolution in experimental crosses by the use of genotypically selected samples. Genetics 170: 401–408.
Yang, J., R. L. Wu, and G. Casella, 2009 Nonparametric modeling of longitudinal covariance structure in functional mapping of quantitative trait loci. Biometrics 65: 30–39.
Yi, N., 2004 A unified Markov chain Monte Carlo framework for mapping multiple quantitative trait loci. Genetics 167: 967–975.
Yi, N., and S. Xu, 2000 Bayesian mapping of quantitative trait loci for complex binary traits. Genetics 155: 1391–1403.
Yuan, Z., F. Zou, and Y. liu, 2011 Bayesian multiple quantitative trait loci mapping for recombinant inbred intercrosses. 188: 189–195.
Zeng, Z. B., 1994 Precision mapping of quantitative trait loci. Genetics 136: 1457–1468.
Zou, F., B. S. Yandell, and J. P. Fine, 2001 Statistical issues in the analysis of quantitative traits in combined crosses. Genetics 158: 1339–1346.
Zou, F., J. L. Gelfond, D. C. Airey, L. Lu, K. F. Manly et al., 2005 Quantitative trait locus analysis using recombinant in-bred intercrosses (RIX): theoretical and empirical considera-tions. Genetics 170: 1299–1311.
GENETICS
Supporting Information
http://www.genetics.org/lookup/suppl/doi:10.1534/genetics.111.132522/-/DC1
Varying Coef
fi
cient Models for Mapping
Quantitative Trait Loci Using Recombinant
Inbred Intercrosses
Yi Gong and Fei Zou
File S1
Compressed R Package
File S1 is available at http://www.genetics.org/lookup/suppl/doi:10.1534/genetics.111.132522/‐/DC1 as a compressed folder.
The folder contains three programs written in R:
• sim1.r ‐ for simulations for the biallelic marker model
• sim2.r ‐ for simulations for the eight founder alleles model
• funs.r ‐ basic functions used in sim1.r and sim2.r