Research Report No. 96 July, 1984
Measured Crop Per/onnance
SMALL GRAIN
1984
D. T. BOWMAN, Assistant Professor In Charge of Variety Testing
Department of Crop Science NORTH CAROLINA STATE UNIVERSITY
TABLE OF CONTENTS
INTRODUCTION .
COMPARING VARIETIES .
EXPERIMENTAL PROCEDURE 5
Entri es 5
Field Plot Design 5
Crop Management 5
Aqenctes Sponsoring Entri es 9
Cooperators 9
SEASONAL CONDITIONS ....•... 10 DATA ...•... 11
RESULTS AND DISCUSSION 13
Barley ...•... 13
Oats 13
Wheat 14
Wheat and Flour Analyses 15
TABLES
1. Characteristics of barley varieties 3
2. Characteri sti cs of oat vari eti es 3
3. Characteristics of wheat varieties ...•... 4 4. Cultural practices for small grain tests, 1983-84 7
5. Soi1 test resu1ts 8
1984
PERFORMANCE OF SMALL GRAIN VARIETIES IN NORTH CAROLINAli INTRODUCTION
Across the State of North Carolina during the spring of 1983, growers harvested 56,000 acres of barley, 75,000 acres of oats, and 480,000 acres of wheat. Average yields were 49, 56, and 34 bushels per acre for barley, oats, and wheat, respectively.
With the large number of commercially available and prospective varieties of barley, oats, and wheat, it becomes difficult for growers to select a superior variety suited for their particular area of the state. To make this decision the grower needs up-to-date, unbiased, reliable information. The Official Variety Testing Program, through this report, seeks to provide that type of information.
Information on varietal performance is presented from seven test locations in the state--four in the Piedmont, and three in the Coastal Plain. Also included are multipe-year performance data on a selected number of varieties.
COMPARING VARIETIES
Performance of a variety cannot be determined with absolute precision Even though the tests are conducted in a uniform manner, as much as possible, uncontrollable variability exists among experimental plots due to soil, fertility, moisture, insects, diseases, and other sources of variation. Because this variability exists, statistics are used as a tool
2
to determine differences among varieties. The size of difference among
varieties which may have been due to chance variation is listed in each
table as the B.l.S.D. (least significant difference). Those varieties
which do not differ by more than the B.l.S.D. are not statistically
different.
Varietal performance may appear inconsistent among locations within
an area or among years at a particular location, thus it is important for
the reader to examine results from more than one location within an area
or more than one year at a particular location to obtain a more accurate
picture of relative varietal performance. An effort has been made to
facilitate comparisons among locations and years in this report.
The varieties which do not yield significantly less than the highest
yielding variety are denoted by an asterisk
(*)
next to their yields. The relative performance of a variety across locations within an area can beeasily evaluated by going across the table; those varieties which are most
frequently marked by an asterisk would be highly desirable. Other agronomic
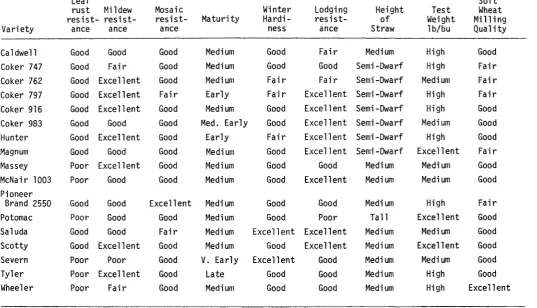
characteristics may be as equally important as yield. All available data regarding pathologic and agronomic characteristics of the varieties are
found in Table 1, 2, and 3 for barley, oats, and wheat,
respectively.~
It is suggested that the grower plant a small number of acres in a
new variety when first determining if it is adapted to his farm.
Table 1. Characteristics of barley varieties*
Mildew Rust Scald Lodging Winter Test Length
resist- resist- resist- resist- hardi- Maturity Weight of
Variety ance ance ance ance ness lb/bu awns
Anson Fair Good Poor Good Good Medium Medium Awnless
Boone Fair Good Fair Fair Good Medium High Short
Clayton Good Excellent Good Good Good Medium Medium Awnless
Keowee Good Poor Fair Good Good Medium High Short
Milton Fair Good Good Excellent Good Early Medium Short
Redhi1l Good Good Good Good Good Early Medium Awnless
Sussex Excellent Poor Excellent Good Fair Early Low Short
w
Table 2. Characteristics of oat varieties*
Rust Smut Mosaic Winter Lodging Test
resist- resist- resist- Maturity hardi- resist- Weight
Variety ance ance ance ness ance lb/bu
Brooks Fair Good Good Early Good Good Med. High
Coker 716 Fair Good Good Medium Good Excellent Med. High
Madison Fair Good Good Med. Early Fair Excellent Medium
Table 3. Characteristics of wheat varieties*
Leaf Soft
rust Mildew Mosaic Winter Lodging Height Test Wheat
resist- resist- resist- Maturi ty Hardi- resist- of Weight Milling
Variety ance ance ance ness ance Straw lb/bu Quality
Caldwell Good Good Good Medium Good Fair Medium High Good
Coker 747 Good Fair Good Medium Good Good Semi-Dwarf High Fair
Coker 762 Good Excellent Good Medium Fair Fair Semi-Dwarf Medium Fair Coker 797 Good Excellent Fair Early Fair Excellent Semi-Dwarf High Fair Coker 916 Good Excellent Good Medium Good Excellent Semi-Dwarf High Good Coker 983 Good Good Good Med. Early Good Excellent Semi-Dwarf Medium Good
Hunter Good Excellent Good Early Fair Excellent Semi-Dwarf High Good
Magnum Good Good Good Medium Good Excellent Semi-Dwarf Excellent Fair ~
Massey Poor Excellent Good Medium Good Good Medium Medium Good
McNair 1003 Poor Good Good Medium Good Excellent Medium Medium Good
Pioneer
Brand 2550 Good Good Excellent Medium Good Good Medium High Fair
Potomac Poor Good Good Medium Good Poor Tall Excellent Good
Saluda Good Good Fair Medium Excellent Excellent Medium Medium Good
Scotty Good Excellent Good Medium Good Excellent Medium Excellent Good
Severn Poor Poor Good
v.
Early Excellent Good Medium Medium GoodTyler Poor Excellent Good Late Good Good Medium High Good
Wheeler Poor Fair Good Medium Good Good Medium High Excellent
5
EXPERIMENTAL PROCEDURE
The state is divided into physiographic regions and tests were located in the Piedmont and Coastal Plain (Figure 1). Four tests were located on private farms~and four were on research stations.
Entries: Commercial varieties and experimental lines developed by pUblic and private agencies are included in these tests. Any individual or firm may make application for having entries included by writing the Department of Crop Science, North Carolina State University at Raleigh. A fee is charged on an entry basis for all private entries. Entries about which further information was desired may have been included on a no-fee basis. A total of 10, 8, and 27 commercial varieties and experimental lines of barley, oats, and wheat, respectively, were evaluated in the 1983-84 season. Field Plot Design: A randomized, complete block design with four or six replications was used at each 10cation.
1I
Each plot consisted of seven rows, seven inches apart, seventeen feet long with two feet between each plot. Crop Management: Cultural practices, such as seed bed preparation, date of planting, fertilization and topdressing were in accord with good farming practices and were uniform for all entries at a given location (Table 4). Prior to planting each test, soil samples were obtained from the test field and fertilizer and lime applications were made accordingly (Table 5).~The cooperative spirit and civic-minded service rendered by the farmers who provided the land and the necessary cultural practices for these
trials and the cooperation of the county agents are gratefully acknowledged.
• Signifies Official Variety Test Locations
FIGURE 1-LOCATION OF SMALL GRAIN PERFORMANCE TRIALS
STOlES ImnQWI
1984
Table 4. Cultural practices for small grain tests, 1983-84.
Fertilizer Topdress Soi1 Date of Date of
County lbs/A
&
Grade 1bs/A Type Planting HarvestPiedmont Area
Orange 200 lbs. 10-20-20 150 lbs. 33.5% N Georgeville Silt Loam November 8 6-20 Granville 400 lbs. 10-20-20 180 lbs. 33.5% N Helena Loamy Sand October 31 6-20
Lincoln 450 lbs. 8-24-24 180 1bs , 33.5-% N November 3 7-10
Rowan 700 lbs. 10-20-20 Hiawassee Clay Loam November 1 6-21
...,
Coastal Plain Area
Chowan 300 lbs. 33.5% N November 2 6-15
Lenoir 300 lbs. 10-10-20 300 lbs. 33.5% N Goldsboro Loamy Sand October 26 6-12
Duplin 150 lbs. 33.5% N Coxvi11e Fine Sandy October 27 6-13
Loam
Table 5. Soil test results from test sites, 1983-84.
HM %
w-v
CEC BS % Ac pH P-I K-I Ca % Mg % Mn-I Zn-t Cu-IPIEDMONT AREA
Granville 0.2 1.18 2.4 83 0.4 5.9 48 40 54.2 20.8 93 24 29
- Orange 0.3 1.04 4.8 41 2.8 5.1 10 66 23.2 10.9 166 29 46
Lincoln 0.6 1.24 4.2 81 0.8 5.9 64 72 49.5 23.1 166 35 72
Rowan 0.1 0.98 4.1 71 1.2 5.5 15 66 48.4 14.5 166 27 112
00
COASTAL PLAIN AREA
Chowan 0.6 1.00 6.1 87 0.8 6.3 50 56 65.6 16.7 70 41 34
Duplin 1.0 1.23 6.0 80 1.2 6.2 166 92 59.8 12.6 103 92 210
Lenoir 0.8 1.27 3.6 77 0.8 5.6 166 66 50.7 17.2 50 83 55
9
Agencies Sponsoring Entries Coker1s Pedigreed Seed Company
Florida Agricultural Experiment Station Illinois Agricultural Experiment Station Maryland Agricultural Experiment Station Northrup King Company
North American Plant Breeders
North Carolina Agric. Experiment Station Pioneer Hi-Bred International, Inc. Purdue University Agric. Expt. Station South Carolina Agric. Experiment Station Virginia Agricultural Experiment Station
Cooperators Piedmont Entries Coker Florida Scotty Potomac, Severn McNair, NK Hunter, Magnum
Anson, Boone, Clayton, Milton Brooks, Madison, NC
Pioneer brand
Caldwell, Compton, Fillmore Keowee, Redhi11
Sussex, Massey, Tyler, VA Wheeler, Saluda
Granville County: Bill Clements, Superintendent, Oxford Tobacco Research Station, Oxford, NC
Agricultural Extension Agent, Derek Day.
Lincoln County: Bess Farms, Inc., Route 1, Lincolnton, NC Agricultural Extension Agent, Ben Knox.
Orange County: B;-ll Ray, Route 2, Hillsborough, NC Agricultural Extension Agent, Dave Warren.
Rowan County: Billy Ayscue, Superintendent, Piedmont Research Station, Salisbury, NC
Agricultural Extension Agent, Steven Gatton. Coas ta 1 P'l ain
Chowan County: Richard Saunders, Route 2, Edenton, NC County Extension Chairman, J. Michael Williams. Duplin County: Jack Williams, Route 2, Faison, NC Agricultural Extension Agent, J. Michael Moore.
Lenoir County: Sandy Barnes, Superintendent, Lower Coastal Plain Tobacco Research Station, Kinston, NC.
Agricultural Extension Agent, Johnnie Jones.
Washington County: John Smith, Superintendent, Tidewater Research Station, Plymouth, NC
10
SEASONAL CONDITIONS
The 1983-84 small grain growing season was characterized by above normal rainfall and below normal temperatures for the most part. Below normal temperatures during the latter part of December and early part of January resulted in winter kill of four of the eight oat tests and the barley test at the Orange County location. Rainfall at four locations is shown below:
Monthly Rainfall Totals (Inches) No- De- Jan-
Feb-Location October vember cember uary ruary March April ~ Granville County 4.50 4.01 7.00 3.94 5.15 7.11 5.23 5.34 Lenoir County 1.30 3.07 7.02 3.06 5.99 7.30 2.87 5.93 Rowan County 3.76 4.24 6.41 3.84 6.69 5.46 5.75 6.48 Washington County 3.94 3.74 4.56 4.18 3.88 5.47 5.40 6.82 Dates of planting during the fall of 1983 were near normal. Environ-mental conditions were conducive for several diseases although powdery mildew was not evident to the point where viable ratings could be made. Leaf rust ratings and scald ratings were made and reported. Glume blotch was evident at the Granville County location and several plots were severely damaged with nearly 100% of the heads infected. Cereal leaf beetle was evident at Rowan, Orange and Granville County locations with the Orange County location receiving the heaviest damage although the extent of the damage was not assessed.
11
The unfavorable weather delayed heading of the barley, oats and wheat nearly ten days later than normal. For this reason, growers are cautioned when examining heading data reported in this bulletin.
All yields were above normal at most locations. Barley test weights were below normal although this may be attributed to the late harvest of the test plots.
DATA
Yield is reported in bushels per acre by location, across locations within areas and across all locations within the state. Test weights in pounds per bushel were reported averaged by area and averaged across the state. Lodging was reported in percentage averaged across all locations within the state.
Date 50% headed and date of physiological maturity were taken at the Granville County location and reported in the state-wide average. Date of physiological maturity is considered when the grain is dried down to 18% moisture.
Disease ratings are reported in the state-wide averages although they may have only been taken at one or two locations. One thousand kernel weight is an indicator of quality and may not be correlated with test weight. For milling purposes, the 1000 kernel weight is a better indicator of quality. These data were obtained for wheat and averaged across all locations for a state-wide average. It should be noted that although 1000 kernel weight is a better indicator of quality, growers are penalized for low test weight although 1000 kernel weight may be high
Certain varieties were tested only in the Coastal Plain while other varieties were tested in the Piedmont only. Tables reflect these
12
13
RESULTS AND DISCUSSION Barley
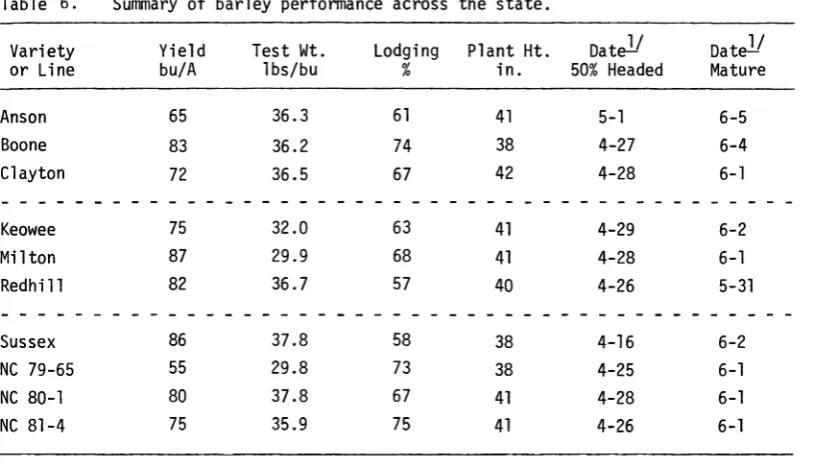
Barley performance is summarized across the state in Table 6. The highest yielder across locations was Milton, followed closely by Sussex. Test weights were extremely low due to late harvest and environmental conditions in the spring. Lodging was extremely high due again to late harvest. Although Sussex performed well in 1984, the date 50% headed indicates it is an early variety and in 1983 it performed poorly due to late spring freezes. This should be kept in mind by the grower. The severity of scald on Anson drastically reduced yields of that particular variety which has performed well in the past. Although Boone is susceptible to scald, it still performed well under severe infestations of this disease.
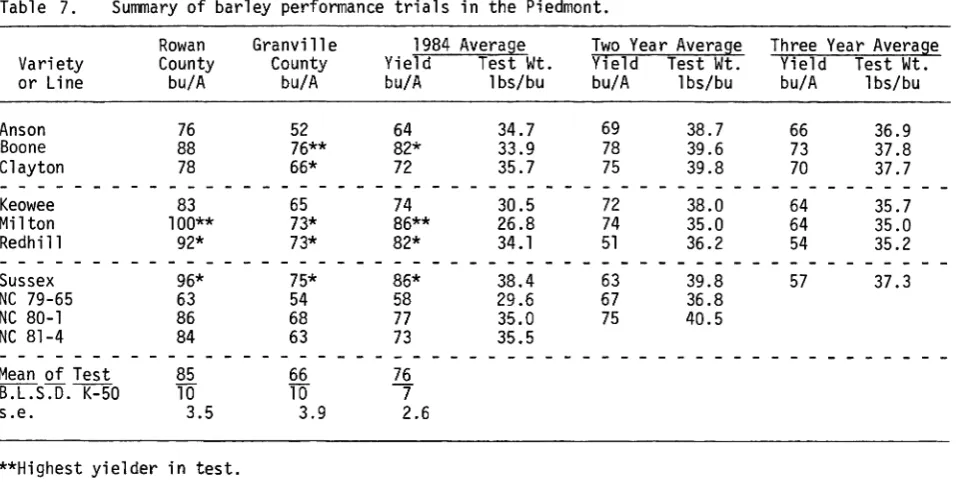
Across the Piedmont, Milton was the highest yielder with 86 bushels per acre (Table 7); although Boone was the highest yielder over two and three years. Yields at Rowan County were excellent with an average yield of 85 bushels per acre.
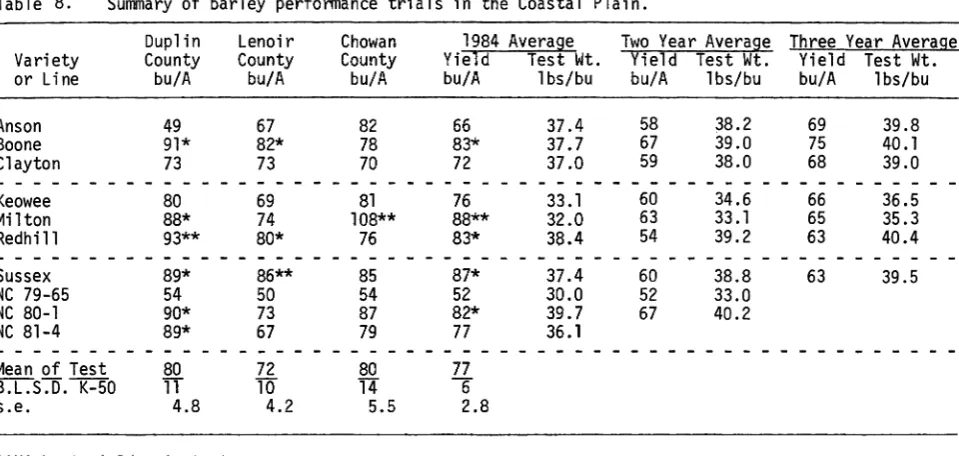
Across the Coastal Plain, again, Milton was the highest yielder with an average of 88 bushels per acre (Table 8). Boone and NC 80-1 were the two-year yield leaders while Boone is the three-year yield leader. Test weights in the Coastal Plain were somewhat higher than those in the Piedmont and excellent yields were obtained at all three locations in the Coastal Plain.
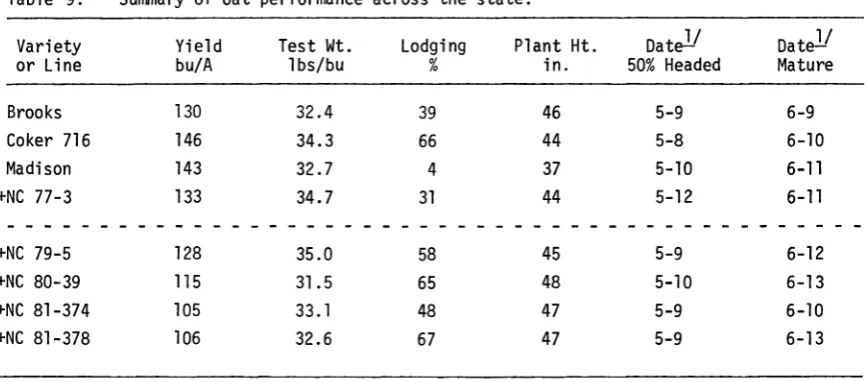
Oats
Oat yields appeared to be above average across the state (Table 9). Coker 716 was the highest yielder with an average of 146 bushels per
14
for Madison to a high of 67% for NC 81-378. The data on plant height will help explain the differences in lodging with Madison being the shortest variety in the test.
Highly significant location by variety interaction prevents any one variety from significantly outyielding all others across locations in the Piedmont in 1984 (Table 10). At the Granville County location, Coker 716 and Madison were the highest yielders while Brooks was the highest yielder of the Lincoln County location with an average of 145 bushels per acre. Test weights were excellent in 1984 in the Piedmont. Coker 716 is the highest two and three-year yield leader in the Piedmont.
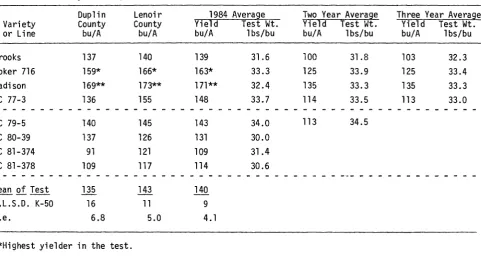
Madison and Coker 716 were the highest oat yielders in the Coastal Plain in 1984 (Table 11). Madison is also the two and three-year yield leader with an average of 135 bushels per acre.
Wheat
15
County location. The earliest maturing variety at this location was Coker 916. Leaf rust ratings were taken in the Coastal Plain.
Wheat yields were excellent across the Piedmont (Table 13) with wheat yields at the Lincoln County location averaging 88 bushels per acre. At this particular location, Coker 983 yielded an astonishing 109 bushels per acre. Across locations in the Piedmont, Coker 916 was the highest yielder with 79 bushels per acre followed closely by Coker 983, McNair 1003, Saluda and Tyler. Tyler is the highest yielder over the last two and three years. Test weights were somewhat low in the Piedmont and high in the Coastal Plain (Table 14).
In the Coastal Plain, Saluda was the highest yielder with an average of 75 bushels per acre. It also is the two-year yield leader with an average of 62 bushels per acre. Across three years, Pioneer 2550
is the highest yielder with an average of 56 bushels per acre. Wheat and Flour Analyses
16
Table 6. Summary of barley performance across the state.
Variety Yield Test Wt. Lodging Plant Ht. Date
Ji
Datell
or Line bu/A 1bs/bu % in. 50% Headed Mature
Anson 65 36.3 61 41 5-1 6-5
Boone 83 36.2 74 38 4-27 6-4
Clayton 72 36.5 67 42 4-28 6-1
- - - -
-
-
-- - -
-
--
--
--
- -
--
-
-
-
-
-
-
-
- --
~ --
-
- -
--
--
-Keowee 75 32.0 63 41 4-29 6-2
Milton 87 29.9 68 41 4-28 6-1
--I
Redhill 82 36.7 57 40 4-26 5-31 ...
- -
-
- - --
- --
-
--
-
--
--
-
- - -
~ --
-
--
-
- ~-
-- -
-
-
~-
-
-
~-Sussex 86 37.8 58 38 4-16 6-2
+NC 79-65 55 29.8 73 38 4-25 6-1
+NC 80-1 80 37.8 67 41 4-28 6-1
+NC 81-4 75 35.9 75 41 4-26 6-1
Table 7. Summary of barley performance trials in the Piedmont. Variety
or Line
Rowan County
bu/A
Granville County
bu/A
1984 Average Yield Test Wt.
bu/A 1bs/bu
Two Year Average Yield Test Wt. bu/A lbs/bu
Three Year Average Yield Test Wt.
bu/A 1bs/bu
Anson 76 52 64 34.7 69 38.7 66 36.9
Boone 88 76** 82* 33.9 78 39.6 73 37.8
Clayton 78 66* 72 35.7 75 39.8 70 37.7
- -
-
--
-
- - --
- --
--
- - --
-
-
-
-
--
-
- -
- --
--
-
- --
-
--
- -
-
--
--
-Keowee 83 65 74 30.5 72 38.0 64 35.7
Milton 100** 73* 86** 26.8 74 35.0 64 35.0
Redhill 92* 73* 82* 34.1 51 36.2 54 35.2 co
-
- - - --
- -
--
-
-
-
--
-
-
- -
-
- -
--
-
- -- -
- -- -
-
-
-
-
-
-
-
- - -
-- -
-
-
~-Sussex 96* 75* 86* 38.4 63 39.8 57 37.3
+NC 79-65 63 54 58 29.6 67 36.8
+NC 80-1 86 68 77 35.0 75 40.5
+NC 81-4 84 63 73 35.5
- - - - -
-- -
- --
--
- --
-
- -
--
-
- - -
- --
-
-
-
--
-
- -
--
-
-
--
-
--
-
--
--Mean of Test 85 66 76
B.L.SJr. K-50
10
Th 7"s.e. 3.5 3.9 2.6
**Highest yielder in test.
Table 8. Summary of barley performance trials in the Coastal Plain. Variety or Line Duplin County bu/A Lenoir County bu/A Chowan County bu/A 1984 Average Yield Test Wt. bu/A 1bs/bu
Two Year Average Three Year Average Yield Test Wt. Yield Test Wt. bu/A 1bs/bu bu/A 1bs/bu
Anson 49 67 82 66
Boone 91* 82* 78 83*
C1 ayton 73 73 70 72
- -
-
-
- --
-
--
-
-
--
-
- - - - -
-
-
-
-
-
-
-Keowee 80 69 81 76
Milton 88* 74 108** 88**
Redhill 93** 80* 76 83*
-
-
-
-
-
-
-
-
-
-
-
-
-
-
-
-
-
-
- -
-
-
~-
-
-
-Sussex 89* 86** 85 87*
+NC 79-65 54 50 54 52
+NC 80-1 90* 73 87 82*
+NC 81-4 89* 67 79 77
-
- -
--
-
-
-
-
- -
-
--
~-
-
-
-
-
- -
-Mean of Test 80 72 80 77
B.L.S"J). K-50 11 10 14 "6
s.e. 4.8 4.2 5.5 2.8
**Highest yielder in test.
*Not significantly different from highest yielder. +Experimenta1.
37.4 58 38.2 69 39.8
37.7 67 39.0 75 40.1
37.0 59 38.0 68 39.0
- - -
-
- -
-
-
-
-
~-
-
-
-
-
-
-
-
-
--
-33.1 60 34.6 66 36.5
32.0 63 33.1 65 35.3
38.4 54 39.2 63 40.4 ~
\.0
-
- - -
-
--
-
~ ~-
-
--
-
-
--
-
-
--37.4 60 38.8 63 39.5
30.0 52 33.0
39.7 67 40.2
36.1
-Table 9. Summary of oat performance across the state.
Variety Yield Test Wt. Lodging Plant Ht. Date
ll
Datell
or Line bu/A 1bs/bu % in. 50% Headed Mature
Brooks 130 32.4 39 46 5-9 6-9
Coker 716 146 34.3 66 44 5-8 6-10
Madison 143 32.7 4 37 5-10 6-11 N
0
+NC 77-3 , 33 34.7 31 44 5-12 6-11
-
-
-
-
- --
-- -
-
-
-
-
-
-
-
-
-
-
- ~-
~-
-
- -
-
-
-
-
- - -
--
-
-
- -
-
-
-+NC 79-5 128 35.0 58 45 5-9 6-12
+NC 80-39 115 31.5 65 48 5-10 6-13
+NC 81-374 105 33.1 48 47 5-9 6-10
+NC 81-378 106 32.6 67 47 5-9 6-13
Table 10. Summary of oat performance in the Piedmont.
-Granville lincoln 1984 Average Two Year Average Three Year Average
Variety County County Yield Test Wt. Yield Test Wt. Yield Test Wt.
or line bu/A bu/A bu/A lbs/bu bu/A 1bs/bu bu/A 1bs/bu
Brooks 105 145** 121* 33.2 103 32.5 99 31 .7
Coker 716 125** 137* 130** 35.2 116 35.1 114 33.0
Madison 117* 113 115* 32.9 99 32.3 99 32.3
+NC 77-3 107 138* 119* 35.6 108 35.2 106 32.9
-
-
--
- - --
- --
- -
-
--
--
-
--
- -
-
- - --
- - - ~-
-
-
-
-
-
-
-
-- -
-
--
-
-
-
--+NC 79-5 114 112 113* 35.9 98 36.1 N...
+NC 80-39 94 110 100* 32.9
+NC 81-374 92 115 101* 34.8
+NC 81-378 88 115 99* 34.5
- -
-
- - --
--
- --
-
--
-
-
-
-
- --
- -
- --
- - --
-
- -- -
-
--
-
--
--
--
-- -
-
-Mean of Test 105 123 112
-B.l.S.D. K-50 10 20 NS
s.e. 4.4 .7.3 3.9
**Highest yielder in the test.
Table 11. Summary of oat performance in the Coastal Plain.
Duplin Lenoir 1984 Average Two Year Average Three Year Average Variety County County Yield Test Wt. Yield Test Wt. Yield Test Wt.
or Line bu/A bu/A bu/A 1bs/bu bu/A 1bs/bu bu/A lbs/bu
Brooks 137 140 139 31.6 100 31.8 103 32.3
Coker 716 159* 166* 163* 33.3 125 33.9 125 33.4
Madison 169** 173** 171** 32.4 135 33.3 135 33.3
+NC 77-3 136 155 148 33.7 114 33.5 113 33.0
-
-
- - - --
--
-
--
~-
-
-
-
-
~-
- --
-
~ --
- -
-
-
-
~- - -
-
-
--
--
- -
- -
--
-
--
-+NC 79-5 140 145 143 34.0 113 34.5 N
N
+NC 80-39 137 126 131 30.0
+NC 81-374 91 121 109 31.4
+NC 81-378 109 117 114 30.6
- -
-
-
- -
-
- - - -
-
--
--
--
--
-
- - -
-
-
-
-
-
-
--
-
--
-
-
-~- ~ ~-
-
-
-
- -
~- -
-
-Mean of Test 135
.ill.
140B.l.S.D. K-50 16 11 9
s.e. 6.8 5.0 4.1
**Highest yielder in the test.
*Not sigDificant1y· different from the hi~hest yie'der~
Table 12. Summary of wheat performance trials across the state.
(1000) Plant Oate]J
Oate
ll
LeafYVariety Yield Kernel Test Wt. Lodging Height 50% Rust
or Line bu/A Wt. 1bs/bu % in. Headed Mature Rating
Caldwell 66 28.7 55.1 32 38 5-5 6-10 R
Coker 747 69 32.4 56.2 20 37 5-2 6-11 R
Coker 916
--
--
--
--
39 4-30 6-8Coker 983 76 31.9 57.2 2 37 5-2 6-11 R
- - -
-
- - -
-
-
-
-
-
-
-
- - -
-
-
-
-
-
-
-
-
-
-
-
- --
-
-
-
-
--
-
-
--
--
- - - -
- ~-
--
-Compton 71 35.2 57.5 6 37 5-3 6-10 R
Fillmore 61 32.1 54.6 28 42 5-15 6-16 R
Florida 301 60 33.6 56.9 25 47 4-30 6-9 R
Hunter 66 33.4 54.1 5 37 4-30 6-10 MR
-
-
- -
-
-
-
- - -
-
- -
- -
-
- -
-
-
-
-
- - - -
- - -
-
--
-
-
-
-
- - - -
- -
-
-
-
-
- --
--
-
-Magnum 68 31.5 57.0 6 37 5-1 6-11 R
Massey 69 35.2 54.6 9 41 5-2 6-11 VS
McNair 1003 70 37.9 53.1 6 41 5-2 6-10 S
Pioneer 2550 70 32.6 55.5 8 40 5-6 6-11 R
-
-
-
-
-- - -
-
-
-
-
-
-
-
-
-
-
- - - -
-
- -
-
-
-
- --
-
-
- -- -
--
- -
-
-
--
- --
- - -- -
NPotomac 68 34.4 55.8 12 44 5-8 6-15 S w
Saluda 76 33.3 56.4 14 38 5-3 6-10 R
Scotty 71 33.0 56.0 4 40 5-5 6-13 R
Severn 55 34.5 55.3 35 43 5-2 6-9 S
- -
--
-
-
--
-
-
-
- -
-
-
--
-
-
-
-
-
-
-- -
-
- -
--
-
--
- -
-
--
-
-
-
- - --
- -- - -
-Tyler 73 32.4 54.2 12 43 5-6 6-14 S
Wheeler 66 37.4 55.4 17 43 5-3 6-10 MR
+NC 79-20 64 37.5 56.7 28 45 5-2 6-13 R
+NC 80-36 63 30.7 50.6 4 37 5-4 6-9 MR
-
-
-
- -
- -
- -
-
- -
- - --
- -
-
-
--
-
-
-
-
-
-
- - - -
--
--
-
--
-
-
-
- -- -
-
-- -
-
-
-+NC 81-3 54 33.2 57.5 27 48 5-12 6-14 R
+NC 81-58 66 34.4 53.3 4 39 5-12 6-15 R
+NC 81-69 60 34.5 53.3 0 41 5-12 6-16 R
+NK 79-W8l0 66 35.4 57.2 10 41 5-1 6-10 R
1I
0at a taken from Granville County test.Table 13. Summary of wheat performance across the Piedmont.
Granville Lincoln Orange Rowan 1984 Average Two Year Average Three Year Average Variety County County County County Yield Test Wt. Yield Test Wt. Yield Test Wt.
or Line bu/A bu/A bu/A bu/A bu/A lbs/bu bu/A lbs/bu bu/A 1bs/bu
Caldwell 52 87 50 81* 67 52.9
Coker 747 61 86 71** 74* 72 53.7 64 56.9 55 54.6
Coker 916 76** 105* 62* 76* 79** 53.1 60 55.4 55 53.2
~o~e! ~8~ ____ Z2~ ___lQ9~*____ 6Z* ___ Z2~ ___ Z8~
___
§5~8____________________Compton 64 89 59* 80* 73 55.8
Fillmore 63 79 56* 74* 68 54.6
Florida 301 59 54 51 70* 60 53.9
~u~t~r______ §O____lQ3~ ____ 5§* ___ ~9____ §8____ §3~8____________________
Magnum 57 89 62* 83** 72 55.1
Massey 58 96 62* 75* 72 53.4 55 56.2 52 53.5
McNair 1003 63 101* 59* 82* 76* 51.6 60 53.9 56 51.9
~iQn~er g5§0 ___ §5____ ~9~ ____5~ ___ §5____ ZO ____ §3~7___ §6___ §5~8___ §8___ ~4~3__
Potomac 64 80 55* 82* 71 53.6 61 53.5
Saluda 63 98 69* 78* 76* 53.5 67 56.7 N
Scotty 62 94 61* 75* 72 55.7 65 56.7 ~
~eyern______ 17____ §7_____6~*___ §6____ ~8____ §4~3___ ~5___ §1~9___________
Tyler 68* 98 58* 79* 75* 52.8 71 52.2 62 51 .6
Wheeler 58 74 57* 78* 67 52.9 62 55.4 57 54.4
+NC 79-20 62 68 55* 74* 65 56.9
+~C_8Q-~6_____ ~8____ ~5_____4~ ___ §8____ §6____ ~0~4___ ~O___ ~2~4___________
+NC 81-3 54 56 46 70* 58 56.2
+NC 81-58 58 100* 57* 72* 70 52.6
+NC 81-69 54 99* 46 57 62 53.4
+~K_72-~810____ §2____ ~9_____5~*___ ZO~
___
§9____ §6~1____________________Mean of Test 61 88 57 73 69
B.L.S"]). K-50 8" 10 16 14 5
s.e. 3.2 4.4 5.0 4.8 2.2
**Highest yielder in test.
Table 14. Summary of wheat performance across the Coastal Plain.
Chowan Duplin Lenoir 1984 Average Two Year Average Three Year Average Variety County County County Yield Test Wt. Yield Test Wt. Yield Test Wt.
or Line bu/A bu/A bu/A bu/A lbs/bu bu/A lbs/bu bu/A lbs/bu
Caldwell 58* 58 69 63 58.1
Coker 747 69* 54 70 65 59.6
Coker 762 67* 61 79* 70* 55.3 54 55.1 51 54.6
~o~er Z9Z 5g* 12 5§ ~2
5Z.g _
~_
~6 5~.~ ~9 5~.~Coker 983 73** 61 82* 73 59.0
Compton 70* 60 72 68 59.7
Fillmore 62* 32 55 50 54.5
E1Qrid~ ~O! 6~* ~4 61 21 6Q.§ _
Florida 302 62* 58 80* 69* 57.5
Hunter 54* 62 74 65 54.4
Magnum 45 78** 62 62 59.4
~a~s~y 5!* §5 7~ §5 52.! ~2 5~.~ ~3 5~.Q _
McNair 1003 57* 59 68 63 54.9 49 55.3 51 55.1
Pioneer 2550 69* 59 77 70* 57.9 58 57.9 56 57.3 ~
Potomac 66* 45 72 63 58.8 50 57.7
~a!u~a 6g* Z6~ 81*~ Z5~* 6Q.~ ~2 6Q.Q _
Scotty 69* 60 76 69* 56.4 55 57.3
Severn 37 48 62 51 56.6 36 56.3
Tyler 68* 58 78* 70* 56.0 55 55.7 55 54.7
~h~e!er 5Z* §9~
6Z
25 5§.§ ~l 5~.! ~2 5~.~+NC 79-20 57* 57 67 61 56.4
+NC 80-36 54* 49 71 60 50.8 50 52.4
+NC 81-3 59* 34 51 49 59.2
+~C_8!-~8 6g* ~9 7~ §O 51.! _
+NC 81-69 56* 48 62 56 53.1
+NK 79-W810 40 69* 69 61 58.6
Mean of Test 59 56 70 63
B.L.S"]). K-50 " 24 TO 6" 6"
s.e. 7.1 4.2 2.7 2.6
**Highest yielder in test.
Table 15. Comparison of wheat entries for wheat and flour qualities (1984 data).
Variety
or Line Moisture% Protein%
Wheat Analysis
Flour Test
Yield Weight
Flour Analysis
1000 Wheat %
Kernel Wt. Appearancel! Ash Protein
Caldwell 12.2 9.5 70 63.4 30.0 VG .40 7.8
Coker 747 11.7 10.5 75 63.0 33.0 F .44 8.8
Coker 762 12.2 9.8 68 58.9 28.0 F .41 8.7
Coker 797 12.3 9.7 65 58.8 35.0 G .36 9.0
Coker 983 12.2 10.2 73 61.4 31.0 G .50 8.9
gomp~oD 12~3 lQ.Q
2
7 §2~1 ~5~0YG
~5Z 8~7__Fillmore 12.8 11.1 76 60.6 33.0 G .41 9.9
Florida 301 12.2 10.5 65 60.6 34.0 F .38 9.1
Florida 302 11.7 10.5 71 60.5 40.0 VG .38 9.3
Hunter 11.7 10.2 70 61.6 34.0 G .43 8.6
Magnum 11.9 10.0 69 60.3 33.0 F .37 8.3
~a!s~y 12~1 11.1
ZO
§0~8 ~8~0 P ~5~ 9~3__McNair 1003 12.6 10.0 70 61.2 38.0 G .45 8.0
Pioneer 2550 11.6 10.0 68 61.0 34.0 F .39 8.9
Potomac 12.7 11.8 71 62.5 38.0 G .40 10.2
Saluda 12.0 10.8 68 62.8 34.0 G .39 8.2
Scotty 11.7 11.0 73 62.1 33.0 P .43 9.6
Severn 12.0 10.4 71 60.2 32.0 G .36 9.7
Tyler 12~2 2.~ §7 §1~0 ~5~0 G ~4g 8~2__
Wheeler 12.2 11.2 70 64.3 39.0 F .37 10.0
+NC 79-20 12.8 11.2 70 60.0 40.0 G .39 10.3
+NC 80-36 11.9 12.0 69 55.0 31.0 F .40 10.1
+NC 81-3 12~2 12.3 66 62.6 33.0 F .44 11.0
+NC 81-58 12.1 11.5 66 61.4 38.0 G .37 9.9
+NC 81-69 12.5 12.0 63 60.1 38.0 P .45 10.4
+NK 79-W810 12.4 10.0 70 60.0 34.0 VG .39 8.9
lIWheat Appearance: G
=
Good, VG = Very Good, F=
Fair, P=
Poor. +Experimental.N