IJEDR1604110
International Journal of Engineering Development and Research (www.ijedr.org)717
Level of Asthma: A Numerical Approach based on
Voice Profiling
Gursimarjot Singh Walia, Gurjot Kaur Walia Student, National Institute of Technology, Kurukshetra Assistant Professor, Guru Nanak Dev Engineering College, Ludhiana
________________________________________________________________________________________________________
Abstract - The most natural form of communication known to human civilization is voice. A human voice is a function of human illness, emotion and disease, and therefore, analysis of human voice can help in extracting information about the health conditions. There exists various voice pathological issues related with neural, larynx, nasal and respiratory diseases, which, when diagnosed well in time, using voice analysis, can help in mitigating and/or curing the disease. Voice analysis is, presently, emerging as one of the potential areas of research in biomedical electronics. The mathematical relationship developed in this work correlated human voice parameters with presence of asthma and its levels, ranging from intermittent to severe.
Keywords - Asthma, Level of Asthma, Acoustic analysis, Regression analysis, Multi-Dimensional Voice Program, Computerized Speech Lab
________________________________________________________________________________________________________
INTRODUCTION
Voice communication is required in a person’s professional as well as in personal life. It is required for earning livelihood, expressing feelings, and in other day-to-day social interactions [1]. In police and Forensic Scientists, sometimes voice is the only clue available in identifying the criminal. The voice of each person is different because the anatomy of vocal cavity, oral cavity, nasal cavity, and vocal cords is specific to the individual. People in different countries, in fact, people in different parts of the same country, speak with different accents. There are some people who run their words together, and there are others who talk with pauses between their words [2].
There are several voice pathologic disorders related with nasal, neural, respiratory and larynx diseases. As a result, analysis and diagnosis of vocal disorders has become an important medical procedure. Table 1 shows the parameters that can be extracted using voice analysis, and the information that can be extracted from those voice parameters [4].
Voice involves two separate processes: first one produces an initial sound and the other one modifies it. For example, at the larynx, a sound is produced whose spectrum contains several different frequencies. Then, using tongue, teeth, lips, velum etc., the spectrum of that sound is modified over time. The energy required for producing sound while speaking comes from air expelled from the lungs. This flow passes between the vocal folds at the larynx. The vocal folds vibrate in voiced speech, which allows passage of air puffs, which, in turn, produces sound waves.
PARAMETERIC FEATURES OF VOICE [2]
Parameters Features Information extracted
Amplitude Shim (local, db) Variation in loudness of voice.
Frequency Jitter (local, absolute) Variation in pitch of voice.
Pitch Maximum/Minimum pitch Peaks of the sound spectrum of voice
Harmonic Noise-to-harmonic ratio Relative highness or lowness of voice.
Pulse Standard deviation of period, period of pulses Speech rate of speaker.
IJEDR1604110
International Journal of Engineering Development and Research (www.ijedr.org)718
Figure 1. Elements involved in speech production [1].A human voice is very closely related to the human health conditions, both physical and mental [6]. Changes in voice quality and pitch occur frequently in hormonal imbalances or deficiencies [7]. If a person is having some kind of illness, such as cough, cold, fever etc., or feeling some kind of emotion, such as happiness, sadness, stress, anxiety etc., then their voice would be different from what they sound when they are normal. By performing acoustic analysis on a person, a number of voice parameters can be extracted which can help in the diagnosis of various diseases like Parkinson, dysphonia, cardio-vascular diseases, and other respiratory tract infections and diseases, like asthma, Chronic Obstructive Pulmonary Disease (COPD) etc., which affect the person’s voice [4].
Asthma is a chronic lung disease, characterized by airway inflammation, airway obstruction and airway hyper-responsiveness. The common signs and symptoms of an acute asthma episode include coughing, wheezing, breathlessness, increased respiratory rate, chest tightness, chest or abdominal pain, fatigue, agitation, inability to participate in sports and increased pulse rate [2]. Coughing and wheezing are particularly experienced by the person during night time due to which they sometimes find difficulty while sleeping. Asthma can be allergic, exercise-induced, occupational, nocturnal or steroid- resistant. Steroid-resistant asthma is considered to be very severe type of asthma. At its onset, an asthma attack allows enough air to get into the lungs, but does not let CO2 leave the lungs at a fast enough rate. During a prolonged attack, CO2 can build up in the lungs, which in turn, can result in lowering of level of oxygen getting into the bloodstream. In comparison to a healthy person’s bronchiole, an asthmatic person’s bronchiole has swollen walls, lots of mucus and tightened muscles [8]. The level of asthma attacks can be (i) intermittent, (ii) mild, (iii) moderate, or (iv) severe [9]. Due to swelling and inflammation, the vocal cords do not vibrate efficiently, thus, make the person’s voice sound rough, hoarse or scratchy [10]. Furthermore, due to inflammation, excessive mucous is produced, which causes further obstruction in the airway [11]. Thus, by performing acoustic analysis and extracting the parameters, an asthmatic person’s voice can be differentiated from a healthy person’s voice. It is possible to control asthma symptoms by taking medication, regular check-ups by doctor, taking some drugs through inhalers etc. [12]. People suffering from asthma often have a history of cold before the onset of exacerbation. The cause of most exacerbations, however, remains controversial despite numerous studies [13]. In Australia, asthma is the leading cause of hospitalization of children with an increasing prevalence. The risk of asthma in children is significantly reduced if exclusive breast feeding is done for at least 4 months. Various factors present in early life, such as being male, low birth weight, young maternal age, maternal smoking etc., may result in an increased susceptance to asthma [14].
Few works on the detection of asthma using voice analysis have been done earlier. The value of Jitter and NHR is high for asthmatic people when compared with healthy people [4]. It is found that the value of Intensity is lower for asthmatic people when compared with the Intensity values for healthy people [10]. The people suffering from Chronic Obstructive Pulmonary Disease (COPD) have higher Shimmer values than healthy people [11]. The people having chronic cough (CC) and paradoxical vocal fold movement (PVFM) have low Maximum Phonation Time (MPT) and Intensity than healthy people [15].
This paper presents a method to determine the Level of Asthma mathematically, using voice analysis. For doing this, first, the voice samples are collected (both healthy and asthmatic), and then, the parameters are extracted using the Multi-Dimensional Voice Program (MDVP) tool of Computerized Speech Lab (CSL) system. Following this, the parameters showing significant variations are selected for formulation of the mathematical formula. Finally, a numerical formula is developed based on analysis of large number of voice samples. This formula differentiates healthy people from those having asthma, and furthermore, determines if the Level of Asthma is intermittent, mild, moderate, or severe.
This paper is organized as follows: An elaborated discussion on the procedural follow-up is contained in Section 2. Subsequent section presents discussion about the results and analysis. The work is concluded in Section 4.
METHODOLOGY
In order to find a correlation between human voice parameters and Level of Asthma, a total of 62 voice samples were collected. The number of samples collected for each of the five groups is specified in Table 2.
The people belonging to healthy group aged between 18 to 31 years, and those of asthmatic issues aged between 17 to 55 years.
NUMBER OF SAMPLES COLLECTED
Category Severe Asthma
Moderate Asthma
Mild Asthma
Intermittent
Asthma Healthy No. of
samples 10 5 15 10 22
The sequence of steps involved in the process is listed below: 1. Collection of voice samples of people from all the five groups.
2. Extraction of voice parameters using Multi-Dimensional Voice Program feature of Computerized Speech Lab. 3. Comparison between the five groups based on the values of extracted voice parameters.
4. Selection of voice parameters exhibiting significant changes.
5. Formulation (mathematical correlation) to determine Level of Asthma based on the selected voice parameters. The detailed description of each step involved in the process is given below.
Collection of voice samples
A vocal microphone (SM48-LC, SHURE) was used to record the samples with the adjustments as listed in Table 3. The routine used while recording the samples is described below:
IJEDR1604110
International Journal of Engineering Development and Research (www.ijedr.org)719
3. Phonation of /a/ sound for as long as possible.4. Repetition of Step 3 thrice.
ADJUSTMENTS FOR THE MICROPHONE
S.No. Requisites Value
1 Sampling Rate 44.1 kHz
2 Distance between microphone and mouth of person 12 cm 3 Angle between microphone and horizontal 450 Extraction of voice parameters
The first two steps of the routine (given in A) were used to extract the following voice parameters: Fo: Average Fundamental Frequency
Jitt: Jitter (%) Shim: Shimmer (%)
vFo: Coefficient of fundamental frequency variation DUV: Degree of Voiceless
DSH: Degree of Sub-Harmonics SPI: Soft Phonation Index DVB: Degree of Voice Breaks NHR: Noise-to-Harmonic Ratio
PPQ: Pitch Period Perturbation Quotient (%) RAP: Relative Average Perturbation (%) To: Average Pitch Period
The above parameters were extracted using the MDVP (Model 5105, KayPENTAX) tool of CSL (Model 4500, KayPENTAX) system.
The last two steps of the routine (given in A) were used to determine Maximum Phonation Time (MPT). Comparison of parameter values
The values, so obtained, were compared for further analysis. Selection of desired parameters
Upon comparing, it was found that there were several parameters that showed variation in values. Amongst all, few parameters showed significant variations, which were selected for developing the mathematical formula.
Numerical Analysis
The selected parameters were used for developing a linear relation of the form: LoA = n0 + (n1×p1) + (n2×p2) + (n3×p3) +… where LoA represents Level of Asthma,
n0, n1, n2, n3, … represent real values, p1, p2, p3, … represent MDVP parameters.
For example:
LoA= (0.025×Fo) + (0.08×DSH) - (0.012×Jitt) +… LoA = 0-0.99, would indicate that person is healthy.
LoA = 1-1.99, would indicate that person is suffering from asthma and Level of Asthma is Intermittent. LoA = 2-2.99, would indicate that person is suffering from asthma and Level of Asthma is Mild. LoA = 3-3.99, would indicate that person is suffering from asthma and Level of Asthma is Moderate. LoA = 4-4.99, would indicate that person is suffering from asthma and Level of Asthma is Severe.
The values of n0, n1, n2, … are determined using regression analysis. In this technique, a linear transformation of the predictor variables (here, n0, n1, n2, …), also called regression weights, is done in such a way that the sum of squared deviations of the observed and predicted output (here, LoA) values is a minimum [16].
RESULTS AND ANALYSIS
As per the process, voice samples from different groups were collected and compared. There were certain parameters that showed significant variations, which were finally considered for generating a mathematical correlation for the calculation of Level of Asthma. The selected parameters are explained below:
Jitter – It is evaluated as the relative period-to-period variation in pitch within the voice sample. Due to airway inflammation and swelling of airways, the variation in voice pitch is expected to increase due to the inability of vocal cords to support a periodic vibration for a defined period. Excessive production of mucous further increases the pitch variations. Thus, an increase in value of jitter would increase the severity of asthma.
Shimmer – It is evaluated as the relative period-to-period variation of the peak-to-peak amplitude within the voice sample. Due to the presence of noise in the voice signal, usually hoarse and breathy voices, the shimmer value is expected to reduce, though, the variation could be too little.
Fundamental Frequency – It is evaluated as the average of all extracted period-to-period fundamental frequency values. Due to swelling of airways and mucous production, the fundamental frequency is expected to reduce, though, not too much.
Maximum Phonation Time – It is evaluated as the time for which a person can phonate /a/ continuously without any breaks. In this process, three trials were done per person and the highest value was considered. Due to obstruction in the airways and breathiness, the maximum phonation time is expected to reduce.
IJEDR1604110
International Journal of Engineering Development and Research (www.ijedr.org)720
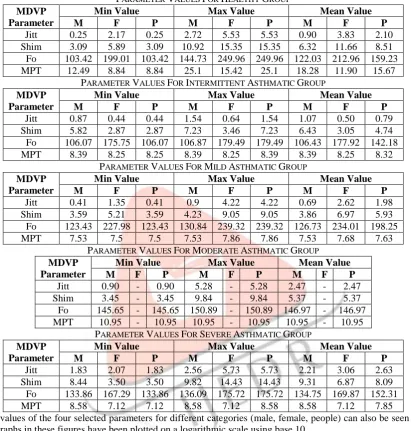
people (include combined data for both males and females) were considered separately. Tables 4, 5, 6, 7 and 8 show the minimum, maximum and mean values of the MDVP parameters for healthy and asthmatic males, females and people respectively. The abbreviations used in these tables are as following:Min – Minimum, Max – Maximum M – Males, F – Females
P – People (males and females combined)
PARAMETER VALUES FOR HEALTHY GROUP MDVP
Parameter
Min Value Max Value Mean Value
M F P M F P M F P
Jitt 0.25 2.17 0.25 2.72 5.53 5.53 0.90 3.83 2.10
Shim 3.09 5.89 3.09 10.92 15.35 15.35 6.32 11.66 8.51 Fo 103.42 199.01 103.42 144.73 249.96 249.96 122.03 212.96 159.23 MPT 12.49 8.84 8.84 25.1 15.42 25.1 18.28 11.90 15.67
PARAMETER VALUES FOR INTERMITTENT ASTHMATIC GROUP MDVP
Parameter
Min Value Max Value Mean Value
M F P M F P M F P
Jitt 0.87 0.44 0.44 1.54 0.64 1.54 1.07 0.50 0.79
Shim 5.82 2.87 2.87 7.23 3.46 7.23 6.43 3.05 4.74
Fo 106.07 175.75 106.07 106.87 179.49 179.49 106.43 177.92 142.18
MPT 8.39 8.25 8.25 8.39 8.25 8.39 8.39 8.25 8.32
PARAMETER VALUES FOR MILD ASTHMATIC GROUP MDVP
Parameter
Min Value Max Value Mean Value
M F P M F P M F P
Jitt 0.41 1.35 0.41 0.9 4.22 4.22 0.69 2.62 1.98
Shim 3.59 5.21 3.59 4.23 9.05 9.05 3.86 6.97 5.93
Fo 123.43 227.98 123.43 130.84 239.32 239.32 126.73 234.01 198.25
MPT 7.53 7.5 7.5 7.53 7.86 7.86 7.53 7.68 7.63
PARAMETER VALUES FOR MODERATE ASTHMATIC GROUP MDVP
Parameter
Min Value Max Value Mean Value
M F P M F P M F P
Jitt 0.90 - 0.90 5.28 - 5.28 2.47 - 2.47
Shim 3.45 - 3.45 9.84 - 9.84 5.37 - 5.37
Fo 145.65 - 145.65 150.89 - 150.89 146.97 - 146.97 MPT 10.95 - 10.95 10.95 - 10.95 10.95 - 10.95
PARAMETER VALUES FOR SEVERE ASTHMATIC GROUP MDVP
Parameter
Min Value Max Value Mean Value
M F P M F P M F P
Jitt 1.83 2.07 1.83 2.56 5.73 5.73 2.21 3.06 2.63
Shim 8.44 3.50 3.50 9.82 14.43 14.43 9.31 6.87 8.09 Fo 133.86 167.29 133.86 136.09 175.72 175.72 134.75 169.87 152.31
MPT 8.58 7.12 7.12 8.58 7.12 8.58 8.58 7.12 7.85
The mean values of the four selected parameters for different categories (male, female, people) can also be seen in Figures 2, 3 and 4. The graphs in these figures have been plotted on a logarithmic scale using base 10.
Figure 2. Mean values of acoustic parameters for males. Figure 2. Mean values of acoustic parameters for males.
IJEDR1604110
International Journal of Engineering Development and Research (www.ijedr.org)721
Figure 4. Mean values of acoustic parameters for people.Based on the selected parameters, a mathematical formula, as stated in eqn. 1, was developed, using regression analysis, to determine the Level of Asthma in a person.
LoA = (1.126×Jitt)-(0.045×Shim)-(0.012×Fo)-(0.285×MPT)+ 5.319
(1)
When the above formula was tested, 93% of the samples showed satisfactory results. The results obtained for Level of Asthma are shown in Figure 5.
Figure 5. Values of Level of Asthma CONCLUSION
It can be deduced that the mathematical formula generated yields accurate results, since 93% of the samples complied with the formula. The formula, so generated, can, thus, be utilized to determine the Level of Asthma in a person, if jitter, shimmer, average fundamental frequency and maximum phonation time can be accumulated by some means. Thus, voice analysis has proved to be an important measure for determining the severity of asthma in a person. The developed numerical formula can be implemented using electronic and mechanical components, like resistors, springs, inductors and capacitors. The circuit, so developed, can directly be linked to the human voice, which would serve as the input, and the output produced would indicate the Level of Asthma.
REFERENCES
[1] Dixit, Vikas Mittal, Yuvraj Sharma. “Voice Parameter Analysis for the disease detection”. IOSR Journal of Electronics and Communication Engineering, eISSN: 2278-2834, p-ISSN: 2278-8735, Volume 9, Issue 3, Ver. I, May-Jun 2014, PP 48-55. [2] Pragnesh Parmar, Udhayabanu R. “Voice Fingerprinting: A Very Important Tool against Crime”. J Indian Acad Forensic
Med. Jan- March 2012, Vol. 34, No.1, ISSN: 0971-0973.
[3] Harish Chander Mahendru. “Quick Review of Human Speech Production Mechanism”. International Journal of Engineering Research and Development, eISSN: 2278-067X, pISSN: 2278-800X, Volume 9, Issue 10 (January 2014), PP. 48-54.
[4] Khushboo Batra, Swati Bhasin, Amandeep Singh. “ Acoustic Analysis of voice samples to differentiate Healthy and Asthmatic persons”. International Journal of Engineering and Computer Science, ISSN 2319-7242, Volume 4, Issue 7, July 2015, Page No. 13161-13164.
[5] http://newt.phys.unsw.edu.au/jw/voice.html
[6] Cyril R. Pernet et al. “The human voice areas: Spatial organization and inter-individual variability in temporal and extra-temporal cortices”. Neuroimage 119(2015) 164-174.
[7] Friedrich S. Brodnitz. “Hormones and the Human Voice”, Bulletin of the New York Academy of Medicine 03/1971; 47(2):183-91.
[8] http://www.howourlungswork.com
[9] http://www.chp.edu/CHP/Levels+of+Asthma
[10] Sonu, R.K. Sharma. “Disease Detection using Analysis of Voice Parameters”. International Journal of Computing Science and Communication Technologies, Vol. 4, No. 2, January 2012, ISSN 09743375.
[11] Anuradha Shastry, Radish Kumar Balasubramanium, Preetam R Acharya. “ Voice Analysis in Individuals with Chronic Obstructive
Pulmonary Disease”. International Journal of Phonosurgery and Laryngology, July-December 2014; 4(2):45-49.
[12] Rachna, Dinesh Singh, Vikas. “Feature Extraction from Asthma Patient’s voice using Mel-Frequency Cepstral Coefficients”. IJRET eISSN: 2319-1163, pISSN: 2321-7308, Volume-3, Issue-6, Jun-2014.
[13] Sebastian L Johnston et al. “Community study of role of viral infections in exacerbations of asthma in 9-11 year old children”. BMJ 1995; 310:1225-8.
IJEDR1604110
International Journal of Engineering Development and Research (www.ijedr.org)722
[15] Anne E. Vertigan, Deborah G. Theodoros, Alison L. Winkworth, Peter G. Gibson. “Acoustic and Electroglottographic VoiceCharacteristics in Chronic Cough and Paradoxical Vocal Fold Movement”. Folia Phoniatr Logop 2008;60:210-216, DOI: 10.1159/000136902.