Neutron Star Physics and EOS
James M. Lattimer1,a
1Department of Physics & Astronomy, Stony Brook University, Stony Brook, NY 11794-3800, USA
Abstract. Neutron stars are important because measurement of their masses and radii will determine the dense matter equation of state. They will constrain the nuclear mat-ter symmetry energy, which controls the neutron star matmat-ter pressure and the inmat-terior composition, and will influence the interpretation of nuclear experiments. Astrophysi-cal observations include pulsar timing, X-ray bursts, quiescent low-mass X-ray binaries, pulse profiles from millisecond pulsars, neutrino observations from gravitational collapse supernovae,and gravitational radiation from compact object mergers. These observations will also constrain the neutron star interior, including the properties of superfluidity there, and determine the existence of a possible QCD phase transition.
1 Introduction
The study of neutron stars plays a vital role in nuclear physics and QCD. Their structure depends in a straightforward way on the dense matter equation of state (EOS). Measurement of their masses, radii, moment of inertia and tidal deformability, to mention just a few global parameters, will tightly constrain the dense matter equation of state, including the properties of the nuclear symmetry en-ergy. They will therefore aid in the interpretation of nuclear experiments and heavy-ion collisions. Among the astrophysical observations that are relevant are pulsar timing, thermal emission from X-ray bursters and quisecent low-mass X-X-ray binaries, temporal variations in emissions from rotating, bursting sources, neutrinos emitted from gravitational collapse supernovae and proto-neutron stars, and gravitational radiation from compact object binaries. These observations will help decipher the composition of the neutron star interior, including the extent and properties of nucleon superfluids, and determine the existence of a possible QCD phase transition. Applications to nuclear physics are therefore supplemented by those to condense matter physics and QCD.
This article summarizes how general relativity and causality, coupled with accurate pulsar-timing mass and rotation measurements, constrain neutron star structure independently of assumptions about the dense matter EOS and other astronomical observations. It will detail how including well-understood information about the neutron star’s crust, newly determined theoretical calculations of neutron matter, and nuclear structure data concerning the nuclear symmetry energy, allows the tight-ening of these constraints. It will show how further assumptions concerning the presence of a quark-hadron or other phase transition in the star’s interior allows even further limits to be developed. These structure limits will be compared to ongoing astrophysical observations from which mass and radius information can be inferred. The prognosis for further progress from new observations is discussed.
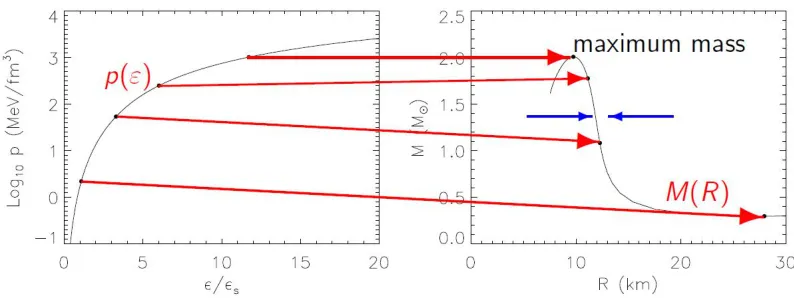
Figure 1.The left panel shows the EOS. Each dot represents the central pressure or energy density which leads to the indicated mass and radius in the right panel showing the fullM−Rcurve. is indicated in units of the nuclear saturation density for symmetric matter,s150 MeV fm−3. There is a maximum central pressure which leads to a maximum mass; higher central densities lead to gravitational collapse to black holes.
2 Neutron Star Structure
The general relativistic equations of stellar structure are
d p dr =−
G c4
(mc2+4πpr3)(+p) r(r−2Gm/c2) ,
dm dr =4π
c2r
2. (1)
Herem(r) is the mass interior to radiusr,is the mass energy density, and pis the pressure. They provide a one-to-one correspondence between the equation of state (EOS,p()) and theM−Rcurve, whereM = m(R) is the total mass andRis the total radius (Fig. 1). Obvious characteristics of the M−Rcurve are the existence of a maximum mass and a relatively constantRover a wide mass range from 1 to 1.8M. The former is a consequence of the factorr−2Gm/c2in the denominator of Eq. (1): as the compactnessm/rincreases, the pressure gradient required for stability grows. Even an infinite pressure won’t stabilize sufficiently compact and massive configurations. The latter feature can be understood by ignoring relativity altogether and dimensionally analyzing these equations. Assuming the polytropic relationp=Kγfor the EOS throughout a star, one finds the mass-radius relation
M=Q(γ)K1/(2−γ)R(4−3γ)/(2−γ), (2)
whereQis a constant. We therefore find for low-density stars thatM∝K3/2R0, or the total massMis independent of the stellar radiusR. Indeed, the mass approaches the so-called minimum neutron star mass, about 0.1Mas the compactnessβ=GM/Rc2 → 0. Above the nuclear saturation density
s,
realistic EOSs haveγ2, for whichR∝K1/2M0, or the radius is independent of the mass. This holds untilβbecomes large (i.e.,β >∼0.1) and general relativity can no longer be ignored. In both cases, the value ofKis quantitatively important in determining either the limiting mass or radius. These features are apparent in theM−Rcurve displayed in Fig. 1.
The maximum compactness is a relevant quantity, as it determines the minimum radius as a func-tion of mass. While an extreme limit from Eq. (1) appears to beβ =1/2, a more restrictive limit follows from the analytic solution of these equations in the case thatγ→ ∞, the incompressible case for which=c=3M/(4πR3), a constant. In this case, the pressure in the star’s interior is
p(r)= 3βc 4
4πGR2
1−2β(r/R)2− 1−2β
The denominator vanishes at the star’s center forβ = 4/9, but causality requires that pc = p(r =
0)< c, which impliesβ < 3/8. This holds for any star for whichd/dr ≤0 for allr[1]. However,
themaximally-compactconjecture[2] leads to the conditionβ <0.354[3]. This conjecture is that the maximum compactness, while ensuring causality, is achieved for the EOS p = −o for ≥ o,
andp =0 otherwise. At this limit, the maximum mass is achieved, and one finds the central energy density and pressure arec=3.034oandpc=2.034o, respectively[4]. Also, the maximum mass is
Mmax=0.0852
c4
G3 0
4.09
s 0
M. (4)
This result can be inverted to yield a maximum value for0based on the largest accurately measured neutron star mass, which is currently aboutMmax =1.97M[5]. In turn, we immediately obtain the maximum pressure or energy density in any neutron star
c,max=3.0340,max50.8s
M Mmax
2
, pc,max=2.0340,max34.1s
M Mmax
2
. (5)
The discovery of a star with M > 1.97M would decrease these limits. The M−Rcurve for the maximally-compactEOS, which is the solution to the structure equations scaled to achieveMmax, then
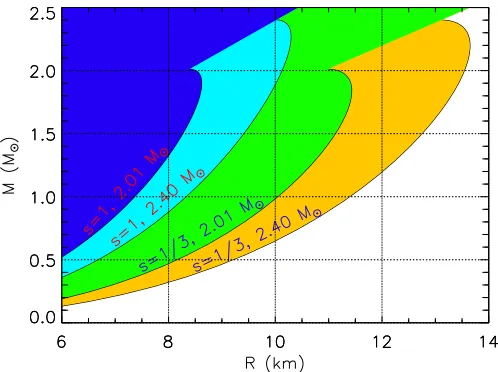
establishes a boundary of minimum radiiRas function of stellar massM. This is displayed in Fig. 2. Solutions assuming a limiting squared sound speeds=1/3 are also shown, which illustrate minimum radii for stars largely made from deconfined quark matter.
Figure 2. Mass-radius diagram showing regions excluded by causality and themaximally compactconjecture. Boundaries are indicated forMmax=2.01Mand 2.4Mand for sound speed squareds=1 and 1/3.
Themaximally compact conjecture is extreme in that it ignores the existence of a neutron star crust and the finite pressure of matter in the vicinity of the saturation densityns 0.16 fm−3orρs
most a 5% contribution from nuclei and neutrons[6]. The major contribution of baryons to the pressure is from the collective Coulomb pressure due to the nuclear lattice, and is therefore largely independent of uncertainties in the EOS of nuclear matter. Matter in neutron stars is in beta equilibirum, i.e., the energy is minimized with respect to proton concentration, leading to∂/n/∂x =μn−μp−μe =0,
wherex=np/n. As a consequence, the crust becomes progressively more neutron rich with increasing
density due to the increase inμe=c(3πnx)1/3with density.
Various calculations indicate that the transition from crustal material to uniform nuclear matter occurs in the rangen0≈ns/4−ns/2. We will assume the crust-core transition density isn0=ns/2.7,
and use the BPS [6] crustal EOS, for which the pressure, energy density and internal energy per baryon atn0 are p0 =0.243 MeV fm−3,0 = 56.39 MeV fm−3, andE0 = 12.13 MeV. Above this density, matter is a structureless uniform fluid.
The energy difference of uniform matter between pure neutron (x=0) and symmetric (x=1/2 matter is the symmetry energyS(n). It appears that matter with intermediate values of x can be described with a quadratic interpolation:
E(n,x)E(n,1/2)+S(n)(1−2x)2, (6)
E(ns,1/2)=−B −16 MeV. A convenient estimate for the symmetry energy nearnsis
S(n)=Sv(n/ns)γ, (7)
withSv = S(ns) Nuclear experimental information and neutron matter calculations indicate that
26 MeV<∼Sv<∼34 MeV and 0.3∼<γ <∼0.7, with the value ofγpositively correlated withSv. The cor-responding liquid droplet parameterL=3(ndS/dn)nsis 3Svγwhich is then 23 MeV<∼L<∼71 MeV.
This range is nicely corroborated by experimental studies of nuclear binding energies, dipole reso-nances, and neutron skin thicknesses[7].
The pressure corresponding to Eqs. (6) and (7) is
p(n,x)=n2∂E(n,x)
∂n p(n,1/2)+Svγns
n ns
γ+1
(1−2x)2. (8)
By definition, p(ns,1/2) = 0; to leading order, near ns, the symmetric matter pressure increases
linearly with density, p(n,1/2) (Ks/9)(n−ns), where Ks 240 MeV is the incompressibility
parameter. Beta equilibrium determinesxas a function of densityn, and is approximately
xβ 64S
3 v(n/ns)3γ
3π2(c)3+128S3 v(n/ns)3γ
(9)
which has the valuexβ 0.04 whenn =ns. Neutron matter pressure at saturation, using Eq. (7), is
p(ns,0)=γnsSv.Neutron star matter pressure is then
p(ns,xβ)γnsSv
⎡ ⎢⎢⎢⎢⎢ ⎣1−
4Sv
c
3 4γ−1
3π2γ
⎤ ⎥⎥⎥⎥⎥
⎦. (10)
The correction term in Eq. (10) is of order 1.4%, and can be ignored to good approximation.
Lattimer & Prakash[7, 8] found the phenomenological quasi-universal correlations between the radii of 1.4Mstars and neutron star matter pressure, a consequence of Eq. (2):
It serves as the fundamental connection between nuclear physics and neutron star structure. Another relation concerns the maximum spin frequency f of a neutron star. The mass-shedding limit occurs when f = fK, the Keplerian frequency phenomenologically determined to be[9, 10]
fK=1.08
M M
1/2 10 km
R
3/2
kHz, (12)
whereM andRrefer to thenon-spinningstar. The highest frequency pulsar known is PSR J1748-2446ad[11] with f =716 Hz, so fK≥ f andM≤2Mimply a limiting radius
R<∼10.5
kHz f
2/3 M M
1/3
km<∼16.6 km. (13)
For densities above the core-crust transition density, we employ piecewise polytropic regions with continuous pressures at the boundaries. Each regioni(ni−1 <n<ni) has the EOSp=ni−1(n/ni−1)γi,
motivated by Ref. [12], who found a 3-polytrope scheme could match, to about 4% rms error, the pressure-energy density relations for a large set of candidate EOSs below the central densities of 1.4M stars, including exotic EOSs with kaons or hyperons. The starting density is the core-crust transition densityn0, and the other boundaries are fixed atn1 =1.85nsandn2 =3.7ns, respectively.
The EOS(p) in regioniis easily found:
(p)=
i−1−
pi−1
γi−1
p pi−1
1/γi
+ p
γi−1, γi=
ln(pi/pi−1) ln(ni/ni−1)
, (14)
wherei−1 =ni−1(mn+Ei−1) andEi−1is energy density and energy per baryon at the pointni−1. For densitiesn>n3matter is treated as a continuation of region 3. We will also consider a model in which the densitiesn1andn2are varied, so as to explore the possibility of strong phase transitions nearns.
The parameters of the first scheme are thusp1,p2andp3, supplemented byn1andn2in the second scheme. Neutron matter studies sets the limit 7.3 MeV fm−3 ≤ p
1 ≤21 MeV fm−3[13, 14], while p1 ≤ p2 ≤ p2cand p2 ≤ p3 ≤ p3care limits from stability and causality. Here, the causal limits,
indicated by subscriptc, are determined by
∂p
∂
ic
= γicpic ic+pic =
1, (15)
which is an implicit equation for pic given Eq. (14). Some parameter combinations can still be
disallowed if the maximum mass configurations have central pressurespc>p3because even though the EOS is causally limited atn3, causality could be violated at larger densities.
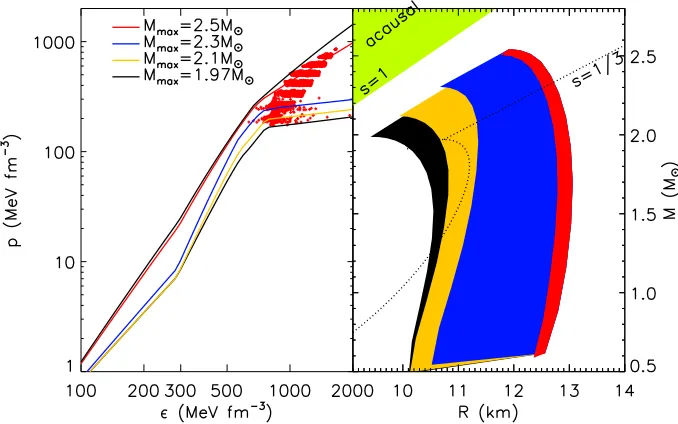
For the first model, it is found that causal configurations capable of supportMmax1.97Mmust have 100 MeV fm−3<
∼p2<∼250 MeV fm−3and 190 MeV fm−3<∼p3<∼1300 MeV fm−3. The lower limit ofp2is independent ofp1but its upper limit increases withp1. The lower limit top3isp2and its upper limit is also approximately linearly correlated with the value ofp2. There is a strong correlation betweenMmax andp2, but only a weak correlation betweenMmax andp3. It is also found thatR1.4 is highly correlated with bothp(ns) andp1, in accordance with Eq. (11), but not withp2or p3. The overall constraints on the EOS and the allowedM−Rregion are shown in Fig. 3. The allowed regions sensitively depend on the assumedMmax. Note forMmax=1.97Mthat 10.7 km<∼R1.4<∼13.1 km.
The case of variable densitiesn1andn2allows for strong phase transitions and widens the allowed radius range. The extreme cases are whenn1 =ns,n2 =4ns. andγ2 =0, for which the upper limit increases to 14.3 km, and whenn1 = n2 = ns andγ2 = 0 for which the lower limit decreases to 8.4 km, about 0.3 km larger than themaximally compactlimit. Realistically, the radius range is only moderately broadened, as it is unlikely a phase transition occurs close tons. It is also interesting to
Figure 3. Left panel: Allowed pressures as a function of energy density permitted by the assumed constraints on the low-density EOS, causality, and selected values forMmax. Red crosses indicate the central conditions for surviving EOSs. The black, yellow, blue and red lines are forMmax =1.97 M, 2.1M, 2.3M, and 2.5M,
respectively. Right panel: Allowed masses and radii for selected values ofMmax. Figure from Ref. [15].
3 Observational Constraints on Radii
The best current observational radius constraints originate from thermal emissions from photospheric radius expansion (PRE) Type I X-ray bursts and from quiescent low-mass X-ray binaries (qLMXBs). In the case of PRE bursts, two observational parameters can be identified:
FEdd,∞=GMcκD2
1−2β, A= F∞
σBTe f f4 ,∞
= fc−4
R
∞ D
2
. (16)
FEddis the Eddington flux, observed as the peak burst flux, andAis a normalization related to the
angular area. κis the opacity, FandTe f f are the flux and effective temperature on the cooling tail.
The subscript∞indicates the quantites are redshifted as observed on Earth. fc=Tc/Te f f contains the
effects of the atmosphere, whereTcis the color temperature. The observables can be combined into
two parameters
α= FEdd,∞ √
A
κD f2
cc3
=β(1−2β), γ= A FEdd,∞
f4
cc3
κ =
R
α1−2β. (17)
Real solutions forRexist ifα≤1/8. For 6 bursters examined by Özel and collaborators[16], 0.17≤
Two alternatives have been proposed to remedy the inconsistency. Ref. [17] suggested that the peak flux is observed when the photosphere is still levitated far above the surface, so the redshift factor
1−2βis missing fromFEdd. In this case,α=β
1−2βso thatα≤3−3/20.192 is required for real solutions. Now about 65% of Monte Carlo trials yield real solutions, withα 0.18 and 70 km
< γ <90 km being preferred. Radii in the range of 10 km to 12 km are then preferred.
Another possibility is that the bursts studied by Özel et al. are incompatible with the simple model proposed for them, but different sets of bursts, so-called ’passive’ bursts, may avoid the uncertainty of the photospheric radius and color correction fccompletely. In addition, these bursts may be studied
using information from the whole cooling tail rather than just near the peak and at late times. Nättilä et al.[18] recently performed a study of 3 sources with thiscooling tailmethod and showed that the parametersFEdd,∞ andA =D/R∞ = 1/
f4
cAcould be determined to about 3% and 1% accuracy,
respectively. The 3 sources have nearly identical values ofα = 0.117 and γ = 128 km to about 2%. Uncertainties inαare dominated by the distance and are about 10%, while uncertainties inγ are less than 4%. Nearly all Monte Carlo trials are accepted, and preferred values ofβ,MandRare 0.185,1.5Mand 12 km, respectfully, for all 3 sources.
The situation for qLMXBs is plagued by uncertainties in the amount of absorbing material be-tween them and Earth and the compositions of the stars’ atmospheres. A study by Guillot et al.[19] found individual radii for 5 sources ranged from 7 km to 20 km, but a combined analysis under the assumption that all sources must have a common radius yieldedR9.0±1.4 km. Ref. [20] concluded that different, but independently derived, interstellar absorptions and the possibility that some sources have helium, rather than hydrogen, atmospheres would resolve the large radius range conundrum, yielding a smaller range 8 km<R<11 km for the central values of the 5 sources. Nevertheless each source still had 20–30% uncertainties. These conclusions were confirmed by Ref. [21].
A novel approach to determining neutron star parameters from observations was a Bayesian ap-proach utilizing constraints on the allowed masses and radii from priors stemming from EOS, causal-ity and general relativistic considerations[17]. Without observational data, these priors predict radius ranges similar to those from the piecewise polytrope analysis above, 10.7 km<R1.4 <13.1 km. Ob-servational data from both PRE bursts and qLMXBs tend to favor a range with a smaller mean value, 10.7 km<R1.4<12.5 km, even including the possibility of strong phase transitions.
4 Conclusions
Our understanding of neutron star structure has advanced greatly in the last decade. The minimum value for the maximum mass has increased from about 1.5Mto 2M, and the uncertainties in typical radii have shrunk from over 5 km to about 2 km. Theoretical neutron matter calculations, the interpre-tation of experimental nuclear data, and the interpreinterpre-tation of astrophysical observations all yield very nearly the same ranges for neutron star radii. Other advances, only partly discussed here, include the discovery of quasi-universal (i.e., EOS independent) correlations between structural properties such as the compactnessβ, the binding energy, the moment of inertia and the tidal deformability which will greatly aid the interpretation of future obsevations from radio, X-rays and gravitational radiation.
Among the interesting prospects for further determinations of neutron star structure include:
• The moment of inertia of the pulsar PSR J0737-3039A from observations of periastron advance[22]. In principle, this has little systematic uncertainty.
• Gravitational radiation by Advanced LIGO and VIRGO from merging compact objects[26]. Tidal effects during inspiral offer the possibility of breaking the mass degeneracy in the observed chirp massM=(M1M2)3/5/M1/5through the measurement of the tidal deformabilityλ[27]. In addition, both merger and postmerger waveforms from black hole-neutron star and neutron star-neutron star have peak frequencies that correlate with either the compactnessβor ¯λ=λ/M5in a nearly universal way[28]. This is important, given an extremely strong universal correlation between ¯λandI[29].
References
[1] S. Weinberg,Gravitation and Cosmology(John Wiley & Sons, Inc., New York 1972), §11.6 [2] S. Koranda, N. Stergioulas and J.L. Friedman, Ap. J.488, 799 (1997)
[3] P. Haensel, J.P. Lasota and J. L.Zdunik, A & A344, 13 (1999)
[4] J.M. Lattimer and M. Prakash, inFrom Nuclei to Neutron Stars, ed. S. Lee (World Scientific, Singapore, 2011) 275
[5] P.B. Demorest et al., Nature467, 1081 (2010); J. Antoniadis et al., Science340, 448 (2013) [6] G. Baym, C.J. Pethick and P. Sutherland, Ap. J.170, 299 (1971)
[7] J.M. Lattimer and Y. Lim, Ap. J.771, 51 (2013) [8] J.M. Lattimer and M. Prakash, Ap. J.550, 426 (2001) [9] J.M. Lattimer and M. Prakash, Science304, 536 (2004);
[10] P. Haensel, J.L. Zdunik, M. Bejger and J.M. Lattimer, Ast. Ap.502, 605 (2009) [11] J.W.T. Hessels et al., Nature311, 1901 (2006)
[12] J.S. Read, B.D. Lackey, B.J. Owen and J.L. Friedman, Phys. Rev. D79, 124032 (2009) [13] K. Hebeler, J.M. Lattimer, C.J. Pethick and A. Schwenk, Ap. J.773, 11 (2013); [14] S. Gandolfi, J. Carlson and S. Reddy, Phys. Rev. C84, 032001 (2012)
[15] J.M. Lattimer and M. Prakash, Phys. Rep., submitted (2015) [16] F. Özel et al., arXiv:1505.05155 (2015)
[17] A.W. Steiner, J.M. Lattimer and E. Brown, Ap. J.722, 33 (2010) [18] J. Nättilä et al., arXiv:1409.06561 (2015)
[19] S. Guillot, M. Servillat, N.A>Webb and R.E. Rutledge, Ap. J.772, 7 (2013) [20] A.W. Steiner, J.M. Lattimer and E. Brown, Ap. J. Lett.765, L5 (2013) [21] C.O. Heinke et al., MNRAS444, 443 (2014)
[22] J.M. Lattimer and B.F. Schutz, Ap. J.629, 979 (2005)
[23] K. Gendreau, Z. Arzoumanian and T. Okajima, SPIE8443, 13 (2012) [24] D. Psaltis, F. Özel and D. Chakrabarty, Ap. J.707, 136 (2014); [25] M.C. Miller and F.K. Lamb, Ap. J.808, 31 (2015)
[26] J. Abadie et al., Class. Quant. Grav.27, 173001 (2010)
[27] E.E. Flanagan and T. Hinderer, Phys. Rev. D77, 021502 (2008)