International Journal of Chronic Obstructive Pulmonary Disease
Dovepress
O R I G I N A L R E S E A R C H
open access to scientific and medical research
Open Access Full Text Article
Pulmonary function tests, sputum induction,
and bronchial provocation tests: diagnostic tools
in the challenge of distinguishing asthma
and COPD phenotypes in clinical practice
Efrossini Dima1,2*
Nikoletta Rovina1,2*
Christina Gerassimou2
Charis Roussos1,2,3
Christina Gratziou2,3
1“Sotiria” Hospital for Diseases of the
Chest, Department of Respiratory Medicine, University of Athens, Medical School, Athens, Greece;
2“M. Simos” Laboratories, Department
of Critical Care and Pulmonary Services, Evangelismos Hospital, University of Athens, Athens, Greece;
3Asthma and Allergy Center, Evgenidion
Hospital, Pulmonary and Critical Care Department, Medical School, University of Athens, Athens, Greece; *These authors contributed equally to this work
Correspondence: Nikoletta Rovina 1st Department of Respiratory Medicine, “Sotiria” Hospital for Diseases of the Chest, University of Athens Medical School, 152 Mesogion Ave, Athens GR-11527, Greece
Tel +30 210 7763314 Fax +30 210 7239127 Email [email protected]
Background: Despite a number of important differences in the pathogenesis, course, and prognosis, asthma and chronic obstructive pulmonary disease (COPD) have many features in common. Furthermore, smoking induces considerable overlap in pathogenesis and clinical features between these conditions. This study aimed to reveal what inflammatory patterns prevail in clinically established diagnosis groups, including overlap phenotypes of asthma and COPD, and to evaluate the correlation with airway reversibility and hyperreactivity in these overlapping conditions.
Methods: A total of 110 patients (17 healthy subjects; 16 “healthy” smokers; 46 asthma patients: 24 smokers and 22 non-smokers; and 31 COPD patients: 10 COPD patients with reversibility and 21 without) participated in the study. Induced sputum, reversibility testing, methacholine and adenosine 5’monophosphate (AMP) provocation challenges, and skin prick testing were performed. Airways inflammation was assessed by differential cell counts, and cytokines (interleukin-8 [IL-8] and tumor necrosis factor-alpha [TNF-α]) were measured in induced sputum by enzyme-linked immunosorbent assay (ELISA).
Results: COPD patients with reversibility had increased sputum neutrophils, IL-8, and TNF-α levels compared to smoking asthmatics. No difference was found in inflammatory cells and cytokines between COPD subgroups. Sputum neutrophilia was inversely correlated with the change in forced expiratory volume in one second (∆FEV1) in smoking asthmatic patients (r =-0.563, P = 0.036). No correlation was found between airway hyperresponsiveness (AHR), either with methacholine or AMP, and inflammation in asthmatic patients, regardless of smoking. Reversibility was not correlated with inflammation in COPD patients. However, the response to AMP challenge was correlated with sputum neutrophils (r = 0.844, P = 0.001).
Conclusion: Although overlaps exist in the disease characteristics of asthma and COPD, the com-bination of lung function testing, sputum induction, and AHR reveals information that facilitates the distinction between these diseases, allowing clinicians to better tailor their therapy.
Keywords: asthma, COPD, smoking, lung function, airway hyperresponsiveness
Introduction
Although asthma and chronic obstructive pulmonary disease (COPD) are both defined by the presence of airflow obstruction; airway remodeling; and airway inflammation, the two conditions are clinically and pathophysiologically distinct.1–3 Studies on the
underlying inflammation demonstrate a difference in the preponderance of inflam-matory cells and mediators in each disease. However, in clinical practice, it has been recognized that a firm diagnosis between these diseases is often difficult to achieve.3–7
International Journal of Chronic Obstructive Pulmonary Disease downloaded from https://www.dovepress.com/ by 118.70.13.36 on 22-Aug-2020
For personal use only.
Number of times this article has been viewed
Dovepress
Dima et al
Therefore, it is quite common to observe patients with asthma showing COPD-like phenotypes, and vice versa, making it a priority to search for optimal prevention, treatment, and management strategies for these cases of coexisting lung obstructive diseases.
Asthma most often presents at a younger age as recur-rent episodes of increased airway obstruction that may have varying frequency and intensity, which then become recog-nized as a chronic pattern of reversible airway obstruction.1
In a subset of patients with long-term disease, reversibility of airway obstruction is diminished (due to airway remod-eling), and a disease pattern similar to COPD may ensue.4
Furthermore, smoking affects asthma by influencing the underlying airway inflammatory process;8 it increases airway
hyperresponsiveness (AHR), by the induction of airway inflammation and geometric changes of the airways due to airway smooth muscle hypertrophy, mucus hypersecretion, and loss of alveolar attachments.9,10 Furthermore, increases in
neutrophils have been described, thus resulting in asthmatics with a COPD phenotype.
COPD is a progressive disease of declining lung function, observed mainly in older adults with a history of cigarette smoking.2 However, although it is known that COPD is an
inflammatory response of the lungs, characterized by chronic airflow limitation that is not fully reversible,2 there is a
sub-group of COPD patients with reversibility, which has been associated with increased exhaled nitric oxide and sputum eosinophilia.11 COPD is often accompanied by AHR and
smoking seems to be a risk factor for increasing AHR over time, whereas smoking cessation improves AHR, both in asthma and COPD patients.12
Based on the above data, the aim of this study was: 1) to look for inflammatory parameters that might distinguish between asthma and COPD patients; and 2) to evaluate the inflammatory patterns in relation to airway reversibility and hyperreactivity in the subgroups of asthma and COPD that might lead to overlapping phenotypes; namely smoking asthmatics, and COPD patients with reversibility.
Methods
A total of 110 patients (17 healthy subjects; 16 “healthy” smokers; 46 asthma patients: 24 smokers and 22 non-smokers; and 31 COPD patients: 10 COPD patients with reversibility and 21 without) participated in the study. COPD patients were all current smokers (.15 pack-years) and so were smoker asthmatics (number of pack-years = packs smoked per day x years as a smoker). All “healthy” smokers were lifelong smokers ($15 pack-years), with no history of
lung disease, no chronic respiratory symptoms, and normal spirometry. Healthy non-smokers were asymptomatic and had no history of asthma or other respiratory disease, or any allergic condition. Atopic status was assessed by skin-prick testing using 13 common allergens applied to the forearm. The allergens tested (HAL Allergen Lab B.V., Haarlem, Netherlands) were house dust mites (Dermatophagoides
pteronyssinus and Dermatophagoides farinae), household
pets (cat and dog), pollens (mixed grass, olive, mixed weed, and Parietaria judaica), and moulds (Alternaria and Aspergillus fumigatus). Histamine and glycerinated saline solution were used as positive and negative controls. A skin-prick test result was considered positive if the mean wheal diameter was $3 mm.
Asthma was diagnosed using the American Thoracic Society guidelines.1 Stable asthma was defined as no asthma
exacerbation within the three months prior to study entry, and no respiratory infection or antibiotic use within the preced-ing six weeks. No smokpreced-ing asthmatic met Global Initiative for Chronic Obstructive Lung Disease (GOLD) guidelines for Stage I disease (forced expiratory volume in one second (FEV1) .80% predicted; FEV1/forced vital capacity (FVC) ratio ,70%).
COPD patients satisfied the European Respiratory Society (ERS) criteria11 for COPD and were selected
according to the GOLD13 criteria for COPD stages I and II
(FEV1/FVC # 0.7, and FEV1$ 0.8 and 0.5 , FEV1, 0.8, respectively) and with no evidence of emphysema, based on high-resolution computed tomographic scans of the lungs and the diffusing capacity of lung for carbon monoxide (DLCO). COPD patients having reversibility .9% of the predicted FEV1 were considered as COPD with reversibility.14,15
All participants met the following criteria: no use of inhaled or oral corticosteroids in the previous three months, and no respiratory tract infection six weeks prior to the study. Patients with co-morbidities, such as bronchiectases, interstitial diseases, and heart failure, were excluded.
None of the healthy smokers or non-smokers were receiving either long-acting bronchodilators or leukotriene modifiers. Asthmatics were taking only inhaled, short-acting, beta (β2) agonists on an “as needed” basis for their asthma. At the time of the study, all asthmatics (smokers or non-smokers) were in a stable clinical condition, as demonstrated by the low daily variability (,15%) of peak flow measurements during the two weeks prior to the study, and by the low variability in FEV1 performed during the study measurements. Peak flow measurements were performed only by the group of asthmatic patients.
International Journal of Chronic Obstructive Pulmonary Disease downloaded from https://www.dovepress.com/ by 118.70.13.36 on 22-Aug-2020
Dovepress Diagnostic tools for asthma and COPD
Nine out of 31 COPD patients were under treatment with inhaled tiotropium and inhaled, short-acting, β2 agonists as needed. Ten were receiving inhaled, short-acting, β2 agonists or ipratropium as needed and none were receiving long-acting bronchodilators. Before each measurement, subjects were asked not to use long- or short-acting β2 agonists and/or ipratropium for at least 12 hours prior to the tests, and tiotro-pium for 48 hours prior to the tests.
Each subject attended the laboratory for three separate visits within one week. On the first visit, sputum induction was performed after a reversibility test. On the second visit, patients underwent a methacholine provocation challenge and skin prick testing, and on the third visit, an adenos-ine 5’monophosphate (AMP) provocation challenge was performed. No variability was observed in FEV1 on each visit during baseline spirometry performed before the provocation tests.
All subjects gave informed consent for their participation in the study, which was approved by the Hospital ethics committee.
Pulmonary function and bronchial
hyperreactivity tests
Pulmonary function (FEV1 and FEV1/FVC) was measured with a dry wedge spirometer (Masterscreen, Jaeger, Hoechberg, Germany) according to standardized guidelines,14 by the
same technician, using the same spirometer. Reversibility test was performed 20 minutes after inhalation of 200 µg salbutamol via a metered dose inhaler. ∆FEV1 was calculated as: post-bronchodilator FEV1 minus pre-bronchodilator FEV1/post-bronchodialator FEV13 100.
Methacholine chloride and AMP (both Sigma Chemical, St. Louis, MO) were dissolved in normal saline solution to produce doubling concentrations of 0.39–200 mg/mL for methacholine, and 0.04–320 mg/mL for adenosine, and immediately used for bronchial challenge (Masterscreen, Jaeger, Hoechberg, Germany).16,17 The first nebulization
administered in each challenge was normal saline solution, and the post-saline solution FEV1 was used as the baseline for the calculation of subsequent percentage fall in FEV1. After challenge with saline solution, doubling concentrations of methacholine chloride were inhaled. Because of the effect of a deep inspiration on subsequent airway tone, only one measurement for FEV1 was performed, 60 to 90 seconds after inhalation of each concentration, unless the forced expiratory maneuvre was judged technically unsatisfactory.
The test was interrupted when a 20% decrease in FEV1 from the post-saline solution value was recorded, or when the
highest concentration was reached. A log dose-response curve was constructed for each challenge, and the provocative dose of methacholine or AMP required to produce a 20% fall in FEV1 (PD20) was calculated by logarithmic interpolation.
Sputum induction and processing
Sputum was induced by inhalation of hypertonic saline aerosol and processed as described previously.18 Briefly,
15 minutes after salbutamol inhalation (200 µg), normal saline (0.9%) and then hypertonic saline (3%, 4%, and 5%), nebulized by an ultrasonic nebulizer (ULTRA-NEB 2000, DeVilbiss Heathcare Inc, Somerset, USA), was inhaled for each concentration over a period of seven minutes. Subjects were encouraged to cough deeply after the seven minute intervals. All subjects produced an adequate aliquot of spu-tum which was processed within two hours after termination of the induction. Sputum samples were transferred to a petri dish and the volume and macroscopic characteristics of the whole sample recorded. Sputum plugs were separated from contaminating saliva using sterile forceps. The plugs were placed in a pre-weighed tube and the weight recorded. The sputum was then diluted three-fold with phosphate buffer solution containing freshly prepared dithiothreitol (Sigma Chemical Co, Poole, UK). Final concentration was 1 mmol/L. The sample was vortexed briefly and incubated at 37°C for 15 minutes with constant agitation. The suspension was filtered through monofilament filter cloth to remove mucus, centrifuged at 790 g-force for four minutes (4°C), and the pellet was re-suspended. Total cell counts were determined with a Neubauer haemocytometer (VWR International Ltd, Poole, UK) using tryptan blue exclusion to determine cell viability; dead cells and epithelial cells were excluded.
Cell smear preparations were made using a Cytospin 3 cytocentrifuge at 500 g-force for two minutes (Shandon Inc., Pittsburgh, PA, USA). Sputum cytospin slides were stained with May-Grünwald-Giemsa for differential cell counts. Counting of 400 non-squamous cells took place in a blinded fashion by one technician. Sputum samples contain-ing .20% of squamous cells and with cell viability ,70% were excluded from analysis as an indication of poor cytospin quality. The supernatant was stored at -80°C for subsequent assay for interleukin-8 (IL-8) and tumor necrosis factor-alpha (TNF-α) concentrations.
Measurement of IL-8 and TNF-α
The concentrations of TNF-α and IL-8 were determined by enzyme-linked immunosorbent assay (ELISA), using kits pur-chased from R&D Systems (Minneapolis, Minnesota, USA).
International Journal of Chronic Obstructive Pulmonary Disease downloaded from https://www.dovepress.com/ by 118.70.13.36 on 22-Aug-2020
Dovepress
Dima et al
The assays were carried out according to the manufacturer’s recommendations. The sensitivities of the assays used were 1.6 pg/ml and 3.5 pg/ml respectively.
Statistical analysis
Data were expressed as mean (±SE) or median values. IL-8 and TNF-α were expressed as the median value and the inter-quartile range. All calculations of PD20 were performed with the base-2 logarithm (log2), as this reflects doubling concentrations and normalizes the distribution. Patients already responding to saline were assigned a PD20 value half of the lowest concentration applied. Patients not responding to the highest concentration of methacholine or AMP were assigned a value twice the highest concentration applied. Dif-ferences between subject groups were initially assessed using a Kruskal–Wallis test and if significant, a Mann–Whitney rank test was then performed. Correlations between inflammatory cells and cytokine levels in sputum, smoking characteristics, or lung function parameters were calculated using Spearman’s rank correlation tests. Statistical analysis was not influenced by values at the lower limits of detection, since the non-parametric tests used were based on ranks of values. A p value of less than 0.05 was considered significant.
Results
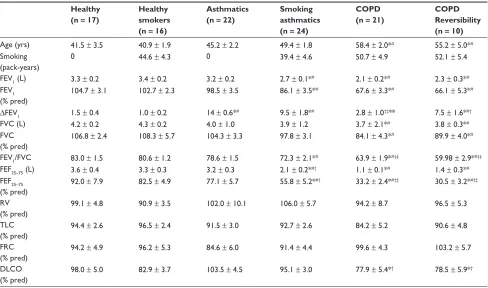
All smokers were matched for smoking pack-years. The clinical characteristics of the subjects participating in the study are shown in Table 1. COPD smokers were older than “healthy” smokers, non-smokers, asthmatics, and smoking asthmatics (P , 0.05).
Sputum cells – cytokines
The median (inter-quartile range) of cell percentages and cytokines in sputum are shown in Table 2. Smoking asth-matics had a significantly higher percentage of sputum neutrophils, and a significantly lower percentage of sputum eosinophils compared to non-smoking asthmatics (P , 0.05). This increase was less than in COPD patients. COPD patients with reversibility had increased neutrophils and eosinophils (P , 0.05) compared to asthma patients and compared to healthy control subjects (P , 0.05). No difference was seen in neutrophil and eosinophil percentages between smoking asthmatics and COPD patients with reversibility. Eosinophils were decreased in COPD patients with or without reversibil-ity, compared to non-smoking asthmatics (P , 0.05).
A statistically significant difference in IL-8 sputum levels, but not in TNF-α, was observed in asthma groups. The cytokines IL-8 and TNF-α were significantly increased
in COPD groups, whereas there was no difference in inflammatory cells and cytokines between the groups.
AHR
The mean PD20 methacholine and PD20AMP values, as well as the number of positive and negative provocation tests, are shown in Table 3. There were no statistically significant dif-ferences between groups, although more positive AMP tests were found in smoking groups, namely smoking asthmatics and COPD groups.
Correlation among reversibility,
inflammatory cells, and mediators
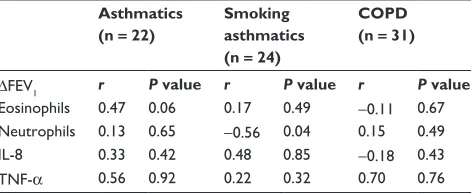
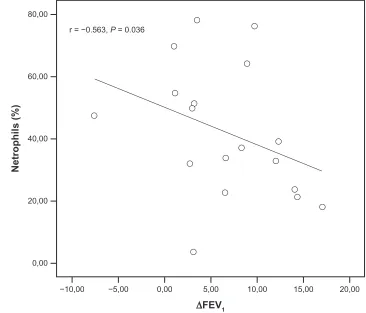
Reversibility was not correlated with inflammation, as expressed by sputum’s inflammatory cells and cytokines IL-8 and TNF-α in asthma and COPD groups (Table 4). However, ∆FEV1 was inversely correlated with sputum’s neutrophils in smoking asthmatics (Figure 1).
Correlation among AHR, spirometry,
inflammatory cells, and mediators
In asthma groups (non-smoking and smoking), FEV1 (% of predicted) was correlated with PD20methacholine (r = 0.637,
P = 0.006 and r = 0.548, P = 0.028 respectively) and with PD20AMP (r = 0.527, P = 0.034 and r = 0.544, P = 0.021 respectively).
In non-smoking asthmatics, PD20 methacholine was correlated with FEV1/FVC (r = 0.641, P = 0.006) and Forced Expiratory Flow 25%–75% (FEF25–75) (r = 0.575,
P = 0.05), whereas in smoking asthmatics, PD20AMP was correlated with FEV1/FVC (r = 0.565, P = 0.023) and FEF25–75 (r = 0.538, P = 0.031). Furthermore, PD20AMP was correlated with FEV1/FVC (r = 0.617, P = 0.019) and FEF25–75 (r = 0.627, P = 0.019) in COPD patients.
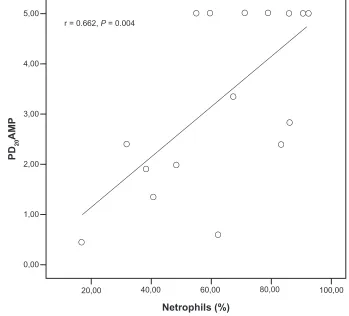
The response to AMP challenge was correlated with sputum’s neutrophilia (r = 0.662, P = 0.004) only in COPD patients (Figure 2).
Discussion
The main end-point of this study was to look for inflamma-tory parameters that might distinguish between asthma and COPD phenotypes in clinical practice. COPD patients with reversibility of airflow limitation did not differ significantly from smoking asthmatics. Interestingly, the percentage of sputum neutrophils was correlated with PD20AMP in COPD patients, but not in patients with asthma. This is a novel obser-vation to the authors’ knowledge. Finally, COPD patients, including the sub-group of COPD patients with reversibility,
International Journal of Chronic Obstructive Pulmonary Disease downloaded from https://www.dovepress.com/ by 118.70.13.36 on 22-Aug-2020
Dovepress Diagnostic tools for asthma and COPD
Table 1 Subject characteristics
Healthy (n = 17)
Healthy smokers (n = 16)
Asthmatics (n = 22)
Smoking asthmatics (n = 24)
COPD (n = 21)
COPD Reversibility (n = 10)
Age (yrs) 41.5 ± 3.5 40.9 ± 1.9 45.2 ± 2.2 49.4 ± 1.8 58.4 ± 2.0*# 55.2 ± 5.0*#
Smoking (pack-years)
0 44.6 ± 4.3 0 39.4 ± 4.6 50.7 ± 4.9 52.1 ± 5.4
FEV1 (L) 3.3 ± 0.2 3.4 ± 0.2 3.2 ± 0.2 2.7 ± 0.1*# 2.1 ± 0.2*# 2.3 ± 0.3*#
FEV1
(% pred)
104.7 ± 3.1 102.7 ± 2.3 98.5 ± 3.5 86.1 ± 3.5*# 67.6 ± 3.3*# 66.1 ± 5.3*#
∆FEV1 1.5 ± 0.4 1.0 ± 0.2 14 ± 0.6*# 9.5 ± 1.8*# 2.8 ± 1.0†‡** 7.5 ± 1.6*#†
FVC (L) 4.2 ± 0.2 4.3 ± 0.2 4.0 ± 1.0 3.9 ± 1.2 3.7 ± 2.1*# 3.8 ± 0.3*#
FVC (% pred)
106.8 ± 2.4 108.3 ± 5.7 104.3 ± 3.3 97.8 ± 3.1 84.1 ± 4.3*# 89.9 ± 4.0*#
FEV1/FVC 83.0 ± 1.5 80.6 ± 1.2 78.6 ± 1.5 72.3 ± 2.1*# 63.9 ± 1.9*#†‡ 59.98 ± 2.9*#†‡
FEF25–75 (L) 3.6 ± 0.4 3.3 ± 0.3 3.2 ± 0.3 2.1 ± 0.2*#† 1.1 ± 0.1*# 1.4 ± 0.3*#
FEF25–75 (% pred)
92.0 ± 7.9 82.5 ± 4.9 77.1 ± 5.7 55.8 ± 5.2*#† 33.2 ± 2.4*#†‡ 30.5 ± 3.2*#†‡
RV (% pred)
99.1 ± 4.8 90.9 ± 3.5 102.0 ± 10.1 106.0 ± 5.7 94.2 ± 8.7 96.5 ± 5.3
TLC (% pred)
94.4 ± 2.6 96.5 ± 2.4 91.5 ± 3.0 92.7 ± 2.6 84.2 ± 5.2 90.6 ± 4.8
FRC (% pred)
94.2 ± 4.9 96.2 ± 5.3 84.6 ± 6.0 91.4 ± 4.4 99.6 ± 4.3 103.2 ± 5.7
DLCO (% pred)
98.0 ± 5.0 82.9 ± 3.7 103.5 ± 4.5 95.1 ± 3.0 77.9 ± 5.4*† 78.5 ± 5.9*†
Notes: Values are expressed as mean ± SE. *denotes a significant difference vs healthy subjects; #vs healthy smokers; †vs asthmatics; ‡vs smoking asthmatics; and **vs COPD
with reversibility (P, 0.05).
Abbreviations: COPD, chronic obstructive pulmonary disease; FEV1, forced expiratory volume in one second; FVC, forced vital capacity; FEF25–75, forced expiratory flow
25–75; RV, residual volume; TLC, total lung capacity; FRC, forced residual capacity; DLCO, diffusing lung capacity for carbon monoxide.
Table 2 Patterns of inflammatory markers within clinical diagnosis groups
Healthy (n = 17)
Healthy smokers (n = 16)
Asthmatics (n = 22)
Smoking asthmatics (n = 24)
COPD (n = 21)
COPD Reversibility (n = 10)
Neutrophils % 41.3 (12.0–79.5) 47.4 (19.1–1.3) 22.5 (0.5–66.3) 50.1† (3.6–90.9) 67.9*#† (16.8–92.5) 69.2*#† (17.3–86.3) Eosinophils % 0.90
(0.3–6.5) 0.35 (0.1–2.1) 3.9*# (1.5–18.0) 1.5#† (0.3–20.8) 1.00† (0.2–3.4) 1.9#† (0.7–4.5) IL-8 (pg/ml) 750
(280–46176) 1130 (90–30570) 6410*# (727–9520) 10159*#† (194–61776) 20370*#†‡ (5090–64100) 19130*#†‡ (7480–39410) TNF-α (pg/ml) 13.7
(1.5–34.8) 19.7 (6.8–76.4) 6.7*# (1.5–37.7) 7.7# (22.5–139.2) 50.6*#†‡ (2.6–90.3) 47.9#†‡ (22.5–139.2) Notes: Values are expressed as median values (inter-quartile range). *denotes a significant difference vs healthy subjects; #vs healthy smokers; †vs asthmatics; and ‡vs smoking
asthmatics (P, 0.05).
Abbreviations: IL-8, interleukin-8; TNF-α, tumor necrosis factor-alpha.
had significantly increased sputum IL-8 and TNF-α levels compared to smoking asthmatics.
The increased percentage of neutrophils in smoking asthmatics was not significantly different to that in COPD smokers. However, percentage of sputum neutrophils was inversely correlated with ∆FEV1 in smoking asthmatics, but not in COPD smokers or COPD patients with reversibility.
The inflammatory pattern in induced sputum of smoking patients with asthma and COPD has been previously
studied.19–22 Our findings are in keeping with those of
Boulet et al who observed an increase in total cells and neutrophils in induced sputum of smoking asthmatics,21 and
with those of Chalmers et al, who observed a significant decrease in sputum eosinophils in smoking asthmatics.22
The reasons for the reduction in eosinophils have not yet been elucidated. It is suggested that exogenous nitric oxide (NO) in cigarette smoke increases the apoptosis of activated eosinophils.23,24 Furthermore, it has been shown that nicotine
International Journal of Chronic Obstructive Pulmonary Disease downloaded from https://www.dovepress.com/ by 118.70.13.36 on 22-Aug-2020
Dovepress
Dima et al
within tobacco smoke exerts secondary immunomodulatory effects on eosinophil function, by inhibiting the release of pro- inflammatory cytokines from macrophages.25,26
Interestingly, an inverse relationship between ∆FEV1 and the percentage of neutrophils in sputum of smoking asthmatics was shown, ie, the higher the sputum neutrophil count the lower the reversibility in currently smoking, steroid-naive, asthmatic patients. This finding is additive to the findings of previous studies, suggesting that neutrophilic inflammation contributes to irreversible airflow obstruction in asthma. Indeed, Shaw et al27 have previously shown that
post-bronchodilator FEV1 is associated with sputum neu-trophils. Increased sputum neutrophil count was associated with lower pre-bronchodilator FEV1, but to a lesser extent compared to the differential eosinophil count. Earlier studies have also shown a relationship between sputum neutrophils and FEV1. Woodruff et al28 demonstrated a relationship
between airway neutrophilia and persistent airflow limita-tion in asthma. After correcting for confounding factors, their analysis demonstrated that increased sputum neutrophil percentage was independently associated with lower FEV1, but not with PC20 (the concentration of the agonist leading to a fall in FEV1 of 20%).
A study by Little et al29 also demonstrated that
maxi-mal FEV1 was inversely correlated with the duration of disease and sputum neutrophils. Since we did not find any correlation between neutrophil count in sputum and FEV1 in non-smoking asthmatics, our data suggest that smoking-induced neutrophilia might be an important mediator of airway narrowing in asthma. Indeed, neutrophils and their products could contribute to airway narrowing in asthma in several ways. Neutrophils might cause airway narrowing secondary to mucus hypersecretion, either indirectly, through the production of mediators such as neutrophilic elastase, or directly, through direct goblet cell/neutrophil interaction.29,30
In addition, neutrophil products might be important mediators of epithelial cell activation.31 Finally, neutrophil products can
activate eosinophils.32 However, although neutrophils might
exert specific effects on the airways, leading to chronic air-way narrowing as a downstream effect of tissue injury, it is less clear if they release pro-inflammatory or pro-fibrotic cytokines.
The fact that we did not find any correlation between sputum neutrophil or sputum eosinophil percentages and ∆FEV1, in COPD patients or COPD patients with reversibility, is not peculiar. Papi et al11 also found increased
sputum eosinophils in COPD with reversibility, but the reversibility of airflow limitation, expressed as percentage of predicted or absolute increase in FEV1 after inhaled salbutamol, did not correlate with any sputum inflammatory cell type. Furthermore, Gross et al33 showed that greater
bronchodilator responses occurred in COPD patients with pre-bronchodilator FEV1 values ,55% of predicted, and were associated with cholinergic tone that was increased in proportion to the severity of airway obstruction. Therefore, it seems that the extent of bronchodilator response in COPD is not related to airway inflammation.
In this study, it was demonstrated that PD20 methacholine and PD20AMP levels are both associated with baseline FEV1 (% pred) in asthma groups, regardless of smok-ing habits. A positive correlation between the severity of bronchial hyperresponsiveness and FEV1 has been previ-ously observed.34 This could be explained by the fact that
a given stimulus will result in a larger bronchoconstrictor response in a subject with more severe airway obstruction than in a subject with less severe obstruction, resulting in a lower provocative concentration causing a 20% reduction in FEV1.34,35 Moreover, in non-smoking asthmatics, PD
20
methacholine was positively correlated with FEV1/FVC and FEF25–75, whereas in smoking asthmatics and COPD patients,
Table 4 Correlations between reversibility, inflammatory cells, and mediators
Asthmatics (n = 22)
Smoking asthmatics (n = 24)
COPD (n = 31)
∆FEV1 r P value r P value r P value
Eosinophils 0.47 0.06 0.17 0.49 -0.11 0.67 Neutrophils 0.13 0.65 -0.56 0.04 0.15 0.49
IL-8 0.33 0.42 0.48 0.85 -0.18 0.43
TNF-α 0.56 0.92 0.22 0.32 0.70 0.76
Abbreviations:∆FEV1, change in forced expiratory volume in one second; IL-8,
interleukin-8; TNF-α, tumor necrosis factor-alpha.
Table 3 PD20meth and PD20AMP in clinical diagnosis groups
Asthmatics (n = 22)
Smoking asthmatics (n = 24)
COPD (n = 21)
COPD Reversibility (n = 10)
PD20meth
(mcg)(+/-)
533.1 ± 345.5 (13/4)
513.5 ± 322.7 (11/6)
692.0 ± 340.7 (4/10)
495.0 ± 153.0 (6/4) PD20AMP
(mcg)(+/-)
3.8 ± 1.67 (12/6)
3.5 ± 1.67 (13/4)
3.2 ± 0.5 (7/7)
2.6 ± 0.5 (7/3) Notes: Values are expressed as mean ± SE. Figures in brackets refer to the number of positive and negative provocation tests.
Abbreviations: PD20meth, provocative dose of methacholine required to produce
a 20% fall in FEV1; PD20AMP, provocative dose of AMP required to produce a 20%
fall in FEV1.
International Journal of Chronic Obstructive Pulmonary Disease downloaded from https://www.dovepress.com/ by 118.70.13.36 on 22-Aug-2020
Dovepress Diagnostic tools for asthma and COPD
−10,00 0,00
20,00
Netrophils (%
)
40,00 60,00 80,00
r = −0.563, P = 0.036
−5,00 0,00 5,00
∆FEV1
10,00 15,00 20,00
Figure 1 Spearman’s rank correlation: ∆FEV1 and sputum neutrophil count in smoking asthmatics (n = 24).
PD20AMP, but not PD20 methacholine, correlated with FEV1/ FVC and FEF25–75, suggesting that PD20AMP provides a bet-ter reflection of disease severity in smoking related diseases. Methacholine acts directly on airway smooth muscle whereas AMP is an indirect stimulus that exerts its effect on inflamma-tory cells, subsequently leading to smooth muscle contraction and edema.36 Smoking can stimulate sensory nerve endings
in the airway wall, which subsequently release tachykinins, which in turn can cause smooth muscle contraction via binding to specific cell receptors.37,38 This is a possible
path-way for the effect of AMP in smoking patients. Furthermore, tachykinins may enhance hyperresponsiveness via induction of airway wall edema and mucus hypersecretion, and possibly via induction of smooth muscle hypertrophy resulting from chronic stimulation. Moreover, they can induce recruitment of inflammatory cells into the airways.36 Therefore, airway
hyperresponsiveness to AMP provides additional information with regard to airway inflammation and disease severity in smoking asthmatics and COPD patients.
Surprisingly, in asthmatic patients, no correlation was found between AHR and inflammatory cells and mediators. AMP mainly acts via the release of mast cell mediators.
The majority of studies on AMP responsiveness have been conducted in allergic patients.39,40
In order to describe the relationship between AHR and airway inflammation, excluding the potential confounding benefit of steroids, the subjects included were steroid-naive patients for at least three months. The absence of inhaled steroids, the clinical status (stable disease without symptoms for at least three months), and the presence of both atopic and non-atopic patients, might explain why we did not observe any association between sputum cells and AHR with both methacholine and AMP. In support of our findings, data from murine models show that AHR appears to be dissociated from eosinophilic inflammation.41,42
In COPD patients, a positive correlation between sputum neutrophil percentage and AHR was observed, suggest-ing a role of neutrophils in airway hyperresponsiveness. Willemse et al43 studied the effect of smoking cessation on
sputum inflammation and methacholine and AMP stimuli in smoker COPD patients. They showed that smoking cessation improved both direct and indirect airway hyperresponsiveness and that the number of neutrophils increased after six months smoking cessation and increased even more after 12 months
International Journal of Chronic Obstructive Pulmonary Disease downloaded from https://www.dovepress.com/ by 118.70.13.36 on 22-Aug-2020
Dovepress
Dima et al
smoking cessation. Our results might provide an explana-tion for these findings. Moreover, Cui et al44 transferred
Type 1 helper T (Th1) cells into IL-8 RRO mice in order to evaluate whether IL-8 plays a role in Th1-induced AHR. They found no reduction in AHR. Their study in mice is in line with our study in COPD patients, in which AHR cor-relates with sputum neutrophils, but not with IL-8 levels in sputum.
IL-8 sputum levels were statistically significantly higher in smoking asthmatics compared to non-smoking asthmat-ics, and although TNF-α levels were also higher in smoking asthmatics, the difference was not significant compared to non-smoking asthmatics. IL-8 is a pro-inflammatory media-tor and a neutrophil chemoattractant.44 However, in stable
asthma and COPD patients, it is not clear whether IL-8 plays a role as a chemoattractant for neutrophils, or as a proinflam-matory mediator that is released from neutrophils. There was no correlation between IL-8 and TNF-α and ∆FEV1 and AHR. Since we did not find IL-8 to be correlated with ∆FEV1, it might be suggested that IL-8 acts as an indicator of the severity of neutrophilic inflammation, rather than as an indicator of pulmonary function. Finally, IL-8 and
TNF-α were significantly increased in COPD patients with reversibility, compared to smoking and non-smoking asth-matics, whereas no difference was found in inflammatory cells and cytokines between the COPD groups.
In conclusion, it is evident, that the effect of smoking on airway inflammation is important and may influence the physiological characteristics of the airways differently in asthma and in COPD. Moreover, the different sputum inflammatory profile in smoking asthmatics and COPD patients, including COPD patients with reversibility, provides a role for sputum induction in clinical practice. However, more studies are needed in order for cut off values that differentiate asthma from COPD to be determined. Finally, the combination of sputum induction, reversibility, and AHR tests might be useful in diagnosing and monitoring chronic inflammatory airway diseases, and better managing their treatment.
Author contributions
ED and NR carried out the sampling and measurement of mediators, participated in the design and statistical analy-sis, and drafted the manuscript. CG analyzed the ELISAs.
20,00 0,00
1,00
PD
20
AM
P
2,00 3,00 4,00 5,00
r = 0.662, P = 0.004
40,00 60,00
Netrophils (%)
80,00 100,00
Figure 2 Spearman’s rank correlation: PD20AMP and sputum neutrophil percentage in COPD patients with reversibility (n = 10) and without reversibility (n = 21).
International Journal of Chronic Obstructive Pulmonary Disease downloaded from https://www.dovepress.com/ by 118.70.13.36 on 22-Aug-2020
Dovepress Diagnostic tools for asthma and COPD
CGr conceived of the study and participated in its design and coordination. CR participated in coordination. All authors read and approved the final manuscript.
Disclosure
The authors declare that they have no competing interests.
References
1. National Heart Lung and Blood Institute. Expert Panel Report 3:
Guidelines for the Diagnosis and Management of Asthma. Bethesda:
MD; 2007. NIH Publication No. 07–4051.
2. Rabe KF, Hurd S, Anzueto A, et al. Global strategy for the diagnosis, management, and prevention of chronic obstructive pulmonary dis-ease: GOLD executive summary. Am J Respir Crit Care Med. 2007; 176:532–555.
3. Fabbri LM, Romagnoli M, Corbetta L, et al. Differences in airway inflammation in patients with fixed airflow obstruction due to asthma or chronic obstructive pulmonary disease. Am J Respir Crit Care Med. 2003;167:418–424.
4. Barnes PJ, Shapiro SD, Pauwels RA. Chronic obstructive pulmonary disease: molecular and cellular mechanisms. Eur Respir J. 2003; 22:672–688.
5. Braman SS, Kaemmerlen JT, Davis SM. Asthma in the elderly: a comparison between patients with recently acquired and long-standing disease. Am Rev Respir Dis. 1991;143:336–340.
6. Chang J, Mosenifar Z. Differentiating COPD from asthma in clinical practice. J Intensive Care Med. 2007;22:300–309.
7. Yawn BP. Differential assessment and management of asthma vs chronic obstructive pulmonary disease. Medscape J Med. 2009;11(1):20. 8. Chaudhuri R, Livingston E, McMahon AD, et al. Cigarette smoking
impairs the therapeutic response to oral corticosteroids in chronic asthma. Am J Respir Crit Care Med. 2003;168:1308–1311.
9. Mitsunobu F, Ashida K, Metso T, et al. Influence of long-term cigarette smoking on immunoglobin E-mediated allergy, pulmonary function, and high-resolution computed tomography lung densi-tometry in elderly patients with asthma. Clin Exp Allergy. 2004;34: 59–64.
10. Tomlinson JEM, McMahon AD, Chaudhuri R, et al. Efficacy of low and high dose inhaled corticosteroid in smokers versus non smokers with mild asthma. Thorax. 2005;60:282–287.
11. Papi A, Romagnoli M, Baraldo S, et al. Partial reversibility of airflow obstruction and increased NO and sputum eosinophilia in chronic obstructive pulmonary disease. Am J Respir Crit Care Med. 2000;162:1773–1777.
12. Willemse BW, Postma DS, Timens W, et al. The impact of smoking cessation on respiratory symptoms, lung function, airway hyperrespon-siveness and inflammation. Eur Respir J. 2004;23:464–476. 13. Global Initiative for Chronic Obstructive Lung Disease (GOLD). Global
Strategy for the Diagnosis, Management, and Prevention of Chronic Obstructive Pulmonary Disease NHLBI/WHO Workshop report [revised
edition 2006]. Available from: http://www.goldcopd.com. Accessed Nov 25, 2006.
14. Quanjer PH, Tammeling GJ, Cotes JE, et al. Lung volumes and forced ventilatory flows. Report Working Party Standardization of Lung Function Tests, European Community for Steel and Coal. Official Statement of the European Respiratory Society. Eur Respir J Suppl. 1993;16:5–40.
15. Calverley PMA, Burge PS, Spencer S, et al. Bronchodilator revers-ibility testing in chronic obstructive pulmonary disease. Thorax. 2003;58:659–664.
16. Crapo RO, Casaburi R, Coates AL, et al. Guidelines for methacholine and exercise challenge testing-1999. Am J Respir Crit Care Med. 2000;161:309–329.
17. Rutgers SR, Timens W, Tzanakis N, et al. Airway inflammation and hyperresponsiveness to adenosine 5.-monophosphate in chronic obstruc-tive pulmonary disease. Clin Exp Allergy. 2000;30:657–662. 18. Rutgers SR, Timens W, Kaufmann HF, et al. Comparison of induced
sputum with bronchial wash, bronchoalveolar lavage and bronchial biopsies in COPD. Eur Respir J. 2000;15:109–115.
19. Simpson LJ, Scott R, Boyle MJ. Inflammatory subtypes in asthma: assessment and identification using induced sputum. Respirology. 2006;11:54–61.
20. Keatings VM, Barnes PJ. Granulocyte activation in induced sputum: comparison between chronic obstructive pulmonary disease, asthma and normal subjects. Am J Respir Crit Care Med. 1997;155: 449–453. 21. Boulet PL, Lemiere C, Archambault F, et al. Smoking and asthma.
Clinical and radiological features, lung function, and airway inflammation. Chest. 2006;129:661–668.
22. Chalmers G, MacLeod K, Thomson L, et al. Smoking and airway inflam-mation in patients with mild asthma. Chest. 2001;120:1917–1922. 23. Zhang X, Moilanen E, Lathi A, et al. Regulation of eosinophilic
apop-tosis by nitrice oxide: a role of c-Jun-N-terminal kinase and signal transducer and activator of transcription 5. J Allergy Clin Immunol. 2003;112:93–101.
24. Assrey J, Cunha F, Liew F, Moncada S. Feedback inhibition of nitric oxide synthase by nitric oxide. Br J Clin Pharmacol. 1993;108: 833–837.
25. Wang H, Yu M, Ocham M, et al. Nicotine acetylocholine receptor 7 subunit is an essential regulator of inflammation. Nature. 2003;421: 348–388.
26. Sopori M, Kozak W. Immunomodulatory effects of cigarette smoke.
J Neuroimmunol. 1998;83:148–156.
27. Shaw D, Berry M, Mckenna S, et al. Association between neutrophilic airway inflammation and airflow limitation in adults with asthma. Chest. 2007;132:1871–1875.
28. Woodruff P, Khashayar R, Lazarus S, et al. Relationship between airway inflammation, hyperresponsiveness, and obstruction in asthma.
J Allergy Clin Immunol. 2001;108:753–758.
29. Little SA, MacLeod KJ, Chalmers GW, et al. Association of forced expiratory volume with disease duration and sputum neutrophils in chronic asthma. Am J Med. 2002;112:446–452.
30. Takayma K, Augusti C, Ueki I, et al. Neutrophilic dependent goblet cell degranulation: role of membrane-bound elastase and adhesion molecules. Am J Physiol. 1998;275:L294–L302.
31. Nadel JA, Takeyama K, Austi C. Role of neutrophil elastase in hyper-secretion in asthma. Eur Respir J. 1999;13:190–196.
32. Amitani R, Wilson R, Rutman A, et al. Effects of human neutrophil elastase and Pseudomonas aeruginosa proteinases on human respiratory epithelium. Am J Respir Crit Care Med. 1991;1:26–32.
33. Gross NJE, Skorodin MS. Cholinergic bronchomotor tone in COPD: estimates of its amount in comparison with that in normal subjects.
Chest. 1989;96:984–987.
34. Ichinose M, Takahashi T, Suguira H, et al. Baseline hyperresponsiveness and its reversible component: role of inflammation and airway caliber.
Eur Respir J. 2000;15:248–253.
35. Kuwano K, Bosken CH, Pare PD, et al. Small airways dimensions in asthma and in chronic obstructive pulmonary disease. Am Rev Respir
Dis. 1993;148:1220–1225.
36. Lambert RK, Wiggs BR, Kumano K, et al. Functional significance of increased airway smooth muscle in asthma and COPD. J Appl Physiol. 1993;74:2771–2781.
37. Van Schoor J, Joos GF, Pawels RA. Indirect bronchial hyperresponsive-ness in asthma: mechanism, pharmacology and implication for clinical research. Eur Respir J. 2000;16:514–513.
38. Barnes PJ. Neurogenic inflammation in airways. Int Arch Allergy Appl
Immunol. 1991;94:303–309.
39. Hong JL, Rodge IW, Lee LY. Cigarette smoke-induced bronchoconstric-tion: cholinergic mechanisms, tachykinins, and cycloxygenase products.
J Appl Physiol. 1995;78:2260–2266.
International Journal of Chronic Obstructive Pulmonary Disease downloaded from https://www.dovepress.com/ by 118.70.13.36 on 22-Aug-2020
International Journal of COPD
Publish your work in this journal
Submit your manuscript here: http://www.dovepress.com/international-journal-of-copd-journal
The International Journal of COPD is an international, peer-reviewed journal of therapeutics and pharmacology focusing on concise rapid reporting of clinical studies and reviews in COPD. Special focus is given to the pathophysiological processes underlying the disease, intervention programs, patient focused education, and self management protocols.
This journal is indexed on PubMed Central, MedLine and CAS. The manuscript management system is completely online and includes a very quick and fair peer-review system, which is all easy to use. Visit http://www.dovepress.com/testimonials.php to read real quotes from published authors.
Dovepress
Dovepress
Dima et al
40. Meer de G, Heederik D, Postma DS. Bronchial responsiveness to adenosine 5’-monophosphate (AMP) and methacholine differ in their relationship with airway allergy and baseline FEV1. Am J Crit Care
Med. 2002;165:327–331.
41. Van de Berge M, Meijer JR, Kerstjens HAM, et al. PC20 adenosine 5’-monophosphate is more closely associated with airway inflamma-tion in asthma than PC20 methacholine. Am J Crit Care Med. 2001;163: 1546–1550.
42. Corry BD, Folkesson HG, Warnock ML, et al. Interleukine 4, but not interleukine 5 or eosinophils, is required in a murine model of acute airway hyperreactivity. J Exp Med. 1996;183:109–117.
43. Willemse BWM, ten Hacken NHT, Rutgers B, et al. Smoking cessation improves both direct and indirect airway hyperresponsiveness in COPD.
Eur Respir J. 2004;24:391–396.
44. Cui J, Pazddziorko S, Miyashiro P, et al. Th1-mediated airway hyper-resposiveness independent of neutrophilic inflammation. J Allergy Clin
Immunol. 2005;115:309–315.
International Journal of Chronic Obstructive Pulmonary Disease downloaded from https://www.dovepress.com/ by 118.70.13.36 on 22-Aug-2020