Western University Western University
Scholarship@Western
Scholarship@Western
Electronic Thesis and Dissertation Repository
8-5-2016 12:00 AM
Efficient and Virtualized Scheduling for OFDM-Based High
Efficient and Virtualized Scheduling for OFDM-Based High
Mobility Wireless Communications Objects
Mobility Wireless Communications Objects
Mohamed Hussein Abdelwahab Ahmed The University of Western Ontario
Supervisor
Dr. Abdallah Shami
The University of Western Ontario Joint Supervisor Dr. Serguei Primak
The University of Western Ontario
Graduate Program in Electrical and Computer Engineering
A thesis submitted in partial fulfillment of the requirements for the degree in Doctor of Philosophy
© Mohamed Hussein Abdelwahab Ahmed 2016
Follow this and additional works at: https://ir.lib.uwo.ca/etd Part of the Systems and Communications Commons
Recommended Citation Recommended Citation
Hussein Abdelwahab Ahmed, Mohamed, "Efficient and Virtualized Scheduling for OFDM-Based High Mobility Wireless Communications Objects" (2016). Electronic Thesis and Dissertation Repository. 3928. https://ir.lib.uwo.ca/etd/3928
This Dissertation/Thesis is brought to you for free and open access by Scholarship@Western. It has been accepted for inclusion in Electronic Thesis and Dissertation Repository by an authorized administrator of
Abstract
Services providers (SPs) in the radio platform technology standard long term evolution (LTE) systems are enduring many challenges in order to accommodate the rapid expansion of mobile data usage. The modern technologies demonstrate new challenges to SPs, for example, reducing the cost of the capital and operating expenditures while supporting high data through-put per customer, extending battery life-per-charge of the cell phone devices, and supporting high mobility communications with fast and seamless handover (HO) networking architecture. In this thesis, a variety of optimized techniques aimed at providing innovative solutions for such challenges are explored.
The thesis is divided into three parts. The first part outlines the benefits and challenges of deploying virtualized resource sharing concept. Wherein, SPs achieving a different schedulers policy are sharing evolved network B, allowing SPs to customize their efforts and provide ser-vice requirements; as a promising solution for reducing operational and capital expenditures, leading to potential energy savings, and supporting higher peak rates. The second part, formu-lates the optimized power allocation problem in a virtualized scheme in LTE uplink systems, aiming to extend the mobile devices’ battery utilization time per charge. While, the third part extrapolates a proposed hybrid-HO (HY-HO) technique, that can enhance the system perfor-mance in terms of latency and HO reliability at cell boundary for high mobility objects (up to 350 km/hr; wherein, HO will occur more frequent).
The main contributions of this thesis are in designing optimal binary integer programming-based and suboptimal heuristic (with complexity reduction) scheduling algorithms subject to exclusive and contiguous allocation, maximum transmission power, and rate constraints. More-over, designing the HY-HO based on the combination of soft and hard HO was able to enhance the system performance in term of latency, interruption time and reliability during HO. The results prove that the proposed solutions effectively contribute in addressing the challenges caused by the demand for high data rates and power transmission in mobile networks espe-cially in virtualized resources sharing scenarios that can support high data rates with improving quality of services (QoSs).
Keywords: LTE, Virtualization, QoSs, SPs Schedulers’ Policy, Resources Sharing, LTE UL Scheduling, Efficient Power Allocation, Mobility, Handover.
Acknowlegements
All praise goes to ALLAH for the blessing of completing this thesis. Pursuing doctoral degree in The University of Western Ontario is a memorable experience for me. It is with plea-sure that I write this page to express my joy and to acknowledge all those who have supported me in successfully completing this thesis. I have no doubt that I could not have been able to do it without the love, and support of my family, friends, and colleagues.
First and foremost, I would like to express my deepest gratitude and graciously apprecia-tion to my supervisors; Professor Abdallah Shami and Professor Serguei Primak for all their encouragement, fruitful cooperation, precious guidance, and philosophy that I have received and learned from them at every stage of the research. The valuable discussions we had were always a source of inspiration to me.
It is a wonderful feeling to express my thanks to my colleagues for their help in conducting the research. I am grateful for their valuable advice which I implemented in my experiments. I am also glad to extend my thanks to the Department of Electrical and Computer Engineering at Western University for their assistance while conducting my studies in the lab.
I owe a special word of indebtedness to my mother, father, and brothers. Although, they are thousands of miles away from me during the days I studied in Canada, I can always get the strongest support from them. There are no words sufficient enough to express my full gratitude to my parents.
My heartfelt thanks go out to my beloved wife for her constant inspiration, encouragement, sacrifice, and tolerance during my research work; I am extremely thankful to her for taking care of our sweet sons during this journey. My family and wifes prayers during this period have helped tremendously in completing the research work successfully.
Thank you,
Mohamed Hussein Abdelwahab Ahmed
Contents
Certificate of Examination ii
Abstract iii
Acknowlegements iv
List of Figures ix
List of Tables xii
Acronyms xiii
1 Introduction 1
1.1 Thesis Contributions . . . 2
1.2 Thesis Organization . . . 3
2 Background and Literature Review 5 2.1 Multicarrier Systems . . . 5
2.1.1 OFDM and OFDMA . . . 6
2.1.2 Key Challenges . . . 9
2.2 Background of LTE Systems . . . 10
2.2.1 LTE Objectives . . . 10
2.2.2 eNBs Main Functions . . . 11
2.2.3 LTE Performance of Demands . . . 11
2.2.4 LTE Performance with Respect to Mobility . . . 12
2.2.5 LTE Traffic Quality of Services . . . 12
2.2.6 LTE Spectrum Flexibility . . . 13
2.2.8 UL/DL Information Exchange . . . 19
2.3 Chapter Summary . . . 24
3 Sharing Resources in 3GPP-LTE Systems Framework 25 3.1 Introduction . . . 25
3.2 Related Work . . . 26
3.3 System Modeling Framework . . . 28
3.3.1 Data Transmission Sequence . . . 28
3.3.2 LTE Traffic Classes . . . 30
3.3.3 Transmission Block Size and MCSs . . . 33
3.3.4 LTE Frame work Scenario . . . 34
3.4 The Considered Scheduling Algorithms . . . 35
3.4.1 The Strict Priority Scheduling Algorithm . . . 37
3.4.2 The LWDF Scheduling Algorithm . . . 37
3.4.3 The UE’s Internal Scheduler . . . 41
3.5 Sharing Radio Resources Strategy . . . 41
3.6 Simulation Results . . . 46
3.6.1 Case Study and Results Analysis . . . 48
3.6.2 Larger Scale Scenario . . . 54
3.7 Virtualization and Resources Sharing in Two-Tier Cellular Networks . . . 54
3.7.1 Recent Relevant Research Work . . . 56
3.7.2 System Model . . . 57
Semi-Soft Allocation Technique . . . 58
Non-sharing Allocation Scenario . . . 60
Virtualized Sharing Allocation . . . 61
3.7.3 Simulation Results . . . 61
3.8 Chapter Summary . . . 64
4 Efficient Power Allocation in Virtualized 3GPP-LTE Systems 65 4.1 Introduction . . . 66
4.2 Recent Relevant Research Work . . . 68
4.3 System Model . . . 70
4.3.2 Transmission Block Size . . . 72
4.3.3 Transmission Power Calculation . . . 72
4.4 Problem Formulation . . . 73
4.4.1 Static Sharing Allocation Problem . . . 74
4.4.2 Dynamic Sharing Allocation Problem . . . 76
4.5 Scheduling Framework . . . 77
4.5.1 The BIP-based Resource Allocation Algorithm . . . 77
BIP Complexity . . . 79
4.5.2 The Heuristic Allocation Algorithm . . . 79
Static Sharing Scenario . . . 82
Dynamic Sharing Scenario . . . 82
Heuristic Complexity . . . 82
4.6 Simulation results . . . 83
4.7 Chapter Summary and Conclusion . . . 90
5 Intra-MME/S-GW Handover in Virtualized 3GPP-LTE Systems 92 5.1 Introduction . . . 93
5.2 Recent Relevant Research Work . . . 94
5.3 Users Mobility . . . 95
5.4 Handover in Wireless Systems . . . 98
5.4.1 Handover Algorithm and Message Sequence . . . 98
5.4.2 Hard Handover Technique . . . 102
5.4.3 Soft Handover Technique . . . 102
Macro Diversity Handover . . . 102
Fast Base Station Switching . . . 103
5.5 System Model . . . 104
5.5.1 Transmission Block Size . . . 104
5.5.2 LTE RSRP Measurement Report . . . 106
5.5.3 Traffic in Wireless System . . . 109
5.6 Hybrid-Handover Technique . . . 109
5.7 The Allocation Scheduling Algorithms . . . 111
5.7.2 Maximum Rate Scheduling Algorithm . . . 113
5.8 The Static and Virtualized Sharing Algorithm . . . 114
5.8.1 Static Sharing Allocation . . . 115
5.8.2 Virtualized Dynamic Sharing Allocation . . . 116
5.9 Simulation results . . . 117
5.10 Conclusion . . . 121
6 Thesis Summary and Future Work 125 6.1 Thesis Summary . . . 125
6.2 Future Work . . . 126
6.2.1 Optimal D2D User Allocation in Virtualized Scheduling Algorithm . . 127
6.2.2 Energy-Efficient for Green Smart Grid Communication in Virtualized Scheduling Algorithm . . . 127 6.2.3 Green Heterogeneous Networks in Virtualized Scheduling Algorithm . 128
Bibliography 130
Curriculum Vitae 143
List of Figures
2.1 OFDM with IFFT implementation (Tx). . . 7
2.2 Illustration of the OFDMA principle. . . 9
2.3 The evolutionary path of the LTE radio platform technology. . . 10
2.4 The LTE system architecture. . . 14
2.5 Frequency and time division duplex. . . 15
2.6 UL/DL time/frequency structure in case of FDD and TDD. . . 16
2.7 TDD configuration. . . 17
2.8 The relationship between a slot, symbols, and RBs. . . 19
2.9 The relationships between channel bandwidth, and transmission bandwidth configuration. . . 20
2.10 The transmission bandwidth configuration. . . 20
2.11 Inputs and outputs for the UL and DL scheduling algorithm. . . 21
2.12 The information exchange procedure in both UL and DL connection between an eNB, and two UEs. . . 23
3.1 MNOs sharing radio RBs in a single eNB. . . 29
3.2 The UEs’ data transmission sequence. . . 30
3.3 EF, AF, and BE considered traffic classes. . . 32
3.4 Spectral efficiency and transport block size versus SNR. . . 35
3.5 LTE flowchart forM MNOs,NUEs, and various Traffic Classes considered. . . 36
3.6 Pseudo-code for the strict priority scheduler. . . 38
3.7 Pseudo-code for the largest weight delay first scheduler. . . 40
3.8 The block diagram of the internal scheduler working procedure. . . 41
3.9 The pseudo-code for the UE’s internal scheduler. . . 42
3.10 MNOs, achieving different schedulers policy, and sharing radio RBs in a single eNB. . . 44
3.11 Two MNOs with 10 RBs each, and TTI for 3 frames scenario. . . 44
3.12 UEs per MNOs are distributed as near and far user from the eNB. . . 47
3.13 The throughput comparison of the S.P. and LWDF schedulers. . . 48
3.14 The average packet delay for different traffic classes with the S.P. and LWDF schedulers. . . 49
3.15 The average packet delay per different traffic classes for MNOs -1, and -2 with non-sharing scenario. . . 49
3.16 Average packet delay with sharing scenario (w1=0.2, RB1=14, andw2=0.4, RB2=12). . . 51
3.17 Average packet delay with sharing scenario (w1=0.8, RB1=13, andw2=0.3, RB2=18). . . 51
3.18 Queue length in the UE-1’s buffer before sharing radio RBs. . . 52
3.19 Queue length in the UE-1’s buffer after sharing radio RBs. . . 52
3.20 Average AF packet delay with respect to variation of weight of sharing. . . 53
3.21 Average BE packet delay with respect to variation of weight of sharing. . . 53
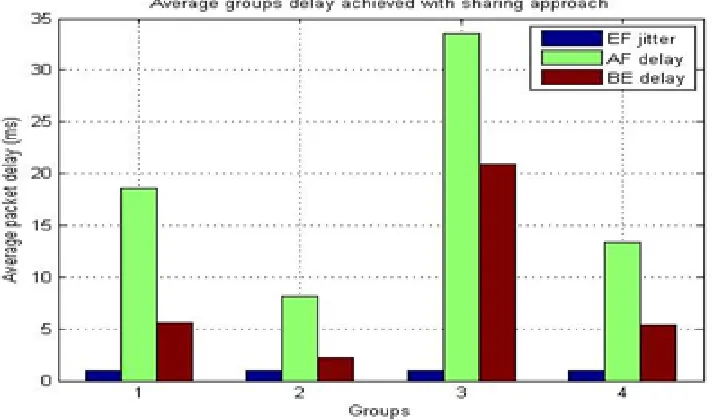
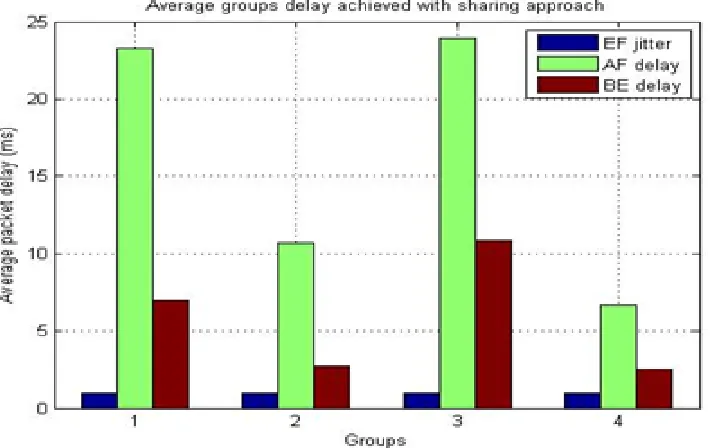
3.22 Average packet delay per different traffic classes for MNOs -1, and -2. . . 55
3.23 Average packet delay with sharing scenario (w1=0.2, andw2 =0.4). . . 55
3.24 Average packet delay with sharing scenario (w1=0.8, andw2=0.3). . . 56
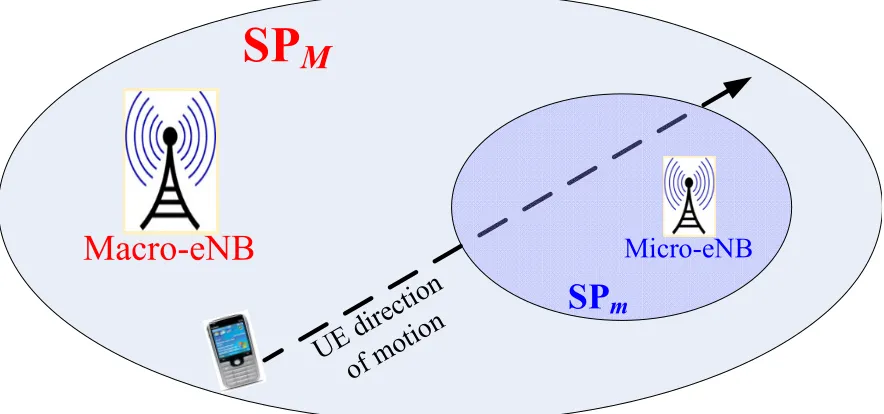
3.25 Two-tier cellular network topology. . . 58
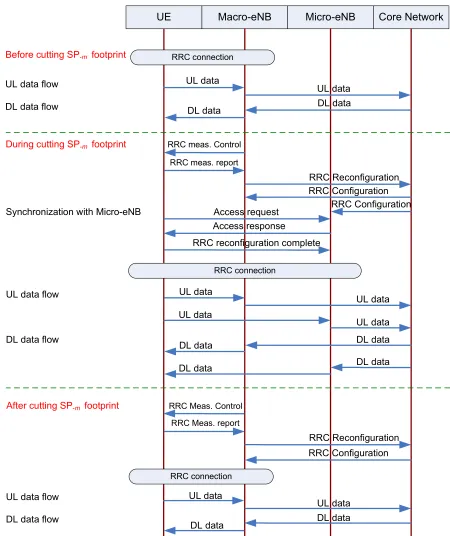
3.26 Allocation message sequence between the two-tier cellular networks. . . 59
3.27 The average packets delay (EF and non-EF traffic) for UEM before, during, and after passing through the micro-cell footprint. . . 63
4.1 UEs from different SPs sharing eNB in a single cell. . . 66
4.2 The flowchart of the heuristic allocation algorithm in SS and DS scenarios. . . . 81
4.3 The average BIP and heuristic transmit power in SP1. . . 85
4.4 The average BIP transmit power versus the average channel gain. . . 86
4.5 The average BIP transmit power versus the number of active UEs. . . 87
4.6 The average BIP and heuristic transmit power in SP1 versus the average chan-nel gain. . . 87
4.7 The average BIP and heuristic transmit power in SP1 versus the number of active UEs. . . 88
4.8 The average UL transmission rate per TTI in SPs-1, and 2. . . 89
4.9 The normalized battery life versus the average channel gain. . . 89
4.10 The normalized running time versus the average channel gain. . . 90
4.11 The normalized running time versus the number of active UEs in SP1. . . 91
5.1 Basic network topology of multiple eNBs sharing one MME/S-GW. . . 93
5.2 UE’s path of a mobile going through two handoffs and two changes of direction before cell termination. . . 97
5.3 The pseudo-code for the rate of HO for different mobility speeds. . . 97
5.4 Handover algorithm. . . 99
5.5 LTE handover message sequence. . . 100
5.6 Macro Diversity Handover. . . 103
5.7 Fast Base Station Switching. . . 103
5.8 The range of RSRP reported by UE versus SNR. . . 107
5.9 Hybrid handover scheme. . . 111
5.10 The pseudo-code for HY-HO scheduling algorithm. . . 112
5.11 The rate of handover versus mobility speeds for cell radius of 1 Km. . . 119
5.12 The average packets delay (EF and non-EF traffic) for mobility speed 150 Km/hr versus distance from eNB. . . 120
5.13 The average packets delay (EF and non-EF traffic) for mobility speed 350 Km/hr versus distance from eNB. . . 121
5.14 The average packets delay (EF and non-EF traffic) for mobility speeds 150 and 350 Km/hr versus time. . . 122
5.15 The average packets delay (high dense EF traffic) for mobility speed 150 Km/hr versus distance. . . 122
5.16 The average packets delay (high dense EF traffic) for mobility speed 350 Km/hr versus distance. . . 123
5.17 The average packets delay (high dense EF traffic) for mobility speeds 150 and 350 Km/hr versus time. . . 123
List of Tables
2.1 Mobile speeds and LTE performance with respect to mobility. . . 12
2.2 UL/DL Frame Configuration for LTE TDD. . . 16
3.1 List of MCS which are used in LTE. . . 34
3.2 Defined necessary parameters. . . 37
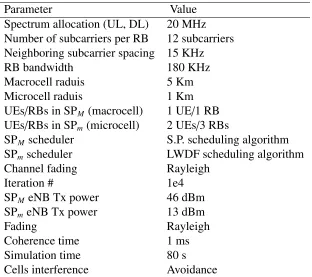
3.3 Simulation default Parameters. . . 47
3.4 Groups’ map. . . 54
3.5 Simulation Default Parameters and Values. . . 62
4.1 QoS Attributes . . . 67
4.2 Frequently Used Notations . . . 70
4.3 Simulation Default Parameters and Values. . . 84
5.1 Frequently Used Notations . . . 105
5.2 Simulation Default Parameters and Values. . . 118
Acronyms
3GPP Third Generation Partnership Project
4G Fourth Generation Wireless Systems
ACK Acknowledge or Acknowledgment
A/D Analog-to-Digital
AF Assured Forwarding
AMC Adaptive Modulation and Coding
Apps Application Server
ARQ Automatic Repeat Request
BE Best Effort
BER Bit Error Rate
BIP Binary Integer Programming
BLER Block Error Rate
BPSK Binary Phase Shift Keying
BS Base Station
BSR Buffer Status Report
BW Bandwidth
C-OFDM Coded Orthogonal Frequency Division Multiplexing
CAPEX Capital Expenditure
CBR Constant Bit Rate
CDMA Code Division Multiple Access
CP Cyclic Prefix
CQI Channel Quality Indicator
CRC Cyclic Redundancy Check
CSI Channel State Information
D2D Device-to-Device
DFT Discrete Fourier Transform
DL Downlink
DRA Dynamic Resource Allocation
DRX Discontinuous Reception
DS Dynamic Sharing
DSL digital Subscriber Line
DTX Discontinuous Transmission
DwPTS Downlink Pilot Time Slot
E-UTRA Evolved UMTS Terrestrial Radio Access
E-UTRAN Evolved UMTS Terrestrial Radio Access Network
EDGE Enhanced Data Rates for GSM Evolution
EF Expedite Forwarding
eNB Evolved Node B
EPC Evolved Packet Core
FDD Frequency Division Duplex
FDM Frequency Division Multiplexing
FDMA Frequency Division Multiple Access
FFT Fast Fourier Transform
GBR Guaranteed Bit Rate
GP Guard Period
GPRS General Packet Radio Service
GSM Global System for Mobile Communication
GW Gateway
HARQ Hybrid ARQ
HetNet Heterogeneous Networks
HHO Hard Handover
HO Handover
HSPA High Speed Packet Access
HSPA+ High Speed Packet Access Evolved
HY-HO Hybrid Handover
ICI Inter-Carrier Interference
IEEE Institute of Electrical and Electronics Engineers
IFFT Inverse Fast Fourier Transform
IMS IP Multimedia Subsystem
IP Internet Protocol
ISI Inter-Symbol Interference
I.S. Internal Scheduler
kbps kilo-bits per second
KHz Kilo Hertz
LBS Level of Bearer Satisfaction
LP Linear Programming
LTE Long Term Evolution
LWDF Largest Weight Delay First
MAC Medium Access Control
MC-OFDMA Multi-Carrier Orthogonal Frequency Division Multiple Access
MCS Modulation and Coding Scheme
MIMO Multiple Input Multiple Output
MME Mobility Management Entity
MMF Maximum-Minimum Fairness
MNO Mobile Network Operator
MR Maximum Rate
NGBR Non-Guaranteed Bit Rate
OFDM Orthogonal Frequency Division Multiplexing
OFDMA Orthogonal Frequency Division Multiple Access
OPEX Operating Expenditure
PAPR Peak-to-Average Power Ratio
PC Power Control
PDB Packet Delay Budget
PDCP Packet Data Convergence Protocol
PDU Protocol Data Unit
PF Proportional Fair
PGW Packet Gateway
PHEVs Plug-in Hybrid Vehicles
PHY Physical Layer
PLER Packet Loss Error Rate
PSK Phase Shift Key
QAM Quadrature Amplitude Modulation
QCI QoS Class Identifiers
QoS Quality of Service
QPSK Quadrature Phase Shift Keying
RAN Radio Access Network
RB Resource Block
RE Resource Element
RF Radio Frequency
RLC Radio Link Control
RN Relay Node
RRC Radio Resource Control
RRM Radio Resource Management
RSRP Reference Symbol Received Power
RSRQ Reference Signal Received Quality
RSSI Received Signal Strength Indicator
S-GW Serving Gateway
S1-U S1 - User Plane
SC Single Carrier
SC-FDMA Single Carrier - Frequency Division Multiple Access
SFN Single Frequency Network
SHO Soft Handover
SIB System Information Block
SLA Service of Level Agreement
SNR Signal-to-Noise Ratio
SPs Services providers
SS Static Sharing
S.P. Strict Priority
TB Transport Block
TDD Time Division Duplex
TTI Transmission Time Interval
UE User Equipment
UL Uplink
UMTS Universal Mobile Telecommunications System
UPE User Plane Entity
UpPTS Uplink Pilot Time Slot
VBR Variable Bit Rate
VoIP Voice over Internet Protocol
VRB Virtual Resource Blocks
WCDMA Wideband Code Division Multiple Access
Wi-Fi Wireless Fidelity
WiMAX Worldwide Interoperability for Microwave Access
Chapter 1
Introduction
Emerging broadband wireless access technologies nowadays face the long-term challenge of properly addressing air-link channel limitations and reconciling these limitations with the growing demand for services with fast mobility and widespread coverage. One of the most demanding and challenging scenarios is the high-mobility scenario [1, 2].
The Third Generation Partnership Program-Long Term Evolution (3GPP-LTE) system adopts the orthogonal frequency division multiplexing (OFDM) and multi-input multi-output (MIMO) techniques [3] in order to satisfy the fast-growing demand of wireless data, wherein services providers (SPs) revenues in LTE systems are not growing at the same rate as the traffic volume. In order to handle the rapid increase in mobile data traffic, more suitable business models with higher capacities should be deployed.
Coded orthogonal frequency division multiplexing (C-OFDM) which is a form of OFDM where error correction coding is incorporated into the signal, has been developed into a popular scheme for wideband digital communication, and is used in applications such as digital televi-sion and audio broadcasting, digital subscriber line (DSL) broadband internet access, wireless networks, and Fourth Generation (4G) mobile communications. The primary advantage of OFDM over single-carrier schemes is its ability to cope with severe channel conditions (for example, narrowband interference and frequency-selective fading due to multipath) without complex equalization filters [4].
2 Chapter1. Introduction
modulated narrow band signals rather than one rapidly modulated wideband signal [5]. The low symbol rate makes the use of a guard interval between symbols affordable, making it possi-ble to eliminate intersymbol interference (ISI) and utilize echoes and time-spreading to achieve a diversity gain, i.e. an improvement in the signal-to-noise ratio (SNR).
Modern wireless communication systems strive to achieve two very contrasting objectives, namely increasing system performance while well as improving energy efficiency for green communications [6]. In fact, both these goals have been heavily focused on since the adoption of early wireless systems; while the definition of system performance has evolved over time.
1.1
Thesis Contributions
In our way to evolve towards the future, my main objective is to enhance the quality of ser-vices’ (QoS) parameters in wireless networks that can stand with the nowadays raising mobile data usage [7, 8]. In this thesis, a variety of optimized techniques that aim to provide innovative solutions for this objective are explored.
The first part outlines the benefits of deploying virtualization in terms of resource sharing concept. Wherein, SPs achieving different schedulers’ algorithms can share a single evolved network B (eNB). This part shows how the delay parameter can be improved.The second part, proposed the power allocation problem in a virtualized scheme in LTE uplink (UL) systems. That aims to prolong the mobile devices’ battery utilization time per charge. While, the third part proposes the hybrid-Handover (HY-HO) technique that can enhance the system perfor-mance in terms of latency and HO reliability for high mobility objects (up to 350 km/hr; wherein, HO will occur more frequent) [9].
1.2. ThesisOrganization 3
able to enhance the system performance in term of latency, interruption time and reliability during HO. The results prove that the proposed solutions can effectively contribute in address-ing the challenges caused by the demand for high data rates and power transmission in mobile networks and also in improving QoS parameters [10].
1.2
Thesis Organization
The thesis is organized into six chapters where the technical contributions of this thesis are contained in Chapters 3 to 5. Prior to introducing the technical contributions, in Chapter 2, I provide detailed background on the problem domain with an introduction to communication systems for high-mobility objects, introduce the main task for this thesis, and summarize some of the recent state-of-the-art advances in the area concentrated on in this thesis.
The technical contributions of this thesis begin in Chapter 3. I propose a novel design for a virtualized resources’ sharing technique with investigation that analyze and test the users performance in terms of delay QoSs parameter, wherein, SPs using different scheduling al-gorithms are sharing their physical radio resources blocks (RBs) in one eNB in a virtualized scheme as a promising solution for reducing operational and capital expenditures, leading to potential energy savings, and supporting higher peak rates. The proposed method makes use to schedule traffic with various delay and priority requirements.
The contributions of this chapter was partially presented in IEEE international conference on wireless communications and mobile computing [11], that evaluates the average packets jit-ter and delays for cases of non-sharing and sharing schemes, with the goal to close the growing gap between the capacities of backbone networks, that yields notable improvements in average packet delay.
pol-4 Chapter1. Introduction
icy framework for an arbitrary number of queues and channels for single-carrier frequency division multiple access (SC-FDMA) UL which meets exclusive and contiguous allocation, maximum transmission power, and rate constraints restrictions while minimizing the average applied transmission power for a time-invariant channel to achieve green communication.
Chapter 4 was partially presented in IEEE international conference on wireless and mo-bile computing, networking and communications [12]. The major contributions are proposing both optimal BIP-based and suboptimal lower complexity heuristic scheduling algorithms to minimize overall average applied power, and compared their performance in terms of average applied power and computational complexity.
In Chapter 5, I analyze the performance of UEs random-way mobility model and HO al-gorithms for high-mobility users within the sharing virtualized scenario in LTE systems. A HY-HO technique is proposed to address the shortcomings of the existing approaches and the challenges caused by the demand for high data rates. The HY-HO was able to enhance the system performance in term of interruption time, reliability and latency during HO at the cell boundary.
The contributions of this chapter appear in IEEE international Canadian conference on electrical and computer engineering [13], wherein, the HY-HO virtualized scheme is capable of achieving great improvements with respect to delay when compared to the non-sharing ap-plication. Overall, the results confirm that the HY-HO framework yields notable improvements in average packet delay, without degrading QoS.
Chapter 2
Background and Literature Review
This chapter provides an introduction to the main technologies that are related to the scope of this thesis. First, multi-carrier systems OFDM and orthogonal frequency division multiple access (OFDMA) are introduced as the basic technique used in the recent radio LTE networks in both UL/downlink (DL) transmissions. Later, LTE is presented, followed by the description of system architecture jointly with main features and characteristic. At the end of the chapter, a summary is approached as an introduction for the coming thesis’s contributions.
LTE is the standard cellular technology for wireless communication of high speed data for mobile phones and data terminals that is emerged as one of the most promising access network technologies, launched by the 3GPP to support diversity of traffic at potentially high rates [14, 15] with greater flexibility for heterogeneous networks and flatter networks. In this chapter, an overview on the state-of-the-art research related to this thesis is provided including background on the 3GPP-LTE systems technology.
2.1
Multicarrier Systems
OFDM, the method of encoding data on multi-carrier subcarriers. OFDM has developed widely for wide band digital communications, with many applicable approaches, for example, audio broadcasting, digital television, and DSL Internet access, power-line networks, wireless
6 Chapter2. Background andLiteratureReview
networks, and 4G communications networks.
It is a frequency-division multiplexing (FDM) approach that is used as a digital multiple carriers method. Wherein, a large number of close spaced orthogonal sub-carrier signals are carrying data on multiple parallel data channels. Each subcarrier is modulated with a con-ventional modulation scheme (such as quadrature amplitude modulation (QAM) or phase-shift keying (PSK)) at a low symbol rate, maintaining total data rates similar to conventional single-carrier (SC) modulation schemes in the same bandwidth.
The main advantage of OFDM over SC techniques is the ability to work with severe chan-nel conditions (like, high frequencies’ attenuation in a long copper wire, frequency-selective fading due to multi-path, and narrow band interference) with simple equalization filters. More-over, the channel equalization is simplified since OFDM may be viewed as using multi-slow narrow band modulated signals instead of one rapid wide-band modulated signal. As a result, the low symbol rate takes the advantage of the guard interval between symbols. That makes it possible to cancel any ISI, utilize echoes and time-spreading to achieve higher diversity gain, i.e. a SNR improvement.
This mechanism facilitates the design of single frequency techniques, where several con-tiguous transmitters send the same signal at the same frequency, where signals from different distant transmitters can be combined constructively, instead of interfering that would typically occur in normal single-carrier system. OFDM and OFDMA are multi-carrier systems, a brief description of both is presented in this section.
2.1.1
OFDM and OFDMA
The main idea of a multi-carrier modulation is to divide the transmitted bit stream into different sub-streams and send these over many different channels. It is based on the principle of transmitting individuallyy many narrow-band orthogonal frequencies, sub-carriers [16]. The number of sub-carriers is noted asNs. These frequencies are orthogonal to each other, which
2.1. MulticarrierSystems 7
QAM
Modulator IFFT
Serial to Parallel converter
D/A Cyclic
prefix X
Parallel to Serial R bps
X0
XN-1
X0
XN-1
cos(2πfct)
Tx
Figure 2.1: OFDM with IFFT implementation (Tx).
SC, it provides to OFDM a much better multi-path resistance, which together with orthogonal carriers allows a high spectral efficiency.
The basic premise of a multi-carrier modulation is to split this wide-band system into Ns
linearly-modulated subsystem in parallel, each with Subchannel Bandwidth is:
BN = B/Ns (2.1)
where: Bis the pass-band bandwidth.
The bandwidth sub-channel is lower than the coherence band (BC) for Nssufficiently large
and ensures relatively flat fading on each sub-channel. Also, with Ns sufficiently large, the
symbol time is much longer than the delay spread, so each sub-channel experiences low ISI degradation.
The input data stream is linearly-modulated, resulting in a complex symbol stream. This sym-bol stream is divided into N sub-streams via a serial-to-parallel converter, as shown in Figure 2.1.
OFDM theory shows that the inverse Fourier fast transform (IFFT) of magnitudeNs,
ap-plied on Ns symbols, realizes one OFDM signal, where each symbol is transmitted on one of
the Ns orthogonal frequencies. The IFFT operator realizes the reverse operation of the fast
Fourier transform (FFT). The FFT is a matrix computation that allows the discrete Fourier transform (DFT) to be computed. WhenNsis power of 2 the complexity of the FFT is reduced.
8 Chapter2. Background andLiteratureReview
a special prefix is added to the input called a cyclic prefix (CP), so the linear convolution be-tween the input and impulse response can be turned into a circular convolution.
The CP can also serve to eliminate ISI between the data blocks, since CP samples are also the first samples (as guard interval) of the channel output which are affected by ISI. These samples can be discarded without any loss relative to the original sequence, since there is no new information.
At the receiver section, the ISI associated with the end of a the OFDM symbol is added again to the symbol, which re-creates the effect of a cyclic prefix. The zero cyclic prefix de-creases the power transmitted relative to cyclic prefix by Ns/(Ns+ µ), as the prefix does not
need any transmit power. However, the received noise is added to the beginning of the symbol, which increases the noise power by (Ns+µ)/Ns.
CP allows the receiver to absorb much more efficiently the delay spread due to the multi-path and to maintain frequency orthogonality. This CP is a temporal redundancy that must be taken into account in data rates computations. The ratioµ/Ns is chosen taking some
consid-erations into account. If the multipath effect is important, a high value of this ratio is needed, which increases the redundancy and then decreases the useful data rate. On the other hand if the multipath effect is lighter, a relatively smaller value of this ratio can be used.
OFDM transmission was originally conceived for a single user; therefore, it had to be as-sociated to a multiple user access scheme so that several users could be served. OFDMA is the scheme to be used. OFDMA allows the access of multiple users on the available bandwidth. Each user is assigned a specific time-frequency resource.
OFDMA subcarriers are divided into subsets of subcarriers, each subset representing a sub-channel, as shown in Figure 2.2).
In the DL, a sub-channel may be intended for different receivers or groups of receivers; in the UL a transmitter may be assigned one or more sub-channels. The subcarriers forming one sub-channel may be adjacent or not.
2.1. MulticarrierSystems 9
Nused
Left guard subcarriers
Right guard subcarriers
Data subcarriers
subchannel 1 subchannel 2
subchannel 3 subchannel 4
Figure 2.2: Illustration of the OFDMA principle.
time and a sub-channel allocation for each of its communications.
2.1.2
Key Challenges
The peak to average power ratio (PAPR) is a very important feature in any communication system. The low PAPR makes it possible for the transmit power amplifier to operate more efficiently, whereas the high PAPR makes the transmit power amplifier to have a high back-off for ensuring linear amplification for the signal.
The operation in the linear region of this response is totally required to eliminate the distor-tion of the signal, so this peak value is considered to be in that region. Having these peak and average values close together as possible, is preferable, to have the power amplifier operating with its the maximum efficiency.
ForNsubcarriers, the maximum PAPR isN. In practice, the full coherent addition of allN
symbols is improbable, so the observed PAPR is less thanN, usually many dB. Moreover, the PAPR increases linearly with the number of subcarriers. Although it is required to have N as large as it can be to keep the over-head associated with the cyclic prefix down, the large PAPR is the expected penalty that must be paid for a largeN.
10 Chapter2. Background andLiteratureReview
2 G 2.5 G 3 G 4 G
GSM
GPRS
EDGE
UMTS
HSPA
HSPA+
LTE
LTE-Advanced
1990 2000 2010
3GPP Family Technology Evolution
Km/hr
250 100 120 350
Figure 2.3: The evolutionary path of the LTE radio platform technology.
conversion places a complexity and power burden on the receiver front end.
2.2
Background of LTE Systems
LTE is part of the Global System for Mobile Communications (GSM) evolutionary path for mobile broadband, following General Packet Radio Service (GPRS), Enhanced Data rates for GSM Evolution (EDGE), Universal Mobile Telecommunications System (UMTS), HSPA, and its evolution (HSPA+) [17, 18] as shown in Figure 2.3. Although HSPA and HSPA+ are strongly positioned to be the dominant mobile data technology for the next decade, the 3GPP family of standards must evolve toward the future.
The need for LTE is to provide an extremely highly performance radio access technology that offers full vehicular speed mobility [11, 19], and that can readily coexist with HSPA and earlier networks. And, because of the scalable bandwidth, operators will be able to easily migrate their networks and users from HSPA to LTE over time.
2.2.1
LTE Objectives
The main overall objectives [20] for LTE are: 1. Reduced cost for the operator,
2.2. Background ofLTE Systems 11
3. Minimizing energy consumed per user, 4. Improved spectral efficiency,
5. Improved system capacity, and coverage,
6. Increased DL and UL peak data rates with reduced latency, 7. Scalable bandwidth with flexible spectrum allocation, 8. All IP network,
9. Support different traffic types,
10. and, satisfying the service of level agreement (SLA) between users per SP, customers, and between SPs sharing the same eNB.
2.2.2
eNBs Main Functions
The following are the functions assigned to eNBs [5, 21] for radio resource management in the E-UTRAN:
1. Radio bearer control, 2. Radio admission control,
3. Connection mobility management,
4. Dynamic resource allocation (scheduling), 5. Inter cell interference coordination,
6. and, load balancing.
2.2.3
LTE Performance of Demands
The LTE performance demands [19] could be simplified as:
1. Date rate: For 20 MHz spectrum, the target for peak data rate is 50 Mbps for UL, and 100 Mbps for DL,
2. Bandwidth: flexible usage of spectrum from 1.4 MHz to 20 MHz,
3. Peak spectral efficiency: for DL is of average 3.2 bps/Hz, and for UL is 1.05 bps/Hz, 4. Spectral efficiency of cell edge: is 0.04-0.06 bps/Hz/user for DL and 0.02-0.03
bp-s/Hz/user for UL,
12 Chapter2. Background andLiteratureReview
6. Data type: All packet switched data (voice, video, and data), 7. Packet call throughput: DL avg. 256 Kbps, and for UL is 15 Kbps, 8. Average user throughput: DL is 3.6 Mbps, and for UL is 0.45 Mbps,
9. Latency: is less than 50 ms (for dormant to active). The user-plane latency is less than 5 ms from user equipment (UE) to server,
10. Call setup time: 50 ms,
11. Broadcast data rate: 3.072 Kbps,
12. Modulation types supported: BPSK, QPSK, 16QAM, 64QAM,
13. Access schemes: SC-FDMA has been chosen as the UL access scheme for its low peak-to-average power ratio (PAPR) properties compared to multi-carrier orthogonal fre-quency division multiple access (MC-OFDM) in DL,
14. Security: is used at good level with the earlier systems starting from GSM.
2.2.4
LTE Performance with Respect to Mobility
Table 2.1 summarizes the LTE performance versus various mobility speeds, and shows that the LTE is able support high mobility up to 350 km/h [9, 22], and is at good level compared to the earlier wireless systems shown in Figure 2.3.
Table 2.1: Mobile speeds and LTE performance with respect to mobility. Mobile speed Mobility LTE performance
Stationary 0 Km/hr Low mobility Optimized high performance Walking 3 : 5 Km/hr Low mobility Optimized high performance Race walkers 14 Km/hr Low mobility Optimized high performance Vehicular 15 : 120 Km/hr Medium mobility Marginal degradation
High speed 120 : 350 Km/hr High mobility Maintain connection with QoS Extremely high up to 900 Km/hr Extremely high Not supported
2.2.5
LTE Tra
ffi
c Quality of Services
The QoSs’ requirements and recommendations differ according to the type of traffic [23, 24], such that the QoS for voice traffic include:
1. Loss≤1 percent. (packet error loss≤10−2),
2.2. Background ofLTE Systems 13
3. Packet delay≤20 ms,
and, unlike voice, video uses a variety of packet sizes and packet rates to support a single video stream, and the QoS recommendations for video traffic include:
1. Packet delay≤150 ms, 2. Packet error loss :≤10−3,
3. The average bit rate varies between of 64 kbps to 1.2 Mbit/s,
while, the QoS recommendations for data traffic include: 1. Packet delay≤300 ms,
2. Packet error loss :≤10−3 .
The LTE system architecture is shown in Figure 2.4, where the evolved-[UMTS] terrestrial radio access network (E-UTRAN) [25], uses a simplified single node architecture consisting of the eNB [26] to communicate with users’ equipments (UEs), while the eNB communicates with other eNB using X2-C and X2-U interfaces for control and user plane respectively, for example in mobile end UE HO situations. The eNB communicates with the evolved packet core (EPC) using the S1 interface; specifically with the mobile management entity (MME) and the user plane entity (UPE) identified as serving gateway (S-GW), using S1-C and S1-U interfaces for control plane and user plane respectively, that supports a many-to-many relation between MMEs/UPEs and eNBs, and by its turn is connected by the internet protocol (IP) Multimedia Subsystem (IMS), and the application server (Apps). The MME and the UPE are preferably implemented as separate network nodes so as to facilitate independent scaling of the control and user plane.
2.2.6
LTE Spectrum Flexibility
14 Chapter2. Background andLiteratureReview
Evolved
Packet Core
EUTRAN
n n
Figure 2.4: The LTE system architecture.
is able to support both frequency- and time-division-based duplex transmissions. Frequency division duplex (FDD) [27] as illustrated to the left in Figure 2.5 implies that DL and UL trans-mission take place in different, sufficiently separated, frequency bands. Time division duplex (TDD), as illustrated to the right in Figure 2.5, shows that DL and UL transmission can take place in non-overlapping, different time slots. Then, TDD can work in unpaired spectrum, whereas, FDD requires paired spectrum.
LTE also can support duplex FDD (illustrated in the middle of Figure 2.5). In half-duplex FDD, the transmission and reception at a certain terminal are separated in both fre-quency and time. The base station can still uses full duplex as it may schedule different trans-missions in UL and DL; that is the same case in the GSM operation.
2.2. Background ofLTE Systems 15
time eNB
time time
fr
eq
u
en
cy
FDD half-duplex FDD TDD
fr
eq
u
en
cy
fr
eq
u
en
cy
UL
DL
UE
fUL fUL
fDL fDL
fUL
+ fDL
Figure 2.5: Frequency and time division duplex.
2.2.7
LTE Frame Structure
The LTE frame structure is set for two types: type-1 LTE FDD, and type-2 LTE TDD mode systems. Type-1 frame structure that works on both half duplex and full duplex FDD modes [27]. That type of radio frame usually has duration of 10 ms and consists of 20 slots, each slot has the equal duration (0.5 ms). The sub-frame consists of two slots, one radio frame has 10 sub-frames. In the FDD mode, DL and UL transmission is divided in frequency domain, so half of all sub-frames can be used for DL and half for UL, in radio frame interval of 10 ms. Type-2 frame structure consists of two identical half frames of 5 ms duration each. Both half frames have 5 sub-frames with duration of 1 ms.
TDD mode uses frame structure type 2. In this structure, the slots, sub-frames and frames have the same duration, but each subframe can be allocated to either the UL or DL [20, 23, 24], using one of the TDD configurations as shown in Figure 2.6.
16 Chapter2. Background andLiteratureReview
UL
UL DL
DL
FDD
TDD
subframe # 0 1 2 3 4 5 6 7 8 9 1 frame, Tframe= 10 ms
1 subframe, Tsubframe= 1 ms
special subframe
fUL
fDL
fUL + fDL
DwPTS GP
UpPTS
Figure 2.6: UL/DL time/frequency structure in case of FDD and TDD.
There are seven UL/DL configurations used for either 5 ms or 10 ms switch-point peri-odicities. Note that, a special sub-frame exists in half frames in case of 5 ms switch-point time-period whereas, for 10 ms switch-point time-period the special frame exists only in the first half-frame. Table 2.2 shows the UL/DL frame configuration for LTE TDD, and simplified in Figure 2.7.
Table 2.2: UL/DL Frame Configuration for LTE TDD.
Configuration DL to UL SF0 SF1 SF2 SF3 SF4 SF5 SF6 SF7 SF8 SF9
0 5 ms DL SF UL UL UL DL SF UL UL UL 1 5 ms DL SF UL UL DL DL SF UL UL DL 2 5 ms DL SF UL DL DL DL SF UL DL DL 3 10 ms DL SF UL UL UL DL DL DL DL DL 4 10 ms DL SF UL UL DL DL DL DL DL DL 5 10 ms DL SF UL DL DL DL DL DL DL DL 6 5 ms DL SF UL UL UL DL SF UL UL DL
Where, SF is a subframe and it is used for guard time, DL is a subframe and it is used for DL transmission, and UL is a sub-frame and it is used for UL transmission.
2.2. Background ofLTE Systems 17
#2 #3 #4 #7 #8 #9
#0 #5
#2 #3 #4 #7 #8
#0 #5 #9
UL
UL DL
DL
1 frame, Tframe= 10 ms
5 ms
DwPTS GP
UpPTS
Configuration 0 DL:UL 2:3
#2 #3 #7 #8
#0 #4 #5 #9
DL Configuration 1
DL:UL 3:2
#2 #7
#0 #3 #4 #5 #8 #9
UL DL Configuration 2
DL:UL 4:1
#2 #3 #4
#0 #5 #6 #7 #8 #9
DL Configuration 3
DL:UL 7:3
#2 #3
#0 #4 #5 #6 #7 #8 #9
DL Configuration 4
DL:UL 8:2
#2
#0 #3 #4 #5 #6 #7 #8 #9
UL DL Configuration 5
DL:UL 9:1
Configuration 6 DL:UL 5:5
18 Chapter2. Background andLiteratureReview
the interference between the UL and DL.
Special subframes are used at the transitions from DL to UL transmission. They contain three regions. The special DL region takes up most of the subframe and is used in the same way as any other DL region. The special uplink region is shorter, and is only used by the random access channel and the sounding reference signal. The two regions are separated by a guard period that supports the timing advance procedure described below. The cell can adjust the size of each region using a special subframe configuration, which again is advertised in the system information.
Figure 2.8 shows the relationship between a slot, symbols, and physical radio RBs. The sub-carriers are divided into RBs, which is the basic resource allocation unit for scheduling in 3GPP-LTE system. NRB is the symbol used to indicate the maximum number of RBs for
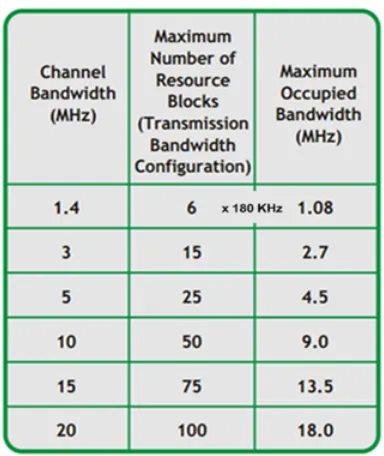
a given bandwidth. This allows the system to split the sub-carriers into small parts, without mixing the data across the total number of sub-carriers for a given bandwidth. The basic unit is a resource element (RE), which spans one symbol by one sub-carrier. Each resource element usually carries two, four or six physical channel bits, depending on whether the modulation scheme is QPSK, 16-QAM or 64-QAM. Resource elements are grouped into RBs, each of which spans 0.5ms (one slot), by 180 kHz (12 sub-carriers). The base station uses RBs for frequency-dependent scheduling, by allocating the symbols and carriers within each sub-frame in units of RBs.
The LTE signal can be represented in a two dimensional map. The horizontal axis is time domain and the vertical axis is frequency domain. The minimum unit on vertical axis is a sub-carrier and on horizontal axis is symbol [20].
rela-2.2. Background ofLTE Systems 19
15 KHz
NSCRB
Resource Element
Symbols
OFDM Symbol (time)
S u b ca rr ie r (f re q u en cy )
180 KHz = 15 KHz x 12
Subcarriers S u b c ar ri e rs 1 Slot Resource Block
N
RBRadio Frame = 10 ms Subframe = TTI
0 1 2 Slot = 0.5 ms
Resource Block Resource Block Resource Block 1 Slot 7 Symbols (Normal CP) N RB x NRB SC 6 ≤ N ≤ 1 0 0 R B
Figure 2.8: The relationship between a slot, symbols, and RBs.
tionships between channel bandwidth, and transmission bandwidth configuration is illustrated. Also, another important part of the LTE benefits is in terms of spectrum flexibility (1.4 MHz to 20 MHz) [28] as shown in Figure 2.10.
2.2.8
UL
/
DL Information Exchange
In UL transmission of LTE, there are still some additional carrying signals needed such as; reference signal, random access preamble and control signal, etc. These signals are specified as a sequence signalling and have constant amplitude with zero auto-correlation.
20 Chapter2. Background andLiteratureReview
Figure 2.9: The relationships between channel bandwidth, and transmission bandwidth config-uration.
2.2. Background ofLTE Systems 21
Scheduling
For each UE: - BSR
- QoS of each bearer - HARQ Ack.
- DRX patterns
For each UE:
- Transport Block size - New data indicator - Modulation scheme - Coding rate
- RB assignment
Figure 2.11: Inputs and outputs for the UL and DL scheduling algorithm.
To support the scheduling function, the mobile returns hybrid automatic repeat request (H-ARQ) acknowledgments (Acks) [29], channel quality indicators and rank indications [30]. The eNB also knows the discontinuous reception (DRX) pattern for every UE in the cell and can receive load information from nearby cells about their own use of the sub-carriers. Figure 2.11 shows the most common of the main inputs and outputs commands and data exchange.
With the use of this information, the scheduler has to determine how much information in bits are required to send to each user, even to send a new transmission or a re-transmission and how to classify new transmissions through the available bearers. It also needs to determine the used modulation schemes and coding rates, spatial multiplexing, and the allocation of RBs to every mobile UE.
The UL scheduler usually follows the same concept, although some of the inputs and out-puts are different. For example, the eNB does not have the full knowledge about the UL buffer occupancy and does not tell the UEs which channels they shall use for their transmissions. Moreover, the eNB calculate its channel quality data from the sounding procedure, instead of the UEs’ channel quality indicators (CQIs).
22 Chapter2. Background andLiteratureReview
The given example in Figure 2.12 introduces one SP, serving two users, the first user (UE-1) is considered to be the near user (1.2 Km far from the eNB), has high SNR (S NRh), while UE-2
is the far user (1.8 Km far from the eNB), has low SNR (S NRl). The figure shows an overview
of the information exchange procedure in both UL and DL connection between an eNB, and UE-1, and 2, considering an already ongoing transfer data, noting that TDD is considered, using type Frame 2, with Configuration 2, where DL:UL =3:2, functioning with packet data convergence protocol (PDCP), where the eNB scheduler takes its scheduling mapping deci-sion every half frame, and one frame time period, where The UE transmits buffer status report (BSR) medium access control (MAC) control elements to tell the base station about how much data it has available for transmission.
Where, the UE sends the BSR in three situations:
1. if data is ready for transmission on the channel with high priority than the previously storing buffers were,
2. or if data is ready for transmission when the transmit buffers were empty, 3. or if the timer expires while data is waiting for transmission.
The mobile expects the base station to reply with a scheduling grant. Considering the CQI [30], which is the indicator that carries the information on how good or bad the communication channel quality is, as it is the information that UEs send to the network and practically it implies the following two indications :
1. Current communication channel quality, 2. Data transport block size,
2.2. Background ofLTE Systems 23
SF SF
SF
SF SF
SF
SF SF
SF
SF SF
SF
24 Chapter2. Background andLiteratureReview
2.3
Chapter Summary
In this chapter, an overview on the recent radio platform LTE technology that depends on the OFDM communication method is presented. LTE system use SC-FDMA for UL trans-mission and OFDMA for DL transtrans-mission. This system is capable of reaching a peak data-exchange rate of 50 Mbps for UL transmission and 100 Mbps for DL transmission; the main motivation for our research is to model our research problems in order to make an effective contribution.
Chapter 3
Sharing Resources in 3GPP-LTE Systems
Framework
Nowadays, much research and standardization efforts are evolving in order to withstand more capable facilities at high effective points. The purpose of this work is to address some of these issues by demonstrating several novel dynamic allocation sharing algorithms in LTE systems. This algorithm will help in increasing the performance over a broader range of sub-scriber access scenarios.
Specifically, this Chapter proposes a novel dynamic scheduling sharing algorithm that can support guaranteed QoS for multiple types of applications in the wireless networks. The pro-posed algorithm reduces the packet delay and jitter for delay-sensitive applications, such as narrow-band voice. This considerably enhance the related delay performance without degrad-ing QoS parameters for all service types.
3.1
Introduction
Recently, network sharing has been proposed as an integral part of the next-generation networking architecture for vehicular communications, and is considered to be a promising solution to provide low-cost framework, and accommodate increased traffic demands [31, 32].
26 Chapter3. SharingResources in3GPP-LTE SystemsFramework
Sharing radio resources management in LTE systems leads to successful virtualization of the wireless access networks that have received much attention by network operators. Virtu-alizing the wireless resources enables MNOs to create multiple logical networks based on a single physical substrate.
Recently, there has been a dramatic increase in the amount of network data traffic, primar-ily driven by the rising number of users demanding increased data rates. Moreover, a wide range of increasingly bandwidth-intensive services are continuing to emerge (e.g., storage ex-tension/virtualization, grid computing, packet video teleconferencing, and so on) [11].
A mobile network operator (MNO), commonly known as a service provider, wireless car-rier, cellular company, or mobile network carrier [33], is a provider of the wireless services communications that controls all the necessary elements to rent/sell and deliver services to the end UE including the spectrum allocation, network and back haul infrastructure, customer care, provisioning systems, billing, and marketing and repair organizations.
This chapter proposes a novel dynamic scheduling sharing resources algorithm for diff er-ent types of applications in access networks. The framework scheme shares MNOs’ resources while maintaining different scheduling strategies. The proposed algorithm considerably im-proves related delay performance without degrading QoS. The research below offers detailed simulations to study the performance of the proposed algorithm and validate its effectiveness.
3.2
Related Work
During the latest basic literature, MNOs sharing RBs have gained significant attention. Jing
et al. in [27] presented the resource sharing on the relay link according to the buffer state at
the relay nodes (RNs) for urban scenarios without applying a power control (PC) optimization, and their results including the suburban scenarios are also provided in [34].
vir-3.2. RelatedWork 27
tualizing the eNB into a number of virtual eNBs that are then used by different MNOs. As an extension to [36], the discussed some practical scenarios in [37]; where MNOs share multiple eNBs. The managed in the sharing process is controlled by the so-called hypervisor. Moreover, two traffic models (best efffort model and the guaranteed bit rate model) have been considered for resource sharing.
Kokkuet al. in [38] proposed and evaluated a flow-level virtualization scheme of wireless resources on base stations in worldwide interoperability for microwave access (WiMAX) cel-lular systems. The proposed solution enables customized flow scheduling per slice and takes into account the level of isolation and resource utilization trade-off. Each slice can be seen as a virtual MNO and contains a number of flows. The goal of achieving dynamic and efficient resource sharing is moved to the scheduler by Min et al. in [39]; which can instantaneously adapt to changes in system conditions, rather than relying on semi-static radio interface sub-frame allocation.
In addition, in [40], O. Bulakciet al.presented the relay-enhanced networks, where a com-bination of resource allocation on the relay link based on the number of attached UEs; and a throughput throttling scheme achieving max-min Fairness (MMF) in the end-to-end two-hop communication have been proposed.
Some advanced resource sharing mechanisms are discussed such as the schemes based on interference graph by Necker et al. in [41], or game theory by Menon et al. in [42]. Game theory based resource sharing models the resource allocation as the outcome of a game. In [43, 44], Bulakci and Kokku investigated the cooperative methods relying on information ex-change between the cells that yield significant performance improvement comparing to non cooperative solutions, but at the cost of high signaling overhead.
Roth et al. in [45], investigated the time-division and frequency-division multiplexing of
28 Chapter3. SharingResources in3GPP-LTE SystemsFramework
spectrum management is maintained by the network operator.
3.3
System Modeling Framework
In the LTE architecture, the eNB is the node between the UE and the core network. It is responsible for the radio resource management (RRM) functions (transmission power manage-ment, mobility management and radio resource scheduling) [47, 48, 49]. As the bandwidth of wireless communication system is scarce and very expensive, the RRM is workable with OFDMA. Then the radio resource scheduling is a significant process in which the available radio resources are assigned to all active UEs efficiently in terms of QoS requirements.
The LTE sharing framework is shown in Figure 3.1. Let k denotes the number of MNOs sharing the eNB. Each MNO has various numbers of UEs, as well as its own associated EPC, RBs and scheduling algorithm. The eNB establishes multiple radio bearers per UE to support multiple traffic types.
In the considered frame work scenario, the eNBs scheduler algorithm explore the contents of every UL scheduling requested grant [50] and, reply to UEs with the decided scheduling mapping commands specifying the assigned RBs, power control entity, modulation and coding scheme (MCS) on the basis of all the information available to it at the time, FDD is considered, functioning with PDCP, where the eNB Scheduler takes its scheduling mapping decision every one sub-frame time period (1 ms), where The UE transmits BSR MAC control elements to inform the base station (eNB) about how much data available for transmission. Considering the CQI, and the BSR include the QoS of each Bearer, sounding measurements, modulation schemes, and theT Bsize.
3.3.1
Data Transmission Sequence
3.3. SystemModelingFramework 29
Figure 3.1: MNOs sharing radio RBs in a single eNB.
control (RLC) sub-layer buffers. Information about buffered data sizes is sent to the eNB over the UL control channel known as the BSR. The eNB’s scheduler performs allocation decisions according to the SPs’ scheduling policy. And based on the mapped decisions, the eNB sends the maps to the UEs over the the DL control channel. The UEs’ allocation map consists of the assigned RBs, power control entity and MCSs [30, 51].
30 Chapter3. SharingResources in3GPP-LTE SystemsFramework
Figure 3.2: The UEs’ data transmission sequence.
3.3.2
LTE Tra
ffi
c Classes
The LTE sharing framework is shown in Figure 3.1. Let k denotes the number of MNOs sharing the eNB. Each MNO has various numbers of UEs, as well as its own associated EPC, RBs and scheduling algorithm. The eNB establishes multiple radio bearers per UE to support multiple traffic types [52].
In order to support different classes of service with different packet jitter and delay require-ments, three prioritized service classes are introduced: expedite forwarding (EF) [53] with the highest priority for strictly delay sensitive services typically constant bit rate (CBR) voice transmission, assured forwarding (AF) with medium priority for services of non-delay sensi-tive variable bit rate (VBR) services such as video stream, and best effort (BE) with the lowest priority for delay tolerable services, which include web browsing and background file transfer [11].
A key motivation was the inherently non-deterministic nature for AF and BE. Packets in dedicated bearers are generated at the application layer by 3 different traffic generators: Voice traffic, trace based, and infinite buffer.
3.3. SystemModelingFramework 31
3.3. SystemModelingFramework 33
3.3.3
Transmission Block Size and MCSs
In LTE, the subframe has a duration of 1 ms. The available spectrum is divided into RBs. The RB is defined in both frequency and time domains. It consists of a contiguous set of 12 subcarriers (180 kHz with subcarrier spacing of 15 KHz) from each OFDM symbol and has a duration of 0.5 ms.
The overall TB size is a function of the spectral efficiency (ζs) of the selected MCS sand
the number of allocated RBs. The total RB bandwidth is 12×BW, whereBW is the subcarrier bandwidth. The total TB size, that can be transmitted per subframe over R RBs for UEmnis
given by:
Tmn,R,s(t)=b12(Nsys−NOH)×ζc(t)× kRkc (3.1)
where Nsym is the number of symbols per subcarrier in a given subframe, while NOH is the
number of overhead symbols per subcarrier (usually 3 symbols). The value NOH ≥ 0 allows
any additional overhead per TB. When normal cyclic prefix is used (Nsym=14 symbols); each
subframe consists of 11 symbols per subcarrier, each with a duration ofTs= 66.7µs.
The total number of symbols in one RB per subframe is 12×11 = 132 OFDM symbols. Therefore, the TB size can be calculated as:
Tmn,R,s(t)=b132 × ζc(t) × kRkc, (3.2)
where, ζc is the spectral efficiency of the MCS c. The received SNR determines the MCS
[57, 58, 59] that should be used to deliver TB with a 10% block error rate. The MCS selection scheme is enacted using a lookup table that maps the received SNR to MCS [30, 60]. Table 3.1 shows MCSs that are used in LTE and how they are mapped to the received SNR for BLER 10 %. Figure 3.4 shows the spectral efficiency and TB size versus SNR investigated from Table 3.1.
34 Chapter3. SharingResources in3GPP-LTE SystemsFramework
Table 3.1: List of MCS which are used in LTE. Index Modulation Coding rate ζc SNR (dB)
0 - - 0 bits −6.7536 1 QPSK 78/1024 0.15237 -6.7536 : -4.9620 2 QPSK 120/1024 0.2344 -4.9620 : -2.9601 3 QPSK 193/1024 0.3770 -2.9601 : -1.0135 4 QPSK 308/1024 0.6016 -1.0135 : +0.9638 5 QPSK 449/1024 0.8770 +0.9638 :+2.8801 6 QPSK 602/1024 1.1758 +2.8801 :+4.9182 7 16QAM 378/1024 1.4766 +4.9182 :+6.7005 8 16QAM 490/1024 1.9141 +6.7005 :+8.7198 9 16QAM 616/1024 2.4063 +8.7198 :+10.515 10 64QAM 466/1024 2.7305 +10.515 :+12.450 11 64QAM 567/1024 3.3223 +12.450 :+14.348 12 64QAM 666/1024 3.9023 +14.348 :+16.074 13 64QAM 772/1024 4.5234 +16.074 :+17.877 14 64QAM 873/1024 5.1152 +17.877 :+19.968 15 64QAM 948/1024 5.5547 +19.968
assumed to be frequency non-selective, constant over each RB bandwidth, but changes inde-pendently over RBs and users.
3.3.4
LTE Frame work Scenario
The flowchart of the LTE frame work is illustrated in Figure 3.5, assumingMMNOs, each withNusers, and UE is expected to send various types of traffic classes, the internal scheduler per user sends its BSR (in its long format that stands on more than one bearer, and up to four bearers), and the CQI. The BSR is assumed to include how much data is available for transmission, QoS, sounding references measurements, modulation schemes, etc.
3.4. TheConsideredSchedulingAlgorithms 35
−10 −5 0 5 10 15 20
100
Spectral efficiency and transport block size versus SNR
Spectral Efficiency (bit/s/Hz)
(dB)
−10 −5 0 5 10 15 200
100 200 300 400 500 600 700 800
Transport Block size (bits)
SNR Spectral Efficiency
Transport Block Size
MCS #7
MCS #13
132 x ζs
Figure 3.4: Spectral efficiency and transport block size versus SNR.
3.4
The Considered Scheduling Algorithms
Packet scheduling revenues in radio platform technology standard LTE systems are the charge of allocating resources to active flows in both frequency and time domain. Many sched-ulers have been discussed in [7, 11, 51, 61, 62, 63], comparing their data throughput, delay, fairness, etc; trying to reach the most effective performance among the schedulers resources allocation algorithms, as resource allocation for each UE is usually based on the comparison of per-RB metrics: the k-th RB allocated to the jth user. Its metric mj,k is varified, i.e., if it
satisfies the equation:
mj,k =maxi{mi,k} (3.3)
36 Chapter3. SharingResources in3GPP-LTE SystemsFramework
Start
End
UEj
eNB
1 ≤ j ≤ N
Traffic Classes i/p
voice
data video
Internal Scheduler
eNB Scheduler Resources Allocation
+ BSR + CQI
RBs Mapping decisions Mapping
RBs
Information on assigned RBs
MNOi 1 ≤ i ≤ K
3.4. TheConsideredSchedulingAlgorithms 37
Table 3.2: Defined necessary parameters. Parameter Definition
avRB s Number of available RBs at definiteTTI
DHOL,i j Head of line delay for traffic classiforU Ej
N Total number of RBs
Ncl Number of Traffic Classes
ni RBj Number of RBs allocated toU Ejfor Traffic Classi ni j Number of needed RBs to satisfy trafficiforU Ej
nRB j Number of RBs allocated toU Ej
RBBW Size of available RB that could be allocated toU Ej
RBSi RBs BW allocated toU Ej
Si Needed BW to satisfy traffici(in bits) by all UEs
Ti Delay threshold for traffic classi
T T I Transmission Time Interval
U Total number of UEs
Vi j BSR size of queue i for UE j, wherei=1 for EF
i=2 for AF
i=3 for BE
Wi j Weight factor of delay for traffic class i forU Ej δi Acceptable packet loss rate for traffic classi
[.]∗ The new value of [.]
followed by internal scheduler (I.S.) per UE, that distribute RBs among the traffic classes‘ queues. In order to formularize the considered schedulers policies, it is helpful to consider some necessary parameter definitions as shown in Table 3.2.
3.4.1
The Strict Priority Scheduling Algorithm
The S.P. scheduling algorithm allocate RBs according to the priority of the considered traffic class, while maintaining fairness between UEs. The pseudo-code for the S.P. scheduler is shown in Figure 3.6.
3.4.2
The LWDF Scheduling Algorithm
38 Chapter3. SharingResources in3GPP-LTE SystemsFramework
3.4. TheConsideredSchedulingAlgorithms 39
and its deadline. LWDF policy is defined mostly for real-time operating system and wired networks [64], that aim at avoiding deadline expiration. Intuitively, the more the head of line delay approaches the expiration time, the more the user metric increases. LWDF metric is based on the system parameterδi, representing the acceptable probability for the jthuser that a
packet is dropped due to deadline expiration, that could be expressed by:
Wi j =αi j×DHOL,i j (3.4)
αi = −log(δi)/Ti (3.5)
where:Wi jis the weight factor of delay for traffic class i forU E j,
Tiis the Delay threshold for traffic classi,
δi is the acceptable packet loss rate for traffic classi,
DHOL,i j is the head of line delay for traffic class i forU Ej.
In fact, αi weights the metric so that the user with strongest requirements in terms of
ac-ceptable loss rate and deadline expiration will be preferred for allocation. The pseudo-code for the LWDF scheduler is shown in Figure 3.7. noting that:
NRB ≥
NU Es
X
j=1
nRBj (RBs) (3.6)
Si =
NU Es
X
j=1
Vi j (bits) (3.7)
RBSj =
NU Es
X
j=1
nRBj ×RBBW (bits) (3.8)
40 Chapter3. SharingResources in3GPP-LTE SystemsFramework
3.5. SharingRadioResourcesStrategy 41
Figure 3.8: The block diagram of the internal scheduler working procedure.
assumed to be handled by UE as guaranteed bit rate (GBR) bearers should be satisfied before non-GBR (NGBR) bearers, and within the same radio bearer category, the allocated resources are distributed proportionally according to the UE’s I.S. policy.
3.4.3
The UE’s Internal Scheduler
The UE’s I.S. targeting to perform scheduling between its traffic classes, where the sched-uler distributes the received grant among the different active RBs according to the priority of their highest flow based on latest buffer status information (which may have changed since the buffer status was reported) taking into account the cell load, priority of other UEs data, etc. The block diagram of the I.S. working procedure is shown in Figure 3.8. The pseudo-code for the UE’s I.S. is shown in Figure 3.9.
3.5
Sharing Radio Resources Strategy
Nowadays, the networks’ resources sharing has been considered to be as an important part of the next-generation networking architectural. The total RBs R set is assumed to be fully pooled and accessible to the MNOs [11, 32]. RBs are assigned in accordance to the following agreement: