Available online:
https://edupediapublications.org/journals/index.php/IJR/
P a g e | 4656D
ensity
B
ased
T
raffic
S
ignal System
U
sing
M
atlab
SA NDIP S. DESHM UKH (M.E. Scholar)1
SUDHIR S. KA NA DE (Professor & HOD)2
Electronics and Telecommunication Engineering Department1,2 1,2TPCT’s College of Engineering, District-Osmanabad,
(
M.S.
),
India.1[email protected] 2[email protected]
A
bstract
Due to aware of the fact that, the population of city and number of vehicles on the road are increasing day by day. With increasing urban population and hence the number of vehicles, need of controlling streets, highways and roads is major issue. The main reason behind today’s traffic problem is the techniques that are used for traffic management. Today’s traffic management system has no emphasis on live traffic scenario, which leads to inefficient traffic management systems. These traffic timers just show the preset time. This is like using open loop system. If we incorporate a closed loop system using camera, it is possible to predict the exact time on traffic light timers. If the traffic light timers are showing correct time to regulate the traffic, then the time wasted on unwanted green signals (green signal, when there is no traffic) will be saved. Timer for every lane is the simplest way to control traffic. And if those timers are predicting exact time then automatically the system will be more efficien t. This project has been implemented by using the Matlab software and it aims to prevent heavy traffic congestion. This project measure the number of vehicles present on the road. Moreover, for implementing this project Image processing technique is used. At first, film of a lane is captured by a camera. A web camera is placed in a traffic lane that will capture images of the road on which we want to control traffic. Then these images are efficiently processed to know the traffic density on the number of count of vehicles. According to the processed data from Matlab, the controller will send the command to the traffic LEDs to show particular time on the signal to manage traffic.
Keywords – Traffic light control on density count, Digital Signal Processing, A rduino Controlled and Blob Detection. .
I.
I
NRODUCTION
Fast transportation systems and rapid transit systems are nerves of economic developments for any nation. Mismanagement and traffic congestion results
Available online:
https://edupediapublications.org/journals/index.php/IJR/
P a g e | 4657of overcoming such a problem. One way to improve
traffic flow and safety of the current transportation system is to apply automation and intelligent control methods. As the number of road users constantly increases, and resources provided by current infrastructures are limited, intelligent control of traffic will become a very important issue in the future. Traffic congestion may result due to heavy traffic at a junction. To avoid congestion there are so many traffic management techniques available. But no technique is perfect by itself as the real time situations are generally continuously changing and the system has to adapt itself to change in the continuously changing circumstances. We have made an attempt to provide some traffic management strategy which is self-changing in nature, so as to fit into continuously changing real time traffic scenarios. In this system, time is assigned to traffic light of particular lane according to the priority given to particular lane based
on traffic density.
II.
E
XSISTING
S
YSTEMS
The traffic lights used in India are basically pre-timed where in the time of each lane to have a green signal is fixed. In a four lane traffic signal one lane is given a green signal at a time. Thus, the traffic light allows the vehicles of all lanes to pass in a sequence. So, the traffic can advance in either straight direction or turn by 90 degrees. So even if the traffic density in a particular lane is the least, it has to wait unnecessarily for a long time and when it gets the green signal it unnecessarily makes other lanes wait for even longer durations. Many methods had me introduced to solve the problem of traffic using sensor and fuzzy logic
methods, But the problem real time solving the issues is still a challenged. This issues can overcome by using Digital Signal Processing Technique i.e. Image
Processing.
III.
P
ROPOSEDA
RCHITECTUREFig.1. Proposed System Block Diagram
Available online:
https://edupediapublications.org/journals/index.php/IJR/
P a g e | 4658shows that it can decrease the traffic and avoids the
time being wasted by the green light on an empty road. It is also more reliable in estimating vehicle presence because it uses actual traffic images. It visualizes the practically, so its functions much better than those
systems that rely on the detection of the vehicles .
- Hard ware M o d u le:-
1. Arduino At mega 2560
2. Traffic Light Signal(RYG Leds) 3. LCD
4. USB to TTL 5. Power Supply 12V 6. Camera
- So ftware M o d u le:- 1. Arduino IDE 2. Matlab
3. Visual Basic 6.0
4. Prolific(USB to TTL Interfacing) 5. Winvideo(Camera)
6. Pcb Designing- Dip Trace
IV.
M
ETHODOLOGY Imag e acq u is itio n :-The work starts with processing of the captured images using MATLAB software. The camera is stationary, which is mounted on the pole near the traffic signal. This raw digital data is further processed by converting the images from RGB (Red- Green-Blue) to grayscale in order to further process the images.
Fig.2. Image acquisition flow diagram Imag e cro p p in g :-
The second step is to select the targeted area by designing image cropping algorithms in MATLAB. The purpose of cropping is to identify the road (lane) region where the vehicles are present and exclude the unnecessary background information. This unnecessary information is fixed in every frame of the captured pictures. Color Detection:-
The concept of color detection is, as the name suggests, a part of image processing that involves differentiation between objects based on their color. If we are processing an image with a number of colored objects, and we want to process only the ones of a particular color, then color detection methods basically return a binary image where only the portions with relevant color are white, while the rest is black. This reduces the information of the image to only the relevant portions, which make it easier to process for various operations.
Fig.3. Gray Scaled Image Blo b Detectio n :-
Available online:
https://edupediapublications.org/journals/index.php/IJR/
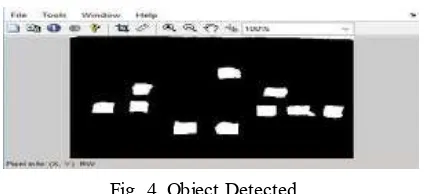
P a g e | 4659Fig. 4. Object Detected
Ob ject Co u n tin g :-
To count the objects present in the image, the close boundaries of the objects are identified. The exterior boundaries of the objects as well as the boundaries of holes inside these objects in the binary image are counted to identify the vehicles which are present in the targeted area.
V.
R
es u lt s &D
is cu s s io nThe Proposed scheme has been implemented by using MATLAB on PC with processor. The 3D Images captured prototype and then compare to matlab software to detect or identify vehicles.
The vehicles count detailed provided in below table.
Sr. No .
Imag e ty p e Fo rmat/ Size
A ctual n o of Veh icles
In d icate No . Imag e th rough s o ftware
Green Sig nal (s ec)
1 Traffic1.jpeg (640 ×640)
18 15 31
2 Traffic2.jpeg (640×640)
19 16 33
3 Traffic3.jpeg (640×640)
50 42 86
4 Traffic4.jpeg (640×640)
25 21 43
5 Traffic5.jpeg 30 25 51
(640×640)
6 Traffic6.jpeg (640×640)
19 17 35
7 Traffic7.jpeg (640×640)
26 21 43
8 Traffic8.jpeg (640×640)
28 24 49
9 Traffic9.jpeg (640×640)
30 26 54
10 Traffic10.jpeg (640×640)
27 23 46
11 Traffic11.jpeg (640×640)
32 26 53
12 Traffic12.jpeg (640×640)
33 27 54
13 Traffic13.jpeg (640×640)
37 31 64
14 Traffic14.jpeg (640×640)
36 32 65
15 Traffic15.jpeg (640×640)
25 22 45
16 Traffic16.jpeg (640×640)
23 19 38
17 Traffic17.jpeg (640×640)
21 18 37
18 Traffic18.jpeg (640×640)
19 15 31
19 Traffic19.jpeg (640×640)
26 22 45
20 Traffic20.jpeg (640×640)
33 26 53
21 Traffic21.jpeg (640×640)
60 50 101
Available online:
https://edupediapublications.org/journals/index.php/IJR/
P a g e | 4660(640×640)
23 Traffic23.jpeg (640×640)
70 68 138
24 Traffic24.jpeg (640×640)
55 46 94
25 Traffic25.jpeg (640×640)
57 49 99
26 Traffic26.jpeg (640×640)
63 56 112
27 Traffic27.jpeg (640×640)
48 39 80
28 Traffic28.jpeg (640×640)
42 36 74
29 Traffic29.jpeg (640×640)
47 40 82
30 Traffic30.jpeg (640×640)
40 34 69
Aveg Acuracy = Total count Images through software Total Actual Images ∗ 100
= 942 1104∗ 100
= 0.856*100 Aveg Accuracy = 85.30 %
False Rate =100-85.30% (Average Accuracy) False Rate = 14.70 %
Webcum Resolution= 640*640
Distance = 200 meter. maintain to signals pole.
The duration of the traffic signal is monitored as follows:
1) The camera controlled by Arduino ATMEGA 2560 microcontroller takes pictures of the all the 4 lanes defined in the range specified. The pictures are transferred to MATLAB for further Processing. 2) The images are processed in MATLAB and the priority of each lane is decided as per IN lanes traffic density.
3) The lane with the highest relative traffic density is given the highest priority and the lane with the lowest traffic density is given the least priority.
4) The lanes are arranged in the descending order of their priorities.
5) The duration of the green signal to a particular lane in determined based on the OUT lanes traffic density of the Lanes in descending order. The more traffic in OUT lane the less time green signal will be ON. This is done to avoid the problem of OUT lanes congestion.
6) After all the lanes have given their green signals based on specified time duration, the traffic light completes its one cycle of traffic monitoring and congestion control.
7) This process repeats and the duration of green signal given to each lane keeps adjusting itself every time the traffic is monitored by camera and the processing of the same is done.
Available online:
https://edupediapublications.org/journals/index.php/IJR/
P a g e | 4661specific threshold, warning of heavy traffic will be
shown automatically. The advantages of this new method include such benefits as use of image processing over sensors, low cost, easy setup and relatively good accuracy and speed. Because this method has been implemented using Image Processing and Matlab software, production costs are low while achieving high speed and accuracy.
The present system uses a single camera for monitoring traffic at an intersection. By using a separate camera for each road at an intersection will allow the system to use video processing which can improve the system efficiency further. The vehicle objects can also be categorized into various classes depending upon the geometrical shape of vehicle for blocking the passage of large vehicles e.g., trucks during day times. The emergency mode can be refined further by installing a GPS receiver in ambulance so that the base station will keep track of the ambulance location on a continuous basis and clear the road whenever will be required.
R
EFERENCES
[1] Madhavi Arora, V. K. Banga, “Real Time Traffic Light Control System”, 2nd International Conference on Electrical, Electronics and Civil Engineering (ICEECE'2012), pp. 172-176, Singapore, April 28-29,
2012.
[2] Georgios Vigos, Markos Papageorgioua, Yibing Wangb, “Real-time estimation of vehicle-count within signalized links”, Journal of Transportation Research Part C: Emerging Technologies, Volume 16, Issue 1,
pp.18–35, February 2008.
[3] Vikramaditya Dangi, Amol Parab, Kshitij Pawar & S.S Rathod, “Image Processing Based Intelligent Traffic Controller”, Undergraduate Academic
Research Journal (UARJ), Vol.1, Issue 1, 2012.
[4] Intelligent Traffic Light Control System using Image Processing, Fr. C Rodrigues Institute of
Technology, Vashi.
[5] http://www.slideshare.net/louiseantonio58/image-
processing-based-intelligent-traffic-control-systemmatlab-gui.
A UTHORS
M r. Sandip S. Des h mu kh , Dept. of Electronics and Tele-communication Engineering, TPCT’s College Of Engineering, Osmanabad- 413501, Maharashtra, India