PHENOTYPIC AND GENETIC DIVERSITY STUDIES ON SELECTED RICE (Oryza sativa L.) GENOTYPES BASED ON AMYLOSE CONTENT AND
GELATINIZATION TEMPERATURE
Mawia Amos Musyoki (B.Tech) I56/25517/2013
A Thesis Submitted in Partial Fulfillment of the Requirements for the Award of the Degree of Master of Science (Biotechnology) in the School of Pure and
Applied Sciences of Kenyatta University
DECLARATION
iii
DEDICATION
ACKNOWLEDGEMENT
I would like to begin by acknowledging the Almighty God for His grace, care and protection that He has extended in my life since the day I began this academic journey. Despite the many challenges I faced, He made me lie down in green pastures and surely goodness and mercies followed me all the time.
I would like to thank my supervisor Dr. Mathew Piero Ngugi for his invaluable guidance, sympathetic attitude and friendly way of supervision throughout my work.
Next, heartfelt and sincere thanks go to Dr. Geoffrey Muriira, my other supervisor for organizing and allowing me to undertake this project at Kenya Bureau of Standards. His help, thoughts and suggestions have been invaluable throughout my candidature.
I owe my deep sense of reverence to my mother Zipporah Ngina, brothers James Kioko and Daniel Mwendwa, uncle Paul Ndavi, cousins Lizzy Ndinda and Kithuka, for their unconditional daily prayers, love, and financial support. They have been a source of inspiration and encouragement for me especially when things were getting tough! Mom, I will forever cherish your prayers.
I am also grateful to the following individuals whose assistance at certain intervals enabled me to smoothly carry out my work: Shadrack Njagi (Mwas), my long-term friend who inspired me to undertake a postgraduate course, filled the application form on my behalf and encouraged me to soldier on during times of darkness! Man, we have come from far and we are going far. The journey to prosperity has started. Also, thanks go to Dorothy Nyamai, Antony Ngari and Jonathan Mulwa for providing me with accommodation when I had no place to sleep, Rose Chemtai, Moureen Langat, Mary Nyawira, Matheri and Makori who assisted me in bench work especially during DNA extraction, Daniel Agyrifo and Susan Rwigi for their kind assistance in data analysis.
Thanks also to my great course mate and rice project colleague Festus Wambua (King’ang’i kya
ndalani) whom we started the bench work almost at the same time. Without his contribution and sense of humour while in the lab, the project would not be where it is today. I would also wish to thank the entire staff in the Department of Biochemistry and Biotechnology who encouraged me throughout the work.
v
TABLE OF CONTENTS
DECLARATION... ii
DEDICATION... ii
ACKNOWLEDGEMENT ... iv
TABLE OF CONTENTS ... v
LIST OF FIGURES ... viii
LIST OF TABLES ... ix
LIST OF APPENDICES ... x
ABBREVIATIONS AND ACRONYMS ... xi
ABSTRACT ... xii
CHAPTER ONE ... 1
INTRODUCTION... 1
1.1 Background information ... 1
1.2 Problem statement ... 4
1.3 Research questions ... 5
1.4 Objectives ... 5
1.4.1 General objective ... 5
1.4.2 Specific objectives ... 6
1.5 Justification and significance of the study ... 6
CHAPTER TWO ... 8
LITERATURE REVIEW ... 8
2.1 Rice (Oryza sativa L.) ... 8
2.1.1 Taxonomy ... 8
2.1.2 Genome evolution... 8
2.1.3 Geographical origin, diversity and cultivation ... 9
2.1.4 World production and trade of rice ... 12
2.2 Rice starch content and grain quality ... 13
2.2.1 Genetic control of amylose content in rice ... 15
2.4 The glutinous rice ... 17
2.5 Rice gelatinization temperature ... 18
2.5.1 Genetic controls of rice gelatinization temperature ... 18
2.6 Assessment of genetic diversity in rice ... 20
2.7 Use of molecular markers in assessment of genetic diversity ... 21
2.8 Isozyme analysis ... 21
2.9 Restriction Fragment Length Polymorphism (RFLPs) ... 22
2.10 Polymerase Chain Reaction (PCR) analysis ... 22
2.10.1 Amplified Fragment Length Polymorphism (AFLP) ... 23
2.10.2 Random Amplified Polymorphic DNA (RAPD) analysis ... 24
2.10.3 Simple Sequence Repeats (SSR) ... 24
2.10.4 Inter Simple Sequence Repeat (lSSR) Analysis ... 25
2.11 Genotyping by sequencing ... 26
CHAPTER THREE ... 28
MATERIALS AND METHODS ... 28
3.1 Plant materials ... 28
3.2 Determination of phenotypic diversity ... 28
3.2.1 Measurement of grains and kernel traits ... 28
3.3 Determination of genetic diversity ... 29
3.3.1 Total genomic DNA extraction ... 29
3.3.2 Analysis of DNA quality ... 30
3.3.3 Analysis of DNA purity based on optical density ... 31
3.3.4 DNA dilutions... 31
3.4 Primers selection for genetic diversity ... 32
3.5 Primers selection for waxy and alk genes ... 33
3.6 PCR amplification ... 33
3.7 PCR product resolution ... 34
3.8 Data management and analysis ... 34
CHAPTER FOUR ... 36
RESULTS ... 36
vii
4.2 Determination of phenotypic diversity ... 41
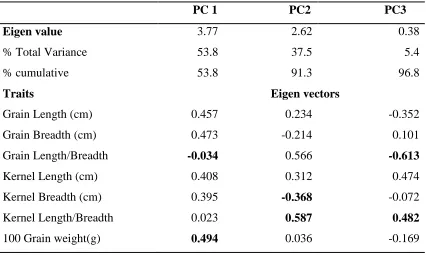
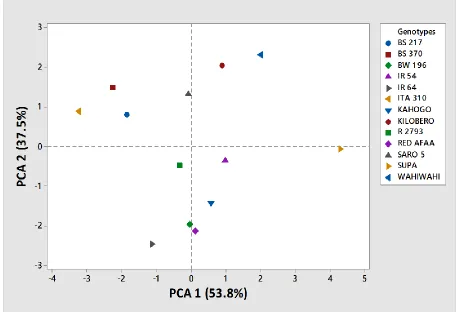
4.3 Principal component analysis (PCA) ... 42
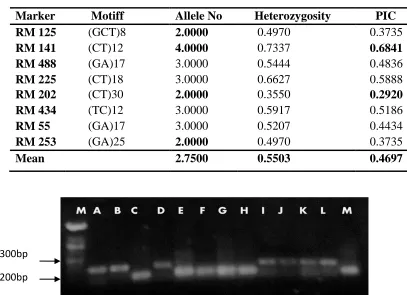
4.4 Assessment of polymorphism from SSR profiles ... 44
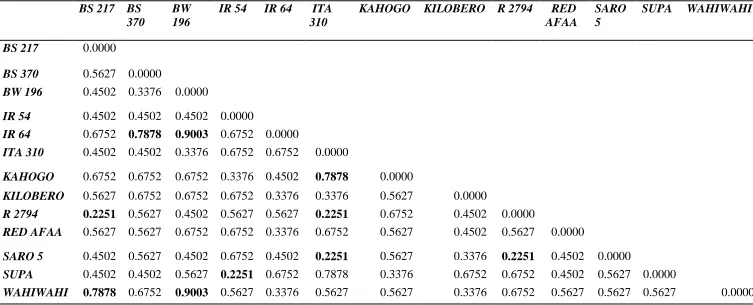
4.5 Pairwise genetic dissimilarity ... 47
4.6 Clustering of rice genotypes ... 50
4.7 Principle coordinate analysis (PCoA) ... 51
4.7 Analysis of molecular variance (AMOVA) ... 52
4.8 Amplification of waxy and alk genes ... 53
CHAPTER FIVE ... 55
DISCUSSION, CONCLUSIONS, RECOMMENDATIONS AND SUGGESTIONS FOR FURTHER STUDIES ... 55
5.1 Discussion ... 55
5.2 Conclusions ... 65
5.3 Recommendations ... 65
5.4 Suggestions for further research ... 66
REFERENCES ... 67
LIST OF FIGURES
Figure 4.1: Dendrogram from mean values of grain and kernel traits among 13 rice genotypes. 42
Figure 4. 2: Clustering of 13 rice genotypes based on 7 grain and kernel traits ... 44
Figure 4.3: SSR RM 141 showing polymorphic pattern of 13 rice genotypes. The letters represent:
M-100bp molecular ladder, A-R 2793, B-BS 217, C-BS 370, D-BW 196, E-ITA 310, F, Saro 5, G-IR 64, H-Kilombero, I-Red Afaa, J-Kahogo, K-Supa, L-IR54, M-Wahiwahi.47
Figure 4.4: Unweighted Neighbor Joining tree showing the genetic relationships among the 13 rice
genotypes based on amylose content and gelatinization temperature using 8 microsatellite
markers ... 51
Figure 4.5: Principle coordinate analysis of the 13 rice genotypes based on amylose content and
gelatinization temperature using 8 SSR markers. ... 52
Figure 4.6: Gel photo showing amplification of waxy gene in some of rice genotypes studied. The letters represent M-molecular ladder, A-R 2793, B-BS217, C-BS 370, D-BW 196, E-ITA 310, F, Saro 5, G-IR 64, H-Kilombero, I-Red Afaa, J-Kahogo, K-Supa, L-IR 54, and
M-Wahiwahi. ... 54
Figure 4.7: Gel photo showing amplification of alk gene across 13 rice genotypes studied. The letters represent M-molecular ladder, A-R 2793, B-BS217, C-BS 370, D-BW 196, E-ITA 310, F,
ix
LIST OF TABLES
Table 2.1: Species complexes of the genus Oryza ... 10
Table 2.2: Known haplotypes of rice based on mutations in the Waxy gene... 16
Table 3.1: Names, origin and category of the rice genotypes ... 29
Table 3.2: List of SSR markers used in the study ... 32
Table 3.3: List of primer pair for waxy and alk gene amplification. ... 33
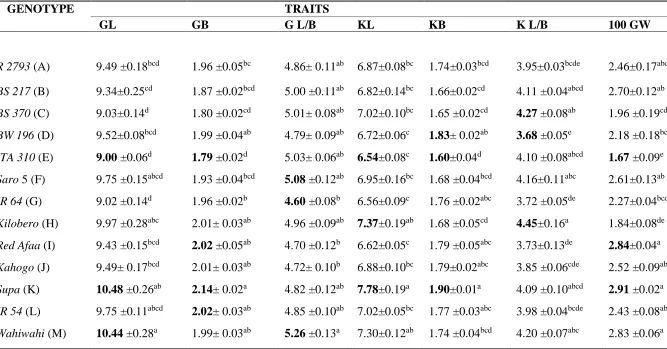
Table 4.1: Analysis of variance among the 13 rice genotypes ………40
Table 4.2: Principal Component Analysis among the rice genotypes ……….43
Table 4.3: Genetic information of polymorphic SSR markers……….47
Table 4.4: SC. Cord coefficients of dissimilarity ………49
LIST OF APPENDICES
Appendix 1: Analysis of grain and kernel traits among the rice genotypes ... 76
xi
ABBREVIATIONS AND ACRONYMS
AC Amylose Content
ADP Adenosine Diphosphate
AFLP Amplified Fragment length Polymorphism AMOVA Analysis of Molecular Variance
ASV Alkali Spreading Value
Bp Base pair
cDNA Complimentary DNA
CTAB Cetyltrimethylammonium bromide DNA Deoxyribonucleic Acid
DSC Differential Scanning Calorimetry EDTA Ethylenediaminetetraacetic acid
FAO Food Agricultural Organization
FAOSTAT Food Agricultural Organization Statistics GBBS Granule Bound Starch Synthase
GT Gelatinization Temperature
IRRI International Rice Research Institute ISSR Inter Simple Sequence Repeats MAB Marker Assisted Breeding
MIAD Mwea Irrigation Agricultural Development Centre
nm Nanometer
PCoA Principal Coordinate Analysis PCA Principal Component Analysis PVP Polyvinyl Pyrrolidone
RAPD Random Amplified Polymorphic DNA RFLP Restriction Fragment Length Polymorphism RPM Rotation Per Minute
RVA Rapid Visco Analyzer
SNP Single Nucleotide Polymorphism
SS Starch Synthase
SSR Simple Sequence Repeats,
TBE Tris-Borate-EDTA
TE Tris-EDTA
TRIPS Trade Related Intellectual Property Rights WTO World Trade Organization
ABSTRACT
Rice cooking and eating qualities are mostly determined by the grain’s starch content which is composed of amylose and amylopectin. Amylose content is regarded as the most important indicator in classifying rice varieties in terms of starch content. Waxy gene located on chromosome 6 codes for Granule Bound Starch Synthase (GBBS) enzyme which is involved in biocatalysis of amylose synthesis in rice endosperm. In addition, amylopectin content influences gelatinization temperature in rice. Alk gene located on chromosome 6 codes for soluble Starch Synthase II (SSII) enzyme involved biocatalysis of amylopectin. Accurate evaluation of these two traits is difficult and has hindered development of better varieties with good eating and cooking qualities by rice breeders both in Kenya and Tanzania. The aim of the study was to carry out phenotypic characterization and genetic diversity studies on selected rice (Oryza sativa L.) genotypes from Kenya and Tanzania based on amylose content and gelatinization temperature using microsatellite markers. Measurement of 7 grain and kernel traits were determined among 13 rice genotypes studied. Genetic diversity based on amylose content and gelatinization temperature was studied using 8 microsatellite (SSR) markers tightly linked to major QTLs controlling these two traits. Furthermore, presence or absence of waxy and alk genes was determined using markers tightly linked to these two genes. Minitab 15.0 and Power marker version 3.25 softwares were used to analyze the data. A dendrogram was constructed from data set of mean values of grain and kernel traits and showed two super clusters; I and II. The number of alleles per locus ranged from 2 to 4 with an average of 2.75 alleles across 8 loci. The polymorphic information content (PIC) values ranged from 0.2920 (RM 202) to 0.6841 (RM 141) in all 8 loci with an average of 0.4697. Pair-wise genetic dissimilarity coefficients ranged from 0.9003 to 0.2201 with an average of 0.5627. Maximum genetic similarity was observed between R 2793 and BS 17, Supa and IR 64, R 2793 and ITA 310,Saro 5 and ITA 310, Saro 5 and R2794. Minimum similarity of was observed between Wahiwahi and BW 196, IR 64 and BW 196. The dendogram based on cluster analysis by microsatellite polymorphism grouped 13 rice genotypes into 2 groups effectively differentiating Kenyan and Tanzanian rice genotypes based on amylose content and gelatinization temperature. The
CHAPTER ONE INTRODUCTION 1.1 Background information
Rice (Oryza spices) is a monocotyledonous plant belonging to the family Granineae and subfamily Oryzoidea. It is cultivated under diverse eco-geographical conditions
in various tropical and subtropical countries. It has a relatively small genome size
which makes it an ideal model plant for study of grass genetics and genome
organization (Caesse et al., 1994). Due to its importance as a food crop, rice is planted on approximately 11% of the Earth’s cultivated land area (Khush, 2005). It is
the crop with the third highest production globally after sugarcane and maize
(FAOSTAT, 2012). Oryza sativa and Oryza glaberrima are the only two cultivated species of rice while the other species are wild. Oryza sativa is commonly grown in Asia, North and South America, Europe and Africa. O. glaberrima is highly grown in West African but due to higher yields of O.sativa and O. glaberrima-sativa
varieties; itis being replaced in most parts of Africa (Linares, 2002).
Rice domestication has led to development of a large number of Oryza sativa
cultivars. Around 100 000 different rice genotypes are held at the international rice
gene bank of which most are Oryza sativa varieties. Rice diversity based on morphology and quality traits such as grain size, shape, colour, aroma and starch
content has been increased due to different socio-cultural traditions and practices
namely: Indica (tropical and subtropical distribution) Japanica (grown in Indonesia)
and Japonica (temperate distribution). Indica and Japonica are the two most widely
grown and researched ecotypes (Takahashi, 1984).
Rice genome has a wider variation when compared to other plant varieties (Ashfaq et al., 2012). The genus oryza has 12 chromosomes in its genome. Oryza sativa, O. glaberrima and 14 wild species are diploid (2n=24) with 24 chromosomes and relatively small genome size (of 430 million base pairs). Other 8 wild species are
tetraploids (2n=48) with 48 chromosomes. Approximately, 50% of the rice genome
is composed of repetitive sequences (Chang, 2003).
Rice cooking and eating qualities are mostly determined by the grain’s starch content
which is composed of two polysaccharides: amylose and amylopectin. Amylose
content (A.C) is regarded as the most important indicator in classifying rice varieties
in terms of starch content. Waxy (Wx) gene located on the short arm of chromosome 6 is the major gene responsible for biosynthesis of amylose in rice. The gene codes
for Granule Bound Starch Synthase (GBBS) enzyme which is involved in
biocatalysis of amylose synthesis in rice endosperm (Umemoto et al., 2002).
3
change at the 5’ splice site of intron1. Apart from genetic factors, amylose content in
rice grain is also regulated by environmental factors such as temperature (Larkin and
Park, 1999).
Gelatinization temperature (GT) refers to the critical cooking temperature at which
water is absorbed and the endosperm starch granule swell irreversibly with
simultaneous loss of crystallinity and birefringence (Waters et al., 2006). A major gene (alk gene) codes for soluble Starch Synthase II (SSII) enzyme involved biocatalysis of amylopectin controls rice gelatinization temperature. The gene is
located in chromosome 6 of the rice genome (Umemoto et al., 2002). This temperature at which rice starch gelatinizes is an important component of rice
cooking quality (Fitzgerald et al., 2009). The texture and gelatinization temperature of rice is directly influenced by the properties of rice starch. Using physicochemical
methods such as Alkali Spreading Value (ASV) for measuring rice gelatinization
temperature, different rice varieties have been grouped into three classes, that is, high
(>74 °C), intermediate (70 – 74 °C) and low (<70 °C) (Juliano, 2003).
Molecular markers such as isozyme, Restriction Fragment Length Polymorphism,
Amplified Fragment length Polymorphism, Random Amplified Polymorphic DNA,
Simple Sequence Repeats, Inter Simple Sequence Repeats and Single Nucleotide
Polymorphism have a number of applications in the study of plant genetics. Each of
application. In rice, SSR markers have been effectively utilized for many purposes
including: genetic diversity and relatedness (Pervaiz et al., 2010), QTL mapping (Guo et al., 2010), marker assisted selection (Thomson, 2009) and rice domestication (Sweeney and McCouch, 2007). These markers are commonly used when studying
rice genetic diversity because they are highly informative, mostly mono locus,
co-dominant and affordable (Chambers and Avoy, 2000). It is, therefore, against this
background that phenotypic characterization and genetic diversity studies on these
selected rice (Oryza sativa) genotypes from Kenya and Tanzania was studied.
1.2 Problem statement
There is a wide range of rice varieties grown both in Kenya and Tanzania. These rice
cultivars are either local landraces or improved varieties and they express different
levels of amylose and amylopectin that influences amylose content and gelatinization
temperature in rice respectively. Since these two traits are key determinant in
cooking and eating qualities of rice, unscrupulous traders often blend rice grains
which have good cooking and eating quality traits with grains which have poor
cooking and eating quality traits based on amylose content and gelatinization
temperature to make more profit from their trade. This causes a negative impact on
rice trade and consumption resulting from the low quality blended rice. Accurate
evaluation of these two traits is difficult and has hindered development of better
varieties with good eating and cooking qualities by rice breeders both in Kenya and
5
amylose content and gelatinization temperature in rice are often inaccurate and time
consuming. However, genetic diversity analysis on these selected rice genotypes
from Kenya and Tanzania based on amylose content and gelatinization temperature
using microsatellite markers has not yet been studied.
1.3 Research questions
i. What are the phenotypic differences among the selected rice genotypes from
Kenya and Tanzania based on grain and kernel traits?
ii. What are the heterozygosity levels for the selected rice genotypes from
Kenya and Tanzania based on amylose content and gelatinization
temperature?
iii. What is the genetic relatedness among the selected rice genotypes from
Kenya and Tanzania based on amylose content and gelatinization
temperature?
1.4 Objectives
1.4.1 General objective
To carry out phenotypic and genetic diversity studies on selected rice (Oryza sativa
1.4.2 Specific objectives
i. To determine phenotypic diversity among selected rice genotypes from
Kenya and Tanzania based on grain and kernel traits.
ii. To determine the level of genetic diversity for the selected rice genotypes
from Kenya and Tanzania based on amylose content and gelatinization
temperature using microsatellite markers.
iii. To determine genetic relatedness among selected rice genotypes from Kenya
and Tanzania based on amylose content and gelatinization temperature using
microsatellite markers.
1.5 Justification and significance of the study
Assessment of diversity in plants is an integral part of plant breeding programs
because it helps plant breeders to develop new crop varieties with desirable qualities.
Rice crop improvement in terms of amylose content and gelatinization temperature is
important since these two traits are key measures of rice eating, cooking and
processing quality. Therefore, the study of diversity based on these two traits using
microsatellite markers tightly linked to genes or Quantitative Trait Loci (QTLs)
controlling these two traits is very necessary for rice improvement strategies. Thus,
this study aimed at assessing diversity based on amylose content and gelatinization
temperature among selected rice genotypes from Kenya and Tanzania using
7
The study findings provided useful information on rice diversity based on amylose
content and gelatinization temperature. These results could be used by rice breeders
in rice improvement strategies on the traits to introduce in the new rice varieties
either through marker assisted breeding (MAB) or genetic engineering to promote
CHAPTER TWO LITERATURE REVIEW 2.1 Rice (Oryza sativa L.)
2.1.1 Taxonomy
Rice (Oryza sativa L.) is a plant belonging to the kingdom plantae, division magnoliophyta, class liliopsida, order poales, family gramineae, genus Oryza and species sativa. The genus Oryza consists of 25 species, of which 23 are wild species and two; O. sativa and O. glaberrima are domesticated (Brar and Khush, 2003). The species sativa is made up of three subspecies namely: Indica, Japonica and Japanica.
2.1.2 Genome evolution
Rice genome has vast variation more than thousand varieties have been produced
around the world (Ashfaq et al., 2012). The basic chromosome number of the genus
Oryza is 12. O. sativa, O. glaberrima and 14 wild species are diploid (2n=24) with 24 chromosomes and relatively small genome size (430 million base pairs).
Approximately, 50% of the genome is composed of repetitive sequences (Chang,
2003). Other 8 wild species are tetraploids (2n=48) with 48 chromosomes. Genome
analysis done on the basis of chromosome pairing behavior and fertility in
interspecific hybrids and degree of sexual compatibility has made possible to classify
species in the genius Oryza into nine distinct genomes. The genus Oryza has also been classified into four complexes which reflect genetic diversity of genus (Khush,
9
are pantropical as shown in Table 2.1. Of these four complexes, O. Sativa and O. Officinalis complexes are the best studied. The Sativa complex comprises the cultivated species O. sativa and O. glaberrima and their wild ancestors’ viz., perennial rhizomatous O.longistaminata, O.barthii (formerly O. breviligulata) and
O. rufipogon, O. nivara and O. sativa f. spontanea. The species of Sativa complex constitute the primary gene pool of rice while the species belonging to Officinalis
complex constitute the secondary gene pool. The species belonging to Meyeriana,
Ridleyi complexes and O. schlechteri constitute the tertiary gene pool (Khush, 1997).
2.1.3 Geographical origin, diversity and cultivation
The centers of origin and diversity of O. sativa and O. glaberrima have been traced using archaeological evidences, geographical distribution and genetic diversity. River
valleys of Yangtze and Mekon are the primary centers of origin of O. sativa. On the other hand, Niger River delta in Africa is the centre of origin of O. glaberrima
(Huang et al., 2012). The foothills of the Himalayas, northern parts of Myanmar and Yunnan Province of China are some of the centresof diversity for Asian rice species.
The centre of diversity of O. glaberrima is believed to be the Inner delta of River Niger and some areas around Guinean coast. O. sativa is believed to have evolved from O. nivara while O. barthii is believed to be the progenitor of O. glaberrima
O. sativa L. 24 Worldwide: originally South and Southeast Asia
O. nivara 24 South and Southeast Asia
O. rufipogon 24 South and Southeast Asia,South China
O. meridionalis 24 Tropical Australia
O. glumaepetula 24 Tropical America
O. glaberrima 24 Tropical West Africa
O. barthii 24 West Africa
O. longistaminata 24 Tropical Africa
II. Officinalis Complex
O. punctata 24 East Africa
O. rhizomatis 24 Sri Lanka
O. minuta 48 Philippines, New Guinea
O. malamphuzaensis 48 Kerala and Tamil Nadu
O. officinalis 24 South and Southeast Asia
O. alta 48 Central and South America
O. grandiglumis 48 South America
III. Meyeriana Complex
O. granulata 24 South and Southeast Asia
O. meyeriana 24 Southeast Asia
IV. Ridleyi Complex
O. longiglumis 48 Indonesia, New Guinea
O. ridleyi 48 Southeast Asia
V. Unclassified (belonging to no complex)
O. brachyantha 24 West and Central Africa
O. schlechteri 48 Indonesia, New Guinea
A large number of O. sativa cultivars have been developed through centuries of rice domestication either through natural evolution, conventional breeding or marker
assisted breeding (MAB). Around 100 000 different rice genotypes are held at the
international rice gene bank in Philippine. Both phenotypic and genetic diversity of
Oryza sativa is very wide. Different rice varieties are distinguished based on many features such as growth habit, adaptation to different water regimes, shape, size and
colour of the grain among many others. Generally, grains of japonica subspecies are
shorter and wider. Grains of indica subspecies are softer and stickier when cooked
(Kasem, 2012). Based on starch content, different rice genotypes have different levels
of amylose and amylopection in their grain endosperm. In terms of amylose content,
there are five distinct classes, namely: high amylose (above 24%), intermediate amylose
(20–24%), low amylose (10–19%), very low amylose (3–9%) and waxy (0–2%),
(Suwannaporn et al., 2007). In terms of amylopectin content which influences rice gelatinization temperature, there are three different classes, namely: low (<70 °C),
intermediate (70 – 74 °C) and high (>74 °C) (Juliano, 2003).
Oryza sativa is the most widely grown in Asia, Europe, North and South America and Africa continent. On the other hand, O. glaberrima is mostly grown in West African. Desirable agronomic, eating and cooking quality traits associated with O.sativa and O. glaberrima-sativa hybrids has led to replacement of O.glaberrima in most parts of African countries (Linares, 2002). Based on ecological growth distribution, rice
subtropical distribution) and Japanica (grown in indonasia). Indica cultivars are highly
grown in tropical and subtropical regions while japonica cultivars are highly grown in
temperate regions and can germinate and grow under low temperatures (15-20oC)
(McDonald, 1994).
2.1.4 World production and trade of rice
Fifty seven percent of (57%) of the world’s total population depends on rice as their
chief staple food. It is the crop with the third-highest worldwide production after
sugarcane and corn (Rutger et al., 1998). It is cultivated in about 162.3 million hectares in the world accounting for the total production of about 738.1 million tones. Rice
production has doubled in the last 40 years. The increased production has been as a
result of improved field yields and cultivation of hybrid varieties with better agronomic
traits (FAOSTAT, 2012).
China is the largest producer of rice followed by India, Indonesia, Bangladesh, Vietnam
and Thailand. These countries accounts for 95% of its production. As a result, many
rural populations depend on it as the major source of income. In Africa, Benin, Burkina
Faso, Cameroon and Chad are the greatest producers. However, rice production in
Africa has declined over the last 20 years due to shortcomings such as climatic changes
13
locally. As a result, the huge deficit is met through imports especially from Asian
countries such as India and Thailand (FAO, 2013).
The international rice market is regarded as “thin” and “volatile”. This is because global
rice trade accounts for only 7% (35 MMT) of total production. Rice is mostly eaten in
the same country where it is produced and a shortfall in production results in volatility
in rice prices. In addition, many Asian countries have strict policies and restrictions on
rice import and exports in order to achieve domestic food security and to protect
producer prices and income, causing major distortions in trade. Thailand is the chief
exporter of rice followed by Vietnam, Pakistan, the United States, India, Italy, Uruguay,
China, the United Arab Emirates, Benin, Argentina, and Brazil, which account for more
than 90% of the global rice traded. Both China and India continue to view rice as a
strategic commodity for food security (FAO, 2013).
Many countries such as Saudi Arabia, Iraq, Cote d’Ivore, South Africa, Cameroon,
Mexico, the United States, and Brazil import rice from Asian countries. Many of the
world’s least developed countries import rice to meet their national food security needs
(Muthayya et al., 2014).
2.2 Rice starch content and grain quality
There are two classes of rice based on starch content, that is, waxy and non waxy rice.
amylopectin. Glutinous or waxy rice in which endosperm starch lacks or has very little
amylose content consists mainly of amylopectin starch (Bertoft and Koch, 2000)
The ratio of amylose to amylopectin has a major effect on the physical properties of
starch. When cooked, the semi-crystalline structure of rice starch is disrupted thus
transforming the starch into a softer, edible, and gel-like material (Ramesh et al., 1999).
Various physical and chemical characteristics such as milling, cooking and nutritional
qualities are used to determine the quality of rice grain. Cooking quality is measured by
physicochemical characteristics such as: gelatinization temperature (GT), amylose
content (AC) and gel consistency (GC). Amylose content (AC) is used as the main
indicator in classifying rice varieties because it is associated with cooked rice
tenderness (Champagne et al., 2004).
Rice varieties with low-amylose such as japonica content tend to be soft and sticky
when cooked (Asghar et al., 2012). Indica varieties which have high amylose content tend to be dry, firm and fluffy when cooked. Rice varieties with intermediate amylose
content such as IR 64 variety are more preferable because they do not become sticky or
dry when cooked. Generally, the amylose content of milled rice is classified into five
classes: waxy (0–2%), very low amylose (3–9%), low amylose (10–19%), intermediate
15
2.2.1 Genetic control of amylose content in rice
Amylose content in rice is controlled by an allelic series at one locus with major effects
and by one or more modifier genes with minor effects (Sano, 1984). Waxy (Wx) gene located on chromosome 6 is the major gene responsible for amylose synthesis in rice.
The gene code for Granule Bound Starch Synthase (GBBS) enzyme which is plays a
crucial role in biocatalysis of amylose synthesis in rice endosperm (Tanaka et al., 1995). In addition, other minor genes such as dull and amylose extender (ae) are reported to play an important role in modification of amylose in rice (Isshiki et al., 2000).
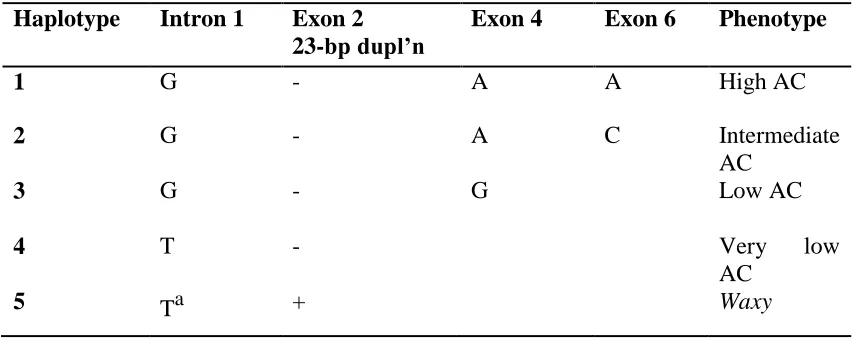
The different amylose classes as shown in Table 2.2 are due to single nucleotide
polymorphisms in the Wx gene. The high and low amylose content in rice controlled by
Wxa and Wxb alleles respectively. These functional alleles are caused by single base change at the 5’ splice site of intron 1 (Hirano et al., 1998). The G→T mutation in the splice site of intron 1 causes inefficient transcription because of alternate splicing
Table 2.2: Known haplotypes of rice based on mutations in the Waxy gene
Post-transcriptional processing of GBSS transcripts plays a key role in determining
amylose content (Wang et al., 1995). The amylose and Wx protein content in rice endosperm are correlated with the ability of the variety to excise intron 1 from the
leader sequence of the Wx transcript. The low-level expression of Wxb results from G to-T mutation at 5’ splice site of the first intron. This mutation was shown the
inefficient splicing of intron 1 present in the untranslated leader region (Wang et al.,
1995).
Rice varieties with high levels of amylose content accumulates significant amount of
completely processed GBSS mRNA, the mature 2.3 kb Wx mRNA, and have the sequence AGGTATA at the putative leader intron 5'-splice site. In contrast, rice
varieties with low amylose content accumulates both completely processed GBSS
mRNA, and a partially processed transcript containing the leader intron, a 3.3-kb
pre-mRNA, and have a single G-to-T mutation at the putative leader intron 5'-splice site that
Haplotype Intron 1 Exon 2 23-bp dupl’n
Exon 4 Exon 6 Phenotype
1 G - A A High AC
2 G - A C Intermediate
AC
3 G - G Low AC
4 T - Very low
AC
17
converts this sequence to AGTTATA. This mutation causes the reduction of mature
GBSS mRNA, accumulation of GBSS transcripts that retain the leader intron, and
activation of cryptic splice sites (Wang et al., 1995).
2.3 Role of temperature in rice amylose content
Environmental factors such as temperature regulate rice amylose content especially
during seed development (Larkin and Park, 1999). Some rice varieties accumulate more
amylose when grain-filling proceeds under cooler temperature condition. The Wx locus regulates the increase in amylose content at cool temperature. Umemoto et al. (1995) found that the GBSS activity in endosperm was 3 to 3.5 folds higher at 15οC than 25οC.
In contrast, the levels of other enzymes involving in starch synthesis such as sucrose
synthesis and soluble starch synthase remained the same or were lower at 15οC.
2.4 The glutinous rice
Glutinous rice is commonly grown for in-house consumption especially in Thailand and
Japan. It has a unique starch quality that makes its demand too high especially to
modified food manufacturers for the production of foodstuffs such as rice crackers. It is
highly adapted to lowland rainfed fields where growing conditions are harsh and
diverse. A single base pair mutation in the Wxa allele encoding GBSS enzyme leads to a low amylose content accumulation in the endosperm of glutinous rice (Wang et al.,
2.5 Rice gelatinization temperature
The cooking temperature at which water is absorbed and the endosperm starch granule
swell irreversibly with subsequent loss of crystalline structure is referred to as
gelatinization temperature (GT). Gelatinization temperature is an important component
of rice cooking quality (Cuevas et al., 2010). Rice grain with low gelatinization temperature takes shorter cooking times leading to significant potential savings in fuel
costs (Fitzgerald et al., 2009).
Three classes of GT are recognized in rice breeding programs: high (>74 °C),
intermediate (70 – 74 °C), and low (<70 °C) (Juliano, 2003; Waters et al., 2006). In these programs, physicochemical methods such as differential scanning calorimetry
(DSC) are commonly used to classify grains by GT: deducting 3 °C from the pasting
temperature derived from the Rapid Visco Analyser (RVA) (Normand and Marshall,
1989). However, these methods are associated with several limitations such as time
consuming and inaccuracy of the machine (Cuevas et al., 2010).
2.5.1 Genetic controls of rice gelatinization temperature
A link between the GT of rice starch and enzymes of starch bio-synthesis was made
when it was found that the major gene (alk gene) that controls rice starch GT via amylopectin structure, codes for soluble Starch Synthase IIa (SSIIa) enzyme. The gene
19
(SNP), two of which are associated with GT class (Umemoto and Aoki, 2005;
Waters et al., 2006). Rice cultivars belonging to the high GT class has haplotype G/GC while rice cultivars with low GT class either have A/GC or G/TT at the key SNP
sites (Nakamura et al., 2002).
Fortunately, the structure and the mechanism leading to high and low GT have already
been discovered. Amylopectin, the other polymer of starch, is composed of linear
glucose units linked by α-1, 4 bonds, which are organised into clusters with α-1, 6
bonds at the branch points (Ball and Morell, 2003). At the ultra-structural level, GT is
affected by the debranched chain-length distributions of amylopectin within the
crystalline lamella; particularly, the proportions of chains with lengths (measured as X)
6 – 12 and 12 – 24 (Nakamura et al., 2002). Starch Synthase I (SSI) elongates chains of X6 – 12 (Fujita et al., 2006) while Starch SynthaseIIa (SSIIa) extends the lengths of these chains further to X12 – 24 (Konik-Rose et al., 2007). These differences in proportions of chains with X6 – 12 and X12 – 24 is as a result of mutations in the alk
gene (Umemoto et al., 2004).
Apart from high and low rice gelatinization temperature classes; we also have rice
varieties with intermediate GT (Juliano, 2003). Rice breeders tend to selects rice
varieties with intermediate GT during rice improvement although the genetic basis
6, called alk2(t), is associated with amylopectin biosynthesis in (Shu et al., 2006). Other enzymes such as starch synthase (Butardo et al., 2011), could also be involved in changing the amylopectin structure leading to intermediate GT (Ryoo et al., 2007).
2.6 Assessment of genetic diversity in rice
Genetic diversity studies in plants are an integral part of plant breeding. Exploitation of
phenotypic and genetic diversity helps the plant breeder to develop new varieties with
improved traits. Diversity studies on Oryza sativa have attracted great interest. This is due to the fact that rice is a major world crop. For instance, exploitation of diversity in
indigenous landraces has led to identification of new superior genes which has been
used by rice breeders in improvement of rice germplasm (Oliveira et al., 2007; Thomson et al., 2007).
Sequencing of the Indica and japonica genomes have made rice a model crop and
provided breeders a quick approach to improve rice cultivars. Some researchers use
morphological characterization approaches for studying diversity although it is time
consuming. Biochemical markers are also used for diversity studies although they are
limited in number and affected by developmental stages of the plant (Winter and Kahl,
1995). As a result, molecular markers have been widely used in genetic diversity studies
due to their various merits associated with them such as cost effective, abundance in
nature and are not affected by different developmental stages in plants (McCouch et al.,
21
2.7 Use of molecular markers in assessment of genetic diversity
There are numerous types of molecular markers available for use when carrying out
genetic diversity studies. Each of these markers have their own advantages and
disadvantages hence there is need to consider these carefully before their application.
Above all, a major consideration should be taken so that the marker technique used
should provide maximum information in a cost-effective manner and do not require
complex equipment when using them (Godwin et al., 1997)
Use of restriction fragment length polymorphism (RFLP) and polymerase chain
reaction (PCR) have recently replaced application of allozyme analyses in detection of
genetic polymorphism (Williams et al., 1990)
2.8 Isozyme analysis
Isozyme markers have been widely used in plant breeding programmes and
determination of genetic diversity in natural populations. Isozymes are usually allelic
or occur at independent loci and can be separated on polyacrylamide gels on the basis
of size and charge at a set PH (Lebot and Aradhya, 1991).
Isozymes have got several merits over other classes of simply inherited genetic
markers. These include the ability to assay many samples at a time and relatively low
cost (Avise, 1994). However, they are unable to detect diversity within non-coding
genes (Dawson et al., 1995). Also, isozymes are usually affected by growth stage and conditions of the plant growth (Dawson et al., 1995).
2.9 Restriction Fragment Length Polymorphism (RFLPs)
Restriction Fragment Length Polymorphism technique examines the variation in size
of specific DNA fragment following digestion with restriction enzyme. Numerous
studies have demonstrated the application of RFLP analysis genetic analysis within
species such as rice (Wang and Tanksley, 1989). Due to probe sequence homology,
these markers are suited to phylogenetic analysis between related species (Bhat et al.,
1997). They are co-dominant markers and hence can be good estimators of
heterozygosity (Godwin et al., 2001).
Despite the advantages associated with RFLP markers, they have considerable
limitations such as: relatively large quantities of pure genomic DNA are required and
the technique generally uses radioisotopes in the detection system (Chalmers et al.,
1995).
2.10 Polymerase Chain Reaction (PCR) analysis
Discovery of polymerase chain reaction (PCR) has revolutionized the analysis of
nucleotide sequence variability (Saiki et al., 1988). It provides a huge array of techniques for detecting polymorphism that do not require the use of radioactivity and
23
Three widely used PCR based markers are Random Amplified Polymorphic DNA
(RAPD) (Williams et al., 1990), microsatellites (Tautz, 1989) and Amplified Fragment Length Polymorphism (AFLP) (Vos et al., 1995). Each marker technique has its own merits and demerits.
The major advantage of using PCR technique is the high speed with which results are
generated, ability to share information on primer sequence without the need to
exchange DNA and low amounts of genomic DNA required for PCR (Godwin et al.,
2001).
2.10.1 Amplified Fragment Length Polymorphism (AFLP)
This technique uses restriction fragment analysis but a PCR approach is used instead of
hybridization probe. Amplified Fragment Length Polymorphism markers are genomic
fragments detected after selective PCR amplification, which provide a number of
appealing features in the fingerprinting of genomes of different complexity (Vos et al.,
1995).
The advantages of using AFLP technique include production of a large number of
polymorphisms, no sequence information is required and results are reproducible
steps involved to produce results. In addition, AFLP is mainly a dominant marker
(Wolfe and Liston, 1998).
2.10.2 Random Amplified Polymorphic DNA (RAPD) analysis
Random Amplified Polymorphic DNA markers have been used to study diversity
among many plants species (Duarte et al., 1999; Maciel et al., 2001). Random Amplified Polymorphic DNAs have also been employed in the construction of genetic
linkage maps in E. grandis and E. urophylla (Grattapaglia and Sedroff, 1994). However, there are some reliability problems and most of the markers generated are
dominant. There is also a lack of cross-transferability and it must be acknowledged that
in some cases, fragments that are of the same length may not necessarily be of the same
sequence. Some of these problems can be overcome by cloning and partially sequencing
the fragments, to turn these into sequence characterized amplified regions (Paran and
Michelmore, 1993), which are usually more robust than RAPDs.
2.10.3 Simple Sequence Repeats (SSR)
Simple Sequence Repeats are also known as microsatellites or variable number of
tandem repeat markers and they are easily available in any region of the genome
(McCouch et al., 1997). In rice, SSR markers have been effectively utilized in the study of genetic diversity and relatedness (Pervaiz et al., 2010), QTL mapping (Guo et al.,
2010), marker assisted selection (Thomson, 2009) and rice domestication (Sweeney and
25
These markers are more popular in rice because they are highly informative, mostly
mono locus, co-dominant, easily analyzed and cost effective (Chambers and Avoy,
2000). Compared to RFLPs, microsatellite markers detect a significantly higher degree
of polymorphism in rice (Wu and Tanksley, 1993) and are especially suitable for
evaluating genetic diversity among closely related rice cultivars (Akigi et al., 1997).The greatest disadvantage of the SSRs is the initial cost in finding and sequencing the loci.
They also have limited use for phylogenetic analysis due to their high mutation rate
(Chambers and Avoy, 2000).
2.10.4 Inter Simple Sequence Repeat (lSSR) Analysis
Inter Simple Sequence Repeats are semi-arbitrary markers amplified by PCR in the
presence of one primer that is complementary to a target SSR. Inter Simple Sequence
Repeats are useful for detecting genetic polymorphism, and have been used to
fingerprint closely related individuals (Zietkiewicz et al., 1994) and for genetic diversity studies (Tsumura et al., 1996). Inter Simple Sequence Repeats markers have been successfully used for the assessment of genetic diversity in corn (Kantety et al.,
1995), for cultivar identification in potatoes (Charters et al., 1996) and for linkage to a specific gene (Akagi et al., 1996).
The ISSR technique does not require prior knowledge of the SSR target sequences, are
highly reproducible, does not require radiolabelling and show high levels of
The main disadvantage of ISSR technique is lack of co-dominance and the consequent
resolution of effectively biallelic loci (band presence verses absence) (Tsumura et al.,
1996).
2.11 Genotyping by sequencing
Genotyping by sequencing, or next-generation genotyping, is a genetic screening
method for discovering novel plant and animal SNPs and performing genotyping
studies (Poland and Rife, 2012). For some applications, such as genotype screening and
genetic mapping, sequence-based genotyping provides a lower-cost alternative to arrays
for studying genetic variation. The application of next-generation sequencing (NGS)
technologies has led to remarkable advances in whole genome sequencing, which
provides ultra-throughput sequences to revolutionize plant genotyping and breeding. To
further broaden NGS usages to large crop genomes such as maize and wheat,
genotyping-by-sequencing (GBS) has been developed and applied in sequencing
multiplexed samples that combine molecular marker discovery and genotyping.
Genotyping-by-sequencing is a novel application of NGS protocols for discovering and
genotyping SNPs in crop genomes and populations. The GBS approach includes the
digestion of genomic DNA with restriction enzymes followed by the ligation of barcode
adapter, PCR amplification and sequencing of the amplified DNA pool on a single lane
27
interpret GBS datasets. As an ultimate MAS tool and a cost-effective technique, GBS
has been successfully used in implementing genome-wide association study (GWAS),
genomic diversity study, genetic linkage analysis, molecular marker discovery and
genomic selection under a large scale of plant breeding programs (Huang and Han,
CHAPTER THREE MATERIALS AND METHODS 3.1 Plant materials
A total of 13 rice genotypes comprising of local landraces and improved rice genotypes
were collected from Mwea Irrigation Agricultural Development Centre (MIAD) repository
in Mwea, Kenya and Kilimanjaro Agricultural Research Institute repository in Moshi,
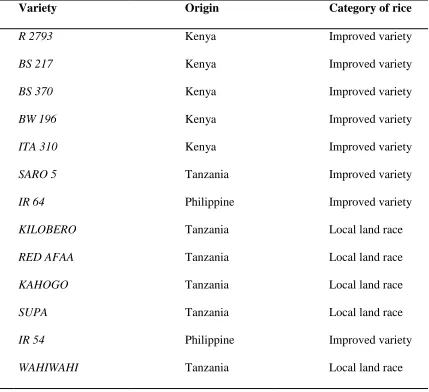
Tanzania. The 13 rice genotypes studied were mostly farmer preferred genotypes due to
their high yield production. The name, country of origin and category of the rice genotype
chosen for the study are given in table 3.1. Genotype IR 64 was used as the check variety
since it is known to have both intermediate amylose content and gelatinization temperature
(Khush and Virk, 2005).
3.2 Determination of phenotypic diversity 3.2.1 Measurement of grains and kernel traits
The following seven (7) phenotypic traits were measured in this study; grain length
(GL), grain breadth (GB), grain length/breadth (G-L/B), kernel length (KL), kernel
breadth (KB), kernel length/breadth (K-L/B) and 100 grain weight (100 GW). For each
of the rice genotype, 10 grains were randomly selected and their measurement taken
using a digital vernier caliper. Weight of 100 rice grains from each genotype was
determined using an electronic weighing balance (Mettler toledo), and average weight ±
29
Table 3.1: Names, origin and category of the rice genotypes
3.3 Determination of genetic diversity 3.3.1 Total genomic DNA extraction
Genomic DNA was extracted from seed samples using a modified CTAB method
according to Doyle and Doyle (1990). The seeds were washed in 70% ethanol and
rinsed with distilled water. The sterilized seeds were ground into powder by the use of a
Variety Origin Category of rice
R 2793 Kenya Improved variety
BS 217 Kenya Improved variety
BS 370 Kenya Improved variety
BW 196 Kenya Improved variety
ITA 310 Kenya Improved variety
SARO 5 Tanzania Improved variety
IR 64 Philippine Improved variety
KILOBERO Tanzania Local land race
RED AFAA Tanzania Local land race
KAHOGO Tanzania Local land race
SUPA Tanzania Local land race
IR 54 Philippine Improved variety
tissuelyser (QIAGEN) and the DNA extracted with 550 µl of CTAB extraction buffer
(2% CTAB), 100 mM Tris-HCL (PH 7.5), 1.4 M NaCI, 20 mM EDTA (PH 8.0) 0.2%
mercaptoethanol and 0.8g of polyvinyl pyrrolidone (PVP) preheated at 65°C. The
grinded seeds mixed with the buffer were then incubated for 30 minutes at 65°C with
intermittent shaking. Five hundred and fifty microlitres of chloroform-isoamyalcohol
(24:1) was then added to the tubes with the mixture in a fume hood and shaken gently.
The mixture was then centrifuged at 14000 rpm for 10 minutes at room temperature.
The supernatant (top layer) containing DNA was pipetted out into a 1.5ml tube to which
DNA was precipitated with 0.7 volume of ice cold isopropanol which was allowed to
take place overnight. The samples were centrifuged for 10 minutes at 13000 rpm at 4°C
so as to obtain the nucleic acid pellet. The solution was then poured out carefully so as
not to dislodge the pellet. Five hundred microlitres of 70% ethanol was added to the
pellet making sure the pellet was suspended fully. Centrifugation was then done for 10
minutes at 13000 rpm at 4°C and the ethanol poured out. This cleaning step was
repeated again including centrifugation and ethanol carefully poured out so as not to
dislodge the pellet. The pellet was then dried under vacuum before being resuspended in
100 µl TE buffer (100 mM TrisHCl pH 7.5,1 mM EDTA) and then stored at -20°C.
3.3.2 Analysis of DNA quality
The quality of the genomic DNA was determined in a 1% agarose gel in 100ml TBE
electrophoresis by running 10 µl of genomic DNA at a voltage of 75 for 45 minutes.
31
DNA (Hosaka and Uno, 2011). The gel was pre-stained using ethidium bromide. Two
(2) µl of each sample mixed with 1µl of loading dye (bromophenol blue, xylene cyanol
and sucrose) was loaded into each well. Electrophoresis was carried out at 75 volts and
150 mA for 45 minutes. Gels were viewed under UV illumination and photographed
using GDS 8000 Gel Documentation System (UVP Inc., California, USA).
3.3.3 Analysis of DNA purity based on optical density
DNA purity for each sample solution was evaluated using a spectrophotometer which
employed the Thermo Scientific Nano drop 2000 system (Wilmington, USA). A 1: 100
dilution of DNA in IX TE buffer was made by mixing 5 µl of the DNA solution with
495 µl of TE buffer. The absorbance (optical density) of the DNA samples was
measured at 260 nm and the concentration determined assuming an equivalent of
50mgl-1 to one absorbance unit at 260 nm. In essence, A260/280 of 1.8-2.0 represents pure
DNA preparation, purity of the samples were obtained by taking their absorbance at 260
nm and 280 nm and comparing the resulting ratio with that of pure DNA preparation.
3.3.4 DNA dilutions
For PCR analysis, a dilution of genomic DNA was prepared by adding 20 µl of sterile
distilled water to the tube containing the DNA pellet. The diluted DNA was divided into
three portions. The first portion was used to carry out genetic diversity among the rice
genotypes using SSR markers. The second and the third portions were used to
were closely linked to these genes. These dilutions were stored at -20°C and were only
thawed twice before discarding, so as to maintain the integrity of DNA.
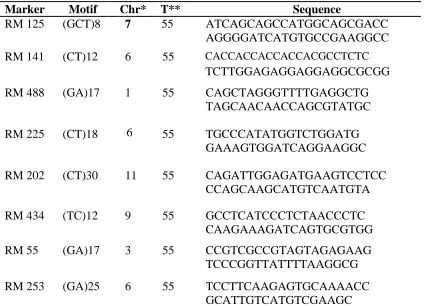
3.4 Primers selection for genetic diversity
A set of 8 microsatellite markers shown in table 3.2 covering different genomic regions of
rice were selected from published research-based data for rice SSR markers as described
by (Panaud et al., 1996; McCouch et al., 2002).
Table 3.2: List of SSR markers used in the study
Chr*-chromosome on which marker is located, T**-annealing temperature.
Marker Motif Chr* T** Sequence
RM 125 (GCT)8 7 55 ATCAGCAGCCATGGCAGCGACC AGGGGATCATGTGCCGAAGGCC
RM 141 (CT)12 6 55 CACCACCACCACCACGCCTCTC
TCTTGGAGAGGAGGAGGCGCGG
RM 488 (GA)17 1 55 CAGCTAGGGTTTTGAGGCTG TAGCAACAACCAGCGTATGC
RM 225 (CT)18 55 TGCCCATATGGTCTGGATG GAAAGTGGATCAGGAAGGC
RM 202 (CT)30 11 55 CAGATTGGAGATGAAGTCCTCC CCAGCAAGCATGTCAATGTA
RM 434 (TC)12 9 55 GCCTCATCCCTCTAACCCTC CAAGAAAGATCAGTGCGTGG
RM 55 (GA)17 3 55 CCGTCGCCGTAGTAGAGAAG TCCCGGTTATTTTAAGGCG
33
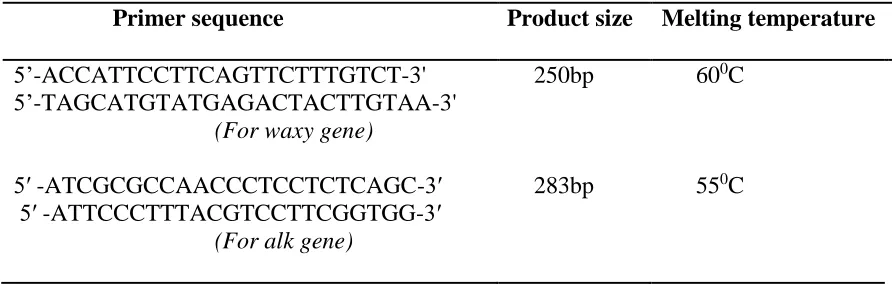
3.5 Primers selection for waxy and alk genes
The synthetic primer used for amplification of waxy gene was designed from the published nucleotide sequence of the waxy gene that is available from GenBank under accession number AF031162. This primer pair has been reported previously and
flanked the beginning of exon 1 and the beginning of intron 1 (Prathepha, 2003). The
primer used for amplification of alk gene was selected from published data of a list of PCR-based molecular markers developed by Ghao et al. (2003). The expected product size of each primer is shown in table 3.3 below. The amplification of waxy and alk
genes was to provide a preliminary data for determining presence or absence of these
two genes.
Table 3.3: List of primer pair for waxy and alk gene amplification.
3.6 PCR amplification
PCR reactions were carried out in Thermal cycler (Bio Rad Inc. USA) with the total
reaction volume of 25μl containing, 5μl of genomic DNA, 1X assay buffer, 200μM of
dNTPs, 2μM MgCl2, 0.2μM of forward and reverse primer and 1 unit of Taq DNA
polymerase (Fermentas Life Sciences). The PCR cycles were programmed as 95oC for 2
Primer sequence Product size Melting temperature
5’-ACCATTCCTTCAGTTCTTTGTCT-3' 5’-TAGCATGTATGAGACTACTTGTAA-3'
(For waxy gene)
250bp 600C
5′ -ATCGCGCCAACCCTCCTCTCAGC-3′ 5′ -ATTCCCTTTACGTCCTTCGGTGG-3′
(For alk gene)
min, 94oC for 1 min, 55oC to 670C (depending on the primer used) for 1 min, 72oC for 2
min for 35 cycles and an additional temperature of 72oC for 10 min for final extension.
3.7 PCR product resolution
The PCR products were resolved by electrophoresis on 1.0% agarose gels in 0.5X TBE
buffer pre-stained with 10 µl of ethidium bromide then electrophorized at 100V for 1
hour. Ten (10) µl of each of the PCR product was mixed with 2 µl of loading dye and the
mixture loaded and run on the gel at a constant voltage of 100V for a period of 1h to 2
hours. The PCR products were visualized under UV light and then gel photos taken and
saved in a computer. The gels were then visualized under UV trans-illuminator and
photographs were taken using GDS 8000 Gel Documentation System (UVP Inc.,
California, USA). The PCR products were sized against l00bp DNA ladder (Life
sciences-USA). Clearly resolved, unambiguous bands were scored visually for their
presence or absence with each primer. The scores were obtained in the form of matrix
with ‘1’ and ‘0’, indicating the presence and absence of bands in each variety
respectively.
3.8 Data management and analysis
To determine phenotypic relatedness based on grain and kernel traits of the 13 rice
genotypes, the data was analyzed statistically for the difference in means for the 7 grain
and kernel traits measurement through ANOVA followed by Tukey’s post hoc to
35
phenotypic relatedness among the 13 rice genotypes. To assess the underlying source of
variation in morphology based on the 7 grain and kernel traits among the 13 rice
genotypes, Principal component analysis (PCA) was carried out. All analyses were done
using software Minitab 15.0. (State College Pennsylvania-USA).
The different alleles amplified using the 8 SSR markers among the 13 rice genotypes
were identified on the basis of their size using 100bp DNA ladder (Life sciences-USA).
Genetic diversity of each rice genotype was analyzed on the basis of four statistical
parameters: major alleles, allele number, gene diversity and polymorphism information
content (PIC), which measures the genetic diversity (Botstein et al., 1980). Genetic
distance was calculated using ‘’C.S Cord 1967’’ distance (Cavalli-Sforza and Edwards,
1967) followed by phylogeny reconstruction using unweighted Neighbor Joining as
implemented in DARwin version 6.0.12 software.
To visualize the relationship between the sample populations among the 13 rice
genotypes, principle coordinate analysis (PCoA) was conducted using GenALEx 6.5
software (Peakall and Smouse, 2009). It was chosen to complement the UPGMA cluster
analysis.
To reveal the partition and variation within and among the populations, analysis of
molecular variance (AMOVA) was carried out using GenALEx 6.5 software (Peakall
CHAPTER FOUR RESULTS 4.1 Measurement of grain and kernel traits
The measurement of the grain and kernel traits for the 13 rice genotypes and their mean
values are shown in Table 4.1. From the table, it can be seen that Supa, a local landrace rice genotype from Tanzania had the highest value of the grain length (10.48). This value
was significantly different from the grain length values recorded in BS 217, BS 370, ITA 310 and IR 64 (P<0.05; Table 4.1), but not significantly different from grain length values recorded in R 2793, BW 196, Saro 5, Kilombero, Red Afaa, Kahogo, IR 54 and
Wahiwahi (P>0.05; Table 4.1). On the other hand, ITA 310, an improved rice genotype from Kenya had the lowest value of the grain length (9.00). This value was significantly
different from the grain length values recorded in Kilombero, Supa and Wahiwahi
(P<0.05; Table 4.1), but not significantly different from those values reported in R 2793, BS 217, BS 370, BW 196, Saro 5, IR 64, Red Afaa, Kahogo and IR 54 (P>0.05; Table 4.1).
In terms of grain breadth, Supa, a local landrace rice genotype from Tanzania had the highest value of the grain breadth (2.14). This value was significantly different from the
grain breadth values recorded in R 2793, BS 217, BS 370, ITA 310, Saro 5 and IR 64, (P<0.05; Table 4.1), but not significantly different from grain breadth values recorded in
37
grain breadth (1.79). This value was significantly different from the grain breadth values
recorded in R 2793, BW 196, IR 64, Kilombero, Red Afaa, Kahogo, Supa, IR 54 and
Wahiwahi (P<0.05; Table 4.1), but insignificantly different from those values reported in BS 217, BS 370, and Saro 5 (P>0.05; Table 4.1).
Furthermore, it was observed that Wahiwahi, a local landrace rice genotype from Tanzania reported the highest value of grain length/breadth ratio (5.26). This value was
significantly different from the grain length/breadth ratio values recorded in IR 64, Red Afaa and Kahogo (P<0.05; Table 4.1), but insignificantly different from rest of the seven genotypes (P>0.05; Table 4.1). On the other hand, lowest value of grain length/breadth
ratio (4.60) was observed in IR 64, an improved rice genotype from Philippine. This value was significantly different from grain length/breadth ratio values reported in
Wahiwahi (P<0.05; Table 4.1), but insignificantly different from grain length/ breadth ratio values recorded in rest of the eleven genotypes (P>0.05; Table 4.1).
The Supa genotype had the highest value of the kernel length (7.78). This value was significantly different from the kernel length values recorded in R 2793, BS 217, BS 370, BW 196, ITA 310, Saro 5, IR 64, Red Afaa and Kahogo (P<0.05; Table 4.1), but insignificantly different from rest of the three rice genotypes (P>0.05; Table 4.1). On the
Wahiwahi (P<0.05; Table 4.1), but insignificantly different from rest of the nine genotypes (P>0.05; Table 4.1).
In terms of kernel breadth, Supa, a local landrace rice genotype from Tanzania had the highest value of the kernel breadth (1.90). This value was significantly different from
thekernel breadth values recorded in R 2793, BS 217, BS 370, ITA 310, Saro 5, Kilombero and Wahiwahi (P<0.05; Table 4.1), but insignificantly different from rest of the seven rice genotypes (P>0.05; Table 4.1).On the other hand, ITA 310, an improved genotype from Kenya recorded the lowest value of kernel breadth (1.60). This value was
significantly different from the kernel breadth values recorded in BW 196, IR 64, Red Afaa, Kahogo, Supa and IR 54 (P<0.05; Table 4.1), but insignificantly different from rest of the six genotypes (P>0.05; Table 4.1).
In terms of kernel length/breadth ratio, Kilombero, a local landrace rice genotype from Tanzania had the highest value of the kernel length/breadth ratio (4.45). This value was
significantly different from the kernel length/breadth ratio values recorded in R 2793, BW 196, IR 64, Red Afaa, Kahogo and IR 54 (P<0.05; Table 4.1), but insignificantly different from rest of the six rice genotypes (P>0.05; Table 4.1). On the other hand, BW 196, an improved genotype from Kenya had the lowest value of the kernel length/breadth ratio (3.68). This value was significantly different from the kernel length/breadth ratio
39
(P<0.05; Table 4.1), but insignificantly different from rest of the five rice genotypes
(P>0.05; Table 4.1).
In terms of grain weight, Supa had the highest value of the grain weight (2.91). This value was significantly different from the grain weight values recorded in BS 370, BW 196, ITA 310, IR 64 and Kilombero (P<0.05; Table 4.1), but insignificantly different from rest of the seven rice genotypes (P>0.05; Table 4.1). On the other hand, ITA 310, an improved genotype from Kenya recorded the lowest value of grain weight (1.67). This