Using Big Data Technologies for HEP Analysis
Matteo Cremonesi2, Claudio Bellini4, Bianny Bian4, Luca Canali1, Vasileios Dimakopoulos1, Peter Elmer5, Ian Fisk3, Maria Girone1, Oliver Gutsche2, Siew-Yan Hoh7, Bo Jayatilaka2, Viktor Khristenko1, Andrea Luiselli4, Andrew Melo6, Evangelos Motesnitsalis1, Dominick Olivito8, Jacopo Pazzini7, Jim Pivarski5, Alexey Svyatkovskiy5, Marco Zanetti7
1European Organization for Nuclear Research CERN, Geneva, Switzerland 2Fermi National Accelerator Laboratory, Batavia, IL, USA
3Flatiron Institute of the Simons Foundation, New York, NY, USA 4Intel Corporation, Santa Clara, USA
5Princeton University, Princeton, NJ, USA 6Vanderbilt University, Nashville, TN, USA 7University of Padova, Padova, Italy
8University of California San Diego, La Jolla, USA
E-mail: [email protected]
Abstract. The HEP community is approaching an era were the excellent performances of the particle accelerators in delivering collision at high rate will force the experiments to record a large amount of information. The growing size of the datasets could potentially become a limiting factor in the capability to produce scientific results timely and efficiently. Recently, new technologies and new approaches have been developed in industry to answer to the necessity to retrieve information as quickly as possible to analyze PB and EB datasets. Providing the scientists with these modern computing tools will lead to rethinking the principles of data analysis in HEP, making the overall scientific process faster and smoother.
In this paper, we are presenting the latest developments and the most recent results on the usage of Apache Spark for HEP analysis. The study aims at evaluating the efficiency of the application of the new tools both quantitatively, by measuring the performances, and qualitatively, focusing on the user experience. The first goal is achieved by developing a data reduction facility: working together with CERN Openlab and Intel, CMS replicates a real physics search using Spark-based technologies, with the ambition of reducing 1 PB of public data in 5 hours, collected by the CMS experiment, to 1 TB of data in a format suitable for physics analysis.
The second goal is achieved by implementing multiple physics use-cases in Apache Spark using as input preprocessed datasets derived from official CMS data and simulation. By performing different end-analyses up to the publication plots on different hardware, feasibility, usability and portability are compared to the ones of a traditional ROOT-based workflow.
1. Introduction
Particle detection is an extremely complicated process. It consists in recording the physics quantities (like energy or flight path) of the particles generated in a collision. Such quantities are measured by the interaction of the particles with the different active components of the detector used to perform the experiment. At the LHC, given the complexity of the detector design, this process involves performing almost one hundred million independent measurements. All the measurements that happen in a single collision are collectively called an event.
The event is the unit which the whole HEP analysis process is based on. Event by event, detector signals (as well as simulated signals) must be converted into the physics properties associated to the particles that produced them. Complex algorithms are applied in order to reconstruct such information. This step is computationally expensive and it is usually organized centrally by each experiment, in order to make the best use of the available resources and to best serve the need of the researchers and the priorities of the experiment. The reconstructed events are provided to the collaboration of physicists in a shared format that is the input to the final analysis.
Usually the total size of the datasets as provided by central processing is too large to allow for interactive analysis. Researchers or groups of researchers exploring similar physics questions rely on several steps of data processing, filtering unnecessary events and eliminating unnecessary quantities from the original datasets to get a manageable sub-sample. The optimization of this process is left to the individual.
In the next years the experiments at CERN will face a substantial increase in the data production rate due to a planned major upgrade of the accelerators. In order to ensure continuity in the production of high quality scientific results, the inefficiencies that are affecting the current analysis approach must be eliminated. The need to investigate alternative possibilities to perform physics analysis in a more efficient way is therefore becoming imperative.
Recently, new toolkits and systems have emerged outside of the HEP community to analyze Petabyte and Exabyte datasets in industry, collectively called ”Big Data.” These new technologies use different approaches and promise a fresh look at analysis of extremely large datasets.
In this paper, we focus on the application of Apache Spark [1] to the HEP analysis problem. We incorporate lessons learned from our previous investigations [2] as well as new tools developed to enable HEP analysis in Apache Spark. Scalability and usability studies are performed and the latest findings are presented.
2. The Traditional Analysis Workflow and Its Limitations
The traditional HEP analysis workflow is based on the usage of the ROOT framework [3], a general, experiment-independent C++ toolkit. It provides statistical tools and a serialization format to persist reconstructed and transformed objects in files.
The centrally-produced datasets are provided in ROOT format, with a file-based data representation and a class structure with branches. The data management systems do not allow to extract branches efficiently from nested ROOT files, therefore physicists set up workflows that involve several steps of data processing, each one of them staging out intermediate outputs. A first step of ntupling is performed in order to modify the information saved event by event. Immutable branches are duplicated in a disk-to-disk copy with the addition of new branches if needed, while unused ones are removed. At this stage, the information is selected to serve a smaller group of researchers performing similar physics measurements. Although the total size of the output is smaller, it is still too big to allow for interactive analysis.
numbers as columns. At this stage, the information is usually selected to serve the scope of a single analysis. The size is reduced by an order of magnitude. As a last step, quantities from the final ntuples are aggregated and plotted as histograms.
These steps require the usage of grid and batch resources to exploit parallelization. Significant burden of tedious and time-consuming manual bookkeeping and failure re-submission is put on the individual analyst or analysis groups, resulting in an inefficient job splitting, with suboptimal parallelization. The worflow is convoluted and with limited interactivity. The analysis frameworks that support such workflows are group- or analysis-specific, often hardware-specific, limiting the portability and stimulating the multiplication of individual codes with similar functionalities. The duplication of immutable branches that happens at each stage of the workflow results in significant usage of storage space, making such an approach not sustainable on the long run.
3. The Scalability Test
In a previous usability study [2] of Apache Spark, we implemented an analysis workflow by converting data into the AVRO [4] format and uploaded it to the Hadoop file system (HDFS) [5] of our development cluster. The biggest impediment to use the new technology as identified by the analysts was the need to convert the data in the new format.
To enable Apache Spark to understand the data structures of the ROOT files without the need to convert, a library called spark-root [6] was developed. It is based on a Java-only implementation of the ROOT I/O libraries which offers the ability to translate ROOT data structures into Spark DataFrames (DFs) and ResilientDistributedDatasets (RDDs).
Another library, the Hadoop-XRootD connector [7] was also developed in order to enable access to files stored in the EOS [8] disk storage system at CERN. The Hadoop-XRootD connector is a Java library that accesses files directly through the XRootD protocol [9] without the need to import/export data to HDFS.
In this paragraph, the latest results of the tests on performance, efficiency and scalability of these new tools are presented. A Spark workflow that reproduces a real physics analysis was executed on a Hadoop cluster at CERN. This infrastructure is comprised of almost 1300 cores and 7TB of RAM. The input is data collected by the CMS [10] experiment in 2011, publicly accessible and stored as ROOT files on EOS at CERN.
The tests were performed by executing the workflow for different size of the input data, in order to understand how the execution time scales with input size. As a second step, the same workflow was executed for a specific input size while scaling up the available resources (executors/cores and memory).
The tests were repeated for two different instances of the EOS storage, namely EOS Public and EOS UAT, in order to identify if the network throughput and the storage infrastructure affect the performances. The EOS UAT instance consists of six servers, used exclusively for these tests.
The results of the first round of tests were obtained fixing to 32 MB the size of the ”readAhead” buffer of the Hadoop-XRootD connector, which determines the amount of data that the connector will pre-fetch from the EOS storage service with every read call.
Table 1 and Fig. 1 show a linear dependence between the input size and the execution time. The system is able to reduce 110 TBs in 212 minutes without any significant optimization.
Table 1. The results of scalability tests for different input size, obtained with a ”readAhead” buffer of 32 MB, 804 logical cores, and 2 logical cores per Spark executor.
Input Size Execution Time
22 TB 58 min
44 TB 83 min
66 TB 149 min
88 TB 180 min
110 TB 212 min
Figure 1. Performances for different input size, obtained with a ”readAhead” buffer of 32 MB, 804 logical cores, and 2 logical cores per Spark executor.
Table 2. The results obtained scaling up the number of cores with 22 TB, with a ”readAhead” buffer of 32 MB, for the different EOS instances used in this test.
Number of Executors/Cores EOS public EOS UAT
111/222 81 min 153 min
222/444 52 min 146 min
296/592 51 min 144 min
407/814 50 min 140 min
Figure 2. Performances for different number of cores, obtained with a ”readAhead” buffer of 32 MB.
Table 3. Network throughput of EOS Public and EOS UAT access for different number of cores, obtained with a ”readAhead” buffer of 32 MB.
Cores EOS public EOS UAT
222 15GBytes/s 6GBytes/s
444 19GBytes/s 7.5GBytes/s
592 21GBytes/s 7.5GBytes/s
814 21GBytes/s 7.5GBytes/s
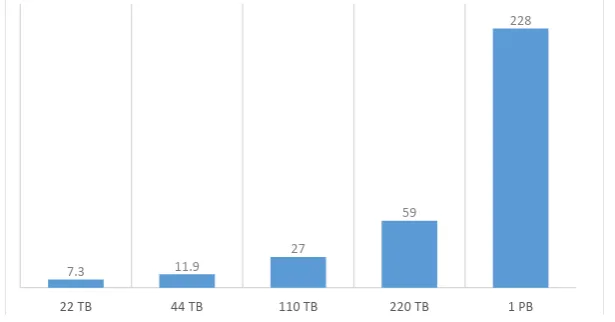
Table 4. Aggregate results from re-executing the test by scaling up the input data size on EOS publicobtained with a ”readAhead” buffer of 64 KB, 804 logical cores, and 8 logical cores per Spark executor.
Input EOS PUBLIC
22 TB 7.3 mins
44 TB 11.9 mins
110 TB 27 mins
220 TB 59 mins
1 PB 3.8 hours
Figure 3. Performance of the tests for different input size in minutes, obtained with a ”readAhead” buffer of 64 KB, 804 logical cores, and 8 logical cores per Spark executor.
Further investigations identified that the ”readAhead” parameter of the Hadoop-XRootD connector would need further tuning. After multiple executions with different parameter sizes that varied between 32 MB and 16 KB, an optimal value of 64 KB was determined for this specific workload. This choice allowed the utilization of 8 logical cores per Spark executor (compared to the 2 cores per executor used in the previous test) due to the lower memory pressure. As a result, a dramatic increase in performance was achieved, in terms of execution time and of efficiency in the utilization of the underlying resources. Such improvement can be explained by considering the specific features of the ROOT file format, that allows for read operations that fetches only the data of interest, rather than scanning the entire input ROOT file. Therefore a relatively small value of the ”readAhead” parameter optimizes the performances.
All the tests were re-executed with the new ”readAhead” buffer size for the EOS public instance. The final results are summarized in Table 4 and Fig. 3.
Table 5. Key workload metrics measured with Spark custom instrumentation for 1 PB of input, obtained with a ”readAhead” buffer that varies between 16 KB and 64 KB, 804 logical cores, and 8 logical cores per Spark executor.
Metric Total Time Spent
Total execution time 3000-3500 hours
CPU time 1200 hours
Read time 1200 - 1800 hours, depending on the ”readAhead” size
Garbage collection time 200 hours
Figure 4. Number of concurrent active tasks throughout the job execution for 1 PB of input, obtained with a ”readAhead” buffer of 64 KB, 804 logical cores, and 8 logical cores per Spark executor.
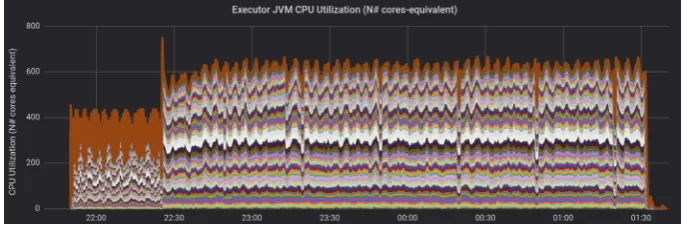
Figure 5. Executor CPU usage throughout the job execution for 1 PB of input, obtained with a ”readAhead” buffer of 64 KB, 804 logical cores, and 8 logical cores per Spark executor.
Some key metrics of the workload were measured with a custom-developed Spark library and the results are shown in Table 5.
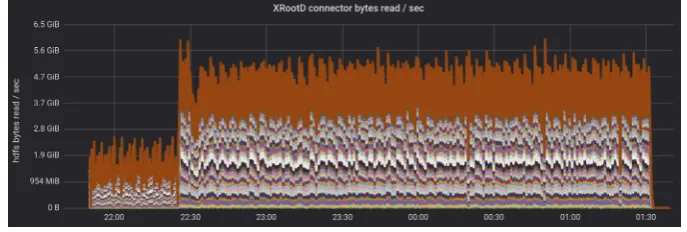
The CPU time used by tasks for processing accounts for approximately 40% of the execution time. The read time contributes to 40-50% of the total, as expected considering that the data reside in an external service. Notably, garbage collection consumes only 7-8% of the execution time.
The Fig 4 shows that the parallelization factor remained constant and close to optimal as the number of concurrent active tasks stayed at the maximum value (which equals the number of allocated cores for this job) for most of the job duration. This is a sign of both good scalability and proper usage of the underlying resources, as it is also demonstrated in Figs. 5 and 6.
4. The Usability Study
Table 5. Key workload metrics measured with Spark custom instrumentation for 1 PB of input, obtained with a ”readAhead” buffer that varies between 16 KB and 64 KB, 804 logical cores, and 8 logical cores per Spark executor.
Metric Total Time Spent
Total execution time 3000-3500 hours
CPU time 1200 hours
Read time 1200 - 1800 hours, depending on the ”readAhead” size
Garbage collection time 200 hours
Figure 4. Number of concurrent active tasks throughout the job execution for 1 PB of input, obtained with a ”readAhead” buffer of 64 KB, 804 logical cores, and 8 logical cores per Spark executor.
Figure 5. Executor CPU usage throughout the job execution for 1 PB of input, obtained with a ”readAhead” buffer of 64 KB, 804 logical cores, and 8 logical cores per Spark executor.
Some key metrics of the workload were measured with a custom-developed Spark library and the results are shown in Table 5.
The CPU time used by tasks for processing accounts for approximately 40% of the execution time. The read time contributes to 40-50% of the total, as expected considering that the data reside in an external service. Notably, garbage collection consumes only 7-8% of the execution time.
The Fig 4 shows that the parallelization factor remained constant and close to optimal as the number of concurrent active tasks stayed at the maximum value (which equals the number of allocated cores for this job) for most of the job duration. This is a sign of both good scalability and proper usage of the underlying resources, as it is also demonstrated in Figs. 5 and 6.
4. The Usability Study
The main goal of the usability test described in this section is testing the user experience, from the ability to setup and run a Spark-based analysis workflow to the portability of such workflow
Figure 6. Read throughput from Hadoop-XRootD connector throughout the job execution for 1 PB of input, obtained with a ”readAhead” buffer of 64 KB, 804 logical cores, and 8 logical cores per Spark executor.
to different use cases and, most importantly, different clusters.
To perform this test, two similar workflows were tuned to run on different clusters. First, a Spark cluster at Vanderbilt University was used. It consists of 1000 cores with 5 TB of RAM. A second cluster hosted at the University of Padova, with 40 cores and 16 GB of RAM, was also employed in this test. The two workflows shared a similar structure: load standard ROOT files as Spark DFs making use of the spark-root library, open them over XRootD with the Hadoop-XRootD connector, use Spark to transform DFs and aggregate them into histograms with the Histogrammar [11] package, produce plots and tables from the histograms.
The first step of the test consisted in verifying how easily such workflow can be set up by a newcomer. A first year undergraduate student in computer science, with no physics knowledge and limited computing knowledge, approached the issue. Starting from scratch, the student was able to learn the basic functionalities of the new tools and run the entire workflow in a day. The simplicity of the Spark workflow to be set up in a short timescale is a clear advantage when compared to the timescale that is needed for a newcomer once approaching the classical ROOT-based workflow.
The second step consisted in adapting to the Vanderbilt cluster the workflow tuned to run at the Padova cluster. The major showstopper encountered was the environment setup. This could be solved by for example developing a shared library that generalizes the site configuration. Additional improvement is also required for the packaging of the Hadoop-XRootD connector in order to make the tool more automatically deployable, avoiding manual configuration. A possible solution that has been explored would be deploying the connector through a management framework for resource sharing as Apache Mesos [12]. Both these developments are currently a work in progress.
5. Conclusions
We presented studies of executing the traditional HEP analysis workflow on Apache Spark. The efficiency of the application of the new tools has been evaluated both quantitatively, by measuring the performances, and qualitatively, focusing on the user experience. Our studies identified some bottlenecks which we managed to overpass and underlined the need to scale up the Spark infrastructure and to generalize the site configuration. The scaling behavior results are promising and overperformed the original goal of reducing 1 PB to 5 hours, accomplishing the task in less than 4 hours.
6. Acknowledgments
Fermi Research Alliance, LLC under Contract No. DE-AC02-07CH11359 with the United States Department of Energy, and by the National Science Foundation under grants ACI-1450377 and PHY-1806612, and Cooperative Agreement PHY-1120138.
References
[1] Zaharia M, Chowdhury M, Franklin M J, Shenker S and Stoica I 2010 Proceedings of the 2Nd USENIX Conference on Hot Topics in Cloud Computing HotCloud’10 (Berkeley, CA, USA: USENIX Association) pp 10–10 URLhttp://dl.acm.org/citation.cfm?id=1863103.1863113
[2] Gutsche O, Cremonesi M, Elmer P, Jayatilaka B, Kowalkowski J, Pivarski J, Sehrish S, Surez C M, Svyatkovskiy A and Tran N 2017CoRRabs/1703.04171URLhttp://arxiv.org/abs/1703.04171
[3] Brun R and Rademakers F 1997 Nuclear Instruments and Methods in Physics Research Section A 389 81 – 86 ISSN 0168-9002 new Computing Techniques in Physics Research V URL
http://www.sciencedirect.com/science/article/pii/S016890029700048X
[4] Apache avro URLhttp://avro.apache.org
[5] Shvachko K, Kuang H, Radia S and Chansler R 2010Proceedings of the 2010 IEEE 26th Symposium on Mass Storage Systems and Technologies (MSST)MSST ’10 (Washington, DC, USA: IEEE Computer Society) pp 1–10 ISBN 978-1-4244-7152-2 URLhttp://dx.doi.org/10.1109/MSST.2010.5496972
[6] Khristenko V and Pivarski J 2017 diana-hep/spark-root: v0.1.14 pre1 release URL
https://doi.org/10.5281/zenodo.1019880
[7] Motesnitsalis V hadoop-xrootd-connector URLhttps://gitlab.cern.ch/awg/hadoop-xrootd-connector
[8] Eos: Large disk storage at cern URLhttps://eos.web.cern.ch
[9] Dorigo A, Elmer P, Furano F and Hanushevsky A 2005 Xrootd- a highly scalable architecture for data access WSEAS Transactions on Computers
[10] Chatrchyan S e a (CMS Collaboration) 2008JINST 3S08004
[11] Pivarski J, Svyatkovskiy A, Schenck F and Engels B 2016 histogrammar-python: 1.0.0 URL
https://doi.org/10.5281/zenodo.61418