• No results found

Fragility curve development for assessing the seismic vulnerability of bridges in Albania

N/A
N/A
Protected

Academic year: 2020

Share "Fragility curve development for assessing the seismic vulnerability of bridges in Albania"

Copied!
10
0
0

Loading.... (view fulltext now)

Full text

(1)

ISSN 2286-4822 www.euacademic.org

Impact Factor: 3.4546 (UIF) DRJI Value: 5.9 (B+)

Fragility curve development for assessing the

seismic vulnerability of bridges in Albania

IRALDA XHAFERAJ Ph.D. Candidate Polytechnic University of Tirana Faculty of Civil Engineering, Tirana, Albania

Prof. Assoc. NERITAN SHKODRANI Polytechnic University of Tirana Faculty of Civil Engineering, Tirana, Albania

IDLIR DERVISHI Ph.D. Candidate Polytechnic University of Tirana Faculty of Civil Engineering, Tirana, Albania

Abstract:

Albania is considered a seismic region in Europe. Bridges are one of the main and the most vulnerable components of the transportation system. Therefore they should be functional before and after earthquake action. Using the fragility curve is one of the popular tool in assessing the seismic behaviour of the bridges. The fragility curves are conditional statements, which give the probability of bridge exceeding a particular damage level for a given intensity level. In this study one of the most common bridges type in Albania is assessed. This paper presents a case study of developing fragility curves for simply supported bridges for Vora viaduct. The paper illustrates the use of fragility in verifying the performance objectives of bridge’s seismic design. The sources of date needed for this analysis are: bridge design project, ground motion date, geological maps. The analytical modelling and time history analysis were done and the limit states are defined for displacement ductility of bridge’s piers and fragility curves were developing during statistical analysis.

(2)

Key words: fragility curve, seismic behaviour, transport networks, risk, bridges

Introduction

Bridge structure is the most vulnerable components of the transportation network. Many of highway bridges in Albania are in service for more than 25 years. Many of them were designed with codes without information now available on seismic safety. Seismic requirements have increased in recently codes. Serviceability and safety of bridges before and after earthquake is important to ensure the continuous transport facilities. There is therefore, a need for reliable methods for assessing the seismic vulnerability of existing bridge. Conditional probabilistic statement of bridge damage due to seismic loading, known as fragility curves have been used to evaluate seismic risk for highway bridges. Fragility functions it is conditioned on some parameter which describes the intensity of ground motions. This paper illustrates their generation in post – design as a verification tool and describes the methodology which governs the implementation of the fragility curve.

Analytical bridge fragility methodology

Analytical methods are considered most appropriate for the purpose of design verification. Analytical methods allow both probabilistic demands (D) and capacities (C) to be derived and subsequently used to generate relevant fragilities. When both the demand and capacity models follow a lognormal distribution the fragility curves takes the form of below equation:

   

 

 

Sd SC

IM C D

P ln /

(3)

where Sd - is the estimate of the median of seismic demand as

function of IM, IM - is the seismic intensity measure, SC - is the

median for the selected limit state, βd│IM - is the conditional

logarithmic standard deviation of the demand, βC - is the

logarithmic standard deviation of the limit state, Φ [ … ] is the standard normal function .

Sd = a IMb where a and b are the regression coefficients

(by Cornell [2002]), which when used in conjunction with an estimate of βd│IM referred as a probabilistic seismic demand

model (PSDM).

Case Study

Bridge description

(4)

General bridge geometry. Multi – span simply supported concrete girder bridge .

(5)

(RC) Bridge columns. Multi – span simply supported concrete girder bridge2 .

Ground Motion Suite

The ground motion suite selected for use in generating the probabilistic demand models are taken from the literature (Seismotectonic ,assessment of seismic risk of Albania 2010, tab. Page 230) for Vora. Consists of 211 recorded of ground motion , at a distance 5 to 15 km and a maximum magnitude of 7. The ground motion suite represents a range of spectral acceleration ( 1 sec) from 0.08g to 0.635g of the seismic risk with probability 10%/50 3.

Column Capacities

For this study only the columns are considered deriving the fragility of the bridge. Capacities for the column are taken from research by Berry and Eberhard. They considered two damage states for columns, which are concrete spalling and longitudinal reinforcement buckling.

Equation (2) presents the calculation of the median value for the drift capacity related to concrete spalling.

2 Railway Overpass of Vora project

(6)

L D

f A

P

L g C

spall 10 1 ' 1 6 . 1 (%)            

4 (2)

Equation (3) presents the calculation of drift ratio onset of bar buckling.

L D

f A P D d L buck C g b

eff 1 10

' 1 150 1 5 . 3 (%)                 

5

(3)

P- is the axial load

Ag – is the gross –sectional area of the columns f’C - is the concrete compressive strength

L-is the distance from the top of column to the point of contraflexure D-is the diameter of the column.

b –the coefficient of variation taken from the literature

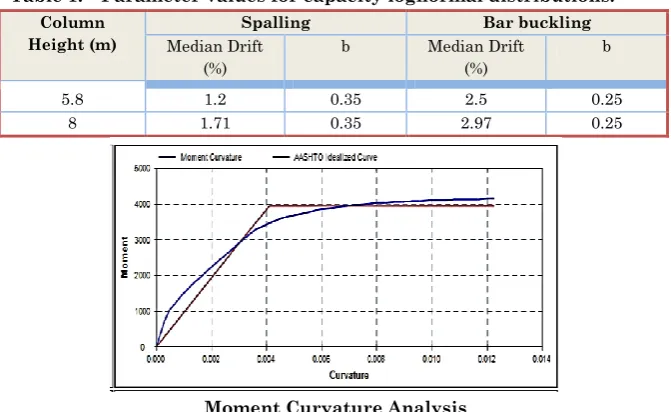
Table 1. Parameter values for capacity lognormal distributions.

Column Height (m)

Spalling Bar buckling

Median Drift (%)

b Median Drift (%)

b

5.8 1.2 0.35 2.5 0.25

8 1.71 0.35 2.97 0.25

Moment Curvature Analysis

(7)

Fragility Curves and Design Verification

The probabilities of exceedance for two damage states, spalling and bar buckling , can be calculated with the equation:

 

DS

F

DS

IM

f

IM

dIM

P

IM

IM DS

)

(

)

(4) The log-normal distribution has a probability density function .

) 2 ) ) (ln( ( 2 2

2

1

)

,

,

(

 

 

x

e

x

x

f

(5)

The cumulative log – normal distribution is obtained by integration of the area below density function as shown in the equat. (6)

dt

t

e

x

x

f

x x

 

0 ) 2 ) ) (ln( ( 2 2

2

1

)

,

,

(

 

(6)

Where x is the value at which the function is evaluated, μ is the median value of PGA and σ is the log- standard deviation.

For this case the value of μ, σ are taken as below:

σ=0.6

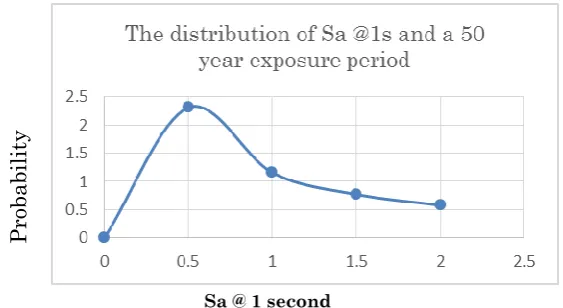
Sa @ 1 second

Figure 5. The distribution of Sa- acceleration for soil type E and a 50 year of exposure period

(8)

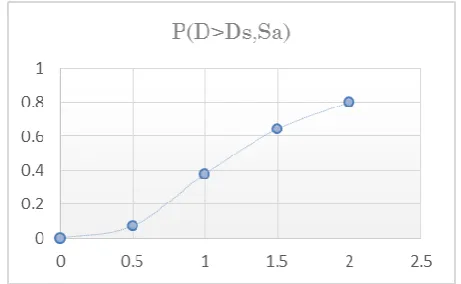
Figure 6. Fragility curve for minor - analitycal state

Figure 7. Fragility curve for moderate - analitycal state

(9)

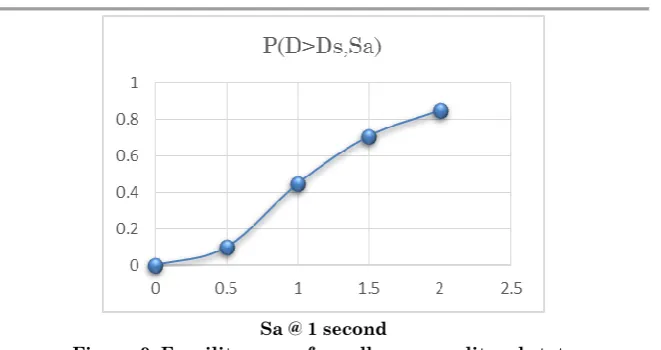
Sa @ 1 second

Figure 9. Fragility curve for collapse - analitycal state

Conclusions

The generation of fragility curve for bridges are useful in evaluation the vulnerability assessment, disaster response planning and evaluation of loss of functionality in transportation infrastructure. This study illustrates the use of fragility curves in post design verification of existing bridges and propose an probabilistic method to get on fragility curve for the pier bridge . It presents a case study for simply concrete girders bridges type in Albania. Fragility curves are generated using an analytical approach taking consideration the estimated seismic hazard for the selected site. Columns are proposed to be the most vulnerable component of the bridges structure, and their height is a very important parameter for the evaluation of damage state. Post design fragility curves are useful for verifying design assumptions against specific performance objectives.

REFERENCES

(10)

2. Sh.Aliaj, S.Kociu, B.Muco, E. Sulstarova: Seismic, Seismotectonic, and assessment of seismic risk of Albania, Tirane 2010.

3. Nielson,B. & Bowers. M: Seismic Bridge Fragilities For Post -Design verification.

4. A. Kibboua, M. Naili, F.Kehila, H. Bechtoula, Y. Mehani: Seismic vulnerability functions of existing reinforced concrete bridge piers, paper 2012.

5. 20122009/03 NEHRP Recommended Seismic Provisions 6. 6 Priestley MJN, Seible F, and Calvi GM. 1986. Seismic

Design and Retrofit of Bridges. Wiley, New York, NY, . 7. John B. Mander: Fragility curve development for

Figure

Table 1. Parameter values for capacity lognormal distributions.
Figure 5. The distribution of Sa- acceleration for soil type E and a 50 year of exposure period
Figure 6. Fragility curve for minor - analitycal state
Figure 9. Fragility curve for collapse - analitycal state

References

Related documents

The fieldwork continued in 2007-2008, notably completing the survey of sandstone and mud brick walls of the building, drawing some of the architectural sections and

We note that flow analysis attacks target the shortest path property and not the protocol used for constructing the route itself; hence, a gossip based shortest path setup protocol

Methods: The proposed reconstruction method was developed and implemented to deal with the high level of noise and artifact in the combination of reduced FOV imaging and

Previous environmental assessment reported the highest daily exposure to UVA radiation in July, which is roughly in agreement with this study [23].. However, the intensity

Ontario ’ s EMR adoption program has targeted family physicians and provides physicians subsidization for adopting an approved EMR software into their clinical practice for capture

By comparing unconditional moments from the baseline model (1983) and a model with higher wage inequality, looser borrowing constraints, and lower participation costs (2001) we

As changes in the oral mucosa may affect the absorption of fentanyl from FBSF in patients with cancer and mucositis, this study was undertaken to evaluate the absorption of

FIG 6 Candida albicans open reading frame 19.2087 encodes MYST protein Sas2, which plays a role opposite to that of Esa1 in cell growth and morphogenesis. (A) Schematic depiction of