Average Model for an Interleaved DC/DC
Boost for Fuel Cell Electrical Vehicle
M. Amari
1, F. Bacha
1, J. Ghouili
2Laboratory of Computer for Industrial Systems, ENSIT, University of TunisTunisia1
University of Moncton, Canada2
ABSTRACT:The development of electric vehicle has provided new opportunities in the area of power electronic. In
this paper, we purpose, model, and analyze an interleaved three-phase Boost converter. This converter can operate in boost mode and decrease the fuel cell ripple current. It uses only three switches to interconnect the fuel cell to the electric machine. A small signal ac equivalent circuit model of this converter is elaborated to design an appropriate controller for regulate the output voltage. The SimpowerSystem toolbox is used to simulate and validate the proposed model. The results prove the accuracy of the proposed model.
KEYWORDS: electric vehicle, fuel cell, boost converter, small signal, controller, Average model.
I. INTRODUCTION
Electric vehicle applications are a growing interest, related to the need to reduce both the polluting emissions and fuel consumption of vehicles with Internal Combustion Engines by replacing with electric propulsion [1]. Electric vehicle combine two energy sources such as battery and ultracapacitor or fuel cell and ultracapacitor. Currently, the application of the fuel cell in the electric vehicles has been the focus of many Research. The fuel cell is electrochemical energy conversion device which directly produce electricity, water and heat by processing hydrogen and oxygen [2]. It is best operated at a constant load in order to achieve peak efficiency and maximum lifespan, whereas the power required for the automobile varies substantially. However, the ultracapacitor can accommodate these dynamic power changes perfectly [3].
Fuel cell deliver current at low voltage which is, generally, not easy to exploit on electric vehicle. So the use of a power converter is required to interface the fuel cell system .The electric vehicle , as shown in figure 1, used a fuel cell as the main power source and the ultracapacitor as the auxiliary power source to assist the propulsion of the vehicle during transients and to recuperate energy during regenerative braking. In this configuration, the FC is connected to the DC bus through an unidirectional DC-DC converter, whereas the ultracapacitor is connected to the DC bus via a bidirectional DC-DC converter.
Several DC-DC converters can be used to boost the low voltage of the fuel cell to the required level. The literature in the field of power electronics, there are two topologies interfacing DC-DC converters, non-isolated interfacing as energy storage and isolated interfacing
[4].
To reduce the ripple current of the DC link , it is very important to know load changes time to time and responding to that changes is quickly is one of the essential requirement for a reliable converter products [5]. Closed control loop helps to supply a stable DC output voltage. Therefore, a good and proper model of the converter is needed [6]. The mathematical models of these converters are very important for engineers to study the system dynamic behaviour. However, the power converter models are normally time varying due to the switching action. Many researchers have studied modelling and controlling DC-DC converters [7]. The small-signal models have been widely and effectively used. Many papers are published in this field. Indeed, the paper [8] proposes the small signal averaged switch model of the buck converter with parasitic elements consideration. In the reference [9] the authors study the control method of boost and buck converter for the ultra-capacitor-fuel cell hybrid stationary power applications using small signal ac equivalent circuit model.
The section II of this paper details the topology and the operation mode of the converter. In the section III, the average model of DC-DC converter is detailed. The section IX evaluates the performance of small signal model and the controller design. The conclusion is presented in section X.
Figure 1: Block Diagram of the electric vehicle
II.TOPOLOGY AND OPERATION CONVERTER
a) Chosen topology
Figure 2 shows a topology of the DC-DC converter implanted in to the vehicle. It has a five main components: the unidirectional DC-DC converter based in four MOSFETs (T1,T2 and T3) and three diodes (D1, D2 and D4), the smoothing inductors (L1,L2 and L3), the output capacitor C0 and the fuel cell.
ch
R
0
C
0
v )
( 1 t iL
) ( 2 t iL
) ( 3 t iL )
(t
iFC
)
(t
vFC
1
L
2
L
D1
D2
D3
T1 T2
T3
Figure 2:Topology of converter
b)Operation converter
The control switching is adjusted by 3
s
T
where
T
s is the switching period. Figure 3 shows the operation converter1
s
T
3 s
T
3 2Ts s
dT
t t
t
1
C
2
C
3
C 3 )
1
( d
Ts
) 3 2
( d
Ts
Figure3:Switch waveforms of the converter
III.AVERAGEMODELOFCONVERTER
For modelling the DC-DC converter, it is assumed:
-In the conducting state, each MOSFET is equivalent to a resistor
r
T- In the conducting state, each diode is equivalent to a resistor
r
D- The resistance of each non-conducting switch is infinite.
To model the converter we choose a four state variables including capacitor voltagevo(t) and inductors current ( ()
1 t
iL , ()
2 t
iL and () 3 t
iL ). The state space representation off the system is:
u D x C y
u B x A x
. .
. . .
(1)
Where x[iL1,iL2,iL3,v0]T,uvFC and yv0
There are Three dutys cycle of operation converter, termed as
3
1
0
d
,3
2
3
1
d
and1
3
2
d
. A periods
T consists of six stages.
a) Case 1:
3 1 0d
The state of any switch and the equivalent circuit for any stage are represnted respectively in the table 1 and figure 4
Stages Interval T1 T2 T3 D1 D2 D3
Stage 1 [0,dTs] 1 0 0 0 1 1
Stage 2
] 3 ,
[dTs Ts 0 0 0 1 1 1
Stage 3
)] 3 1 ( , 3
[Ts Ts d 0 1 0 1 0 1
Stage 4
] 3 2 ), 3 1 (
[Ts d Ts 0 0 0 1 1 1
Stage 5
)] 3 2 ( , 3 2
[ Ts Ts d 0 0 1 1 1 0
Stage 6
] ), 3 2 (
[Ts d Ts 0 0 0 1 1 1
ch R 0 C 0 v ) ( 1t iL ) ( 2 t iL ) ( 3t iL ) (t iFC ) (t vFC 1 L 2 L T r D r D
r C0
i ich
ch R 0 C 0 v ) ( 1t iL ) ( 2t iL ) ( 3t iL ) (t iFC ) (t vFC 1 L 2 L D r D r D r 0 C
i ich
ch R 0 C 0 v ) ( 1t iL ) ( 2 t iL ) ( 3t iL ) (t iFC ) (t vFC 1 L 2 L D r D r T r 0 C
i ich
ch R 0 C 0 v ) ( 1t iL ) ( 2t iL ) ( 3t iL ) (t iFC ) (t vFC 1 L 2 L D r D r T r 0 C
i ich
a) Stage 1 b) Stage 2, 4 and 6
c) Stage 3 d) Stage 5
Figure 4: Equivalent circuit
Referring the equivalent circuits in Figure 4 the converter can be described by the following state-space description:
x C y u B x A x i i i . . . 1 1 1 . (2)
Where i is the stage rank. The matrix expressions are the following:
0 0 0 13 1 1 0 1 1 0 0 0 0 0 1 0 0 C R C C L L r L r L L r A ch D T D 0 0 0 15 1 0 1 1 0 0 0 1 0 0 1 0 0 C R C C L r L L r L L r A ch T D D , T L L L B B B B B B
12 13 14 15 16 1 1 1 0
11 C11C12C13C14C15C16
0 0 0 1
State space averaging techniques are employed to get a set of equations that describe the system over one switching period. We get the following expression:
11 11 12 15 13
11 ) 3(1 )
( C C B B A d A A A d A
(3)
Substituting A11,A12,A13,A15,B11and C11 in (3), we get:
0 0 0 0 1 3 3 3 3 ) ) 3 ( . ( 0 0 3 0 ) ) 3 ( . ( 0 3 0 0 ) ). 3 ( . ( C R C d C d C d L d L r d r d L d L r d r d L d L r d r d A ch D T D T D T b)Mode 2: 3 2 3 1 d
The state of any switch is indicated in the following table.
Stages Interval T1 T2 T3 D1 D2 D3
Stage 1 ] ) 3 1 ( , 0
[ d Ts 1 0 1 0 1 0
Stage 2 ] 3 , ) 3 1
[(d Ts Ts 1 0 0 0 1 1
Stage 3
] . , 3 [Ts dTs
t 1 1 0 1 0 1
Stage 4
] 3 2 ,
[dTs Ts 1 0 0 1 0 1
Stage 5 )] 3 1 ( , 3 2
[ Ts Ts d 0 1 1 1 0 0
Stage 6 ] ), 3 1 (
[Ts d Ts 1 0 0 1 1 0
The equivalent circuit for any stage is represented by the following figure:
a) stage 1
ch
R
0
C
0
v
) (
1t
iL
) (
2t
iL
) (
3 t
iL
) (t iFC
) (t vFC
1
L
2
L rD
T
r
0
C
i ich
T
r
ch
R
0
C
0
v
) (
1t
iL
) (
2t
iL
) (
3 t
iL
) (t iFC
) (t vFC
1
L
2
L rD
0
C
i ich
T
r
D
r
ch
R
0
C
0
v
) (
1t
iL
) (
2t
iL
) (
3 t
iL
) (t iFC
) (t vFC
1
L
2
L
D
r
T
r
0
C
i ich
T
r
ch
R
0
C
0
v
) (
1t
iL
) (
2 t
iL
) (
3t
iL
) (t iFC
) (t vFC
1
L
2
L
D
r
D
r
T
r
0
C
i ich
ch
R
0
C
0
v
) (
2 t
iL
) (
3t
iL
) (t iFC
) (t vFC
2
L
D
r
0
C
i ich
T
r
D
r
) (
1t
iL L1
ch
R
0
C
0
v
) (
2 t
iL
) (
3t
iL
) (t iFC
) (t vFC
2
L
D
r
T
r
0
C
i ich
T
r
e) stage 5 f) stage 6
c) stage 3 d) stage 4
b) stage 2
Figure 5: Equivalent circuit for mode 2
For any stage, the state space model can be obtained by the following equation
x C y
u B x A x
i i i
. . .
2 2 2 .
(4)
0 0 21 1 0 1 0 0 0 0 1 0 0 0 0 0 C R C L r L L r L r A ch T D T 0 0 0 22 1 1 1 0 1 0 0 1 0 0 0 0 0 C R C C L L r L L r L r A ch D D T 0 0 23 1 1 0 0 1 0 0 0 0 0 0 0 0 C R C L L r L r L r A ch D T T 0 0 0 24 1 1 0 1 1 0 0 0 0 0 1 0 0 C R C C L L r L r L L r A ch D T D 0 0 25 1 0 0 1 0 0 0 0 0 0 1 0 0 C R C L r L r L L r A ch T T D 0 0 0 26 1 0 1 1 0 0 0 1 0 0 1 0 0 C R C C L r L L r L L r A ch T D D T L L L B B B B B B
22 23 24 25 26 1 1 1 0
21 C21C22C23C24C25C26
0 0 0 1
For this mode, over one switching period, the average state space of the converter can be obtained as:
x C y u B x A x . 2 2 2 . (4) Where: 21 2 21 2 26 24 22 25 23 21
2 )( )
3 2 ( ) )( 3 1 ( C C B B A A A d A A A d A (5)
Substituting A21,A22,A23,A25,A24,A26,B21and C21 in (5), we get:
IV.SMALLSIGNALANALYSISANDCONTROLLER DESIGN
In the small signal model of the DC-DC converter, the main focus is on determining the transfer function governing the converter operation. The converter is considered a nonlinear, time-depent system, linearized through averaging method about selected operating point [10]. The variables were analysed to direct components (upper case letter) and a small ac perturbation (represented by(~).
u U u
d D d
y Y y
x X x
~ ~ ~ ~
(6)
We are interested to studied the DC –DC converter if
3 2 3
1
d
The steady state is :A2XB2U0 and YC2.A21B2U (7)
Substitution of the equation (6) into state equation (4) ,we obtained:
) ( ) )]( )(
3 2 ( ) )(
3 1
[( 21 23 25 22 24 26 2
. D d A A A D d A A A X x B U u
x
If terms with product of d,x(negligible) , the small signal components have the following equation :
x C y
u B d A A A A A A X x A x
2
2 25
24 22 25 23 21 2
. [ ( )]
(8)
Using Laplace transform:
) ( ) (
) ( ) (
) ( . )) (
( ) (
) (
2
2 1 2 26
24 22 25 23 21 1 2
s x C s y
s u B A sI s d X A A A A A A A sI s x
(9)
For obtaining transfer function of output voltage to duty cycle, the perturbation of input voltage is assumed to be zero
and therefore:
X A A A A A A A sI C s d
s y
)) (
( ] [
) (
) (
26 24 22 25 23 21 1 2
2
(10)
H(s)
0refV
d
0
V
0v
0
v
1 P
i K
K P
Figure 6: Voltage controller
V. RESULT AND DISCUSSION
The parameter of the DC-DC converter and the fuel cell as shown in the following table
Parameter Value
Fuel cell voltage VFC=24V
Fuel cell power PFC=1200W
Inductor L=1.5mH
Switching freqeuncy F=10Khz
Duty cycle D=0.64
MOSFET ON resistor rT=0.005 Ω
Load resistor Rch=4 Ω
Diode ON resistor rD=0.006Ω
Table 3:Converte parameters
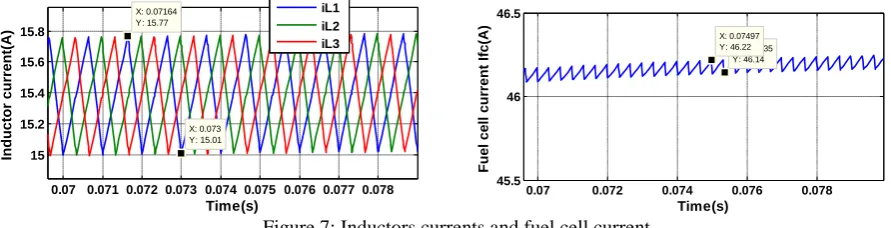
Figure 7 shows the currents flowing through the inductors (L1, L2 L3) and the fuel cell current. The shape shows that the ripple current of fuel cell its equal to 0.08A but the ripple of the inductor current is equal to 0.76A.
0.07 0.071 0.072 0.073 0.074 0.075 0.076 0.077 0.078 15
15.2 15.4 15.6 15.8
X: 0.073 Y: 15.01
Time(s)
Inductor current(A)
X: 0.07164 Y: 15.77
iL1 iL2 iL3
0.07 0.072 0.074 0.076 0.078 45.5
46 46.5
X: 0.07535 Y: 46.14
Time(s)
Fuel cell cur
rent Ifc(A)
X: 0.07497 Y: 46.22
Figure 7: Inductors currents and fuel cell current
Figure 8 gives the output voltage that its ripple is equal a 1.76V. The figure also shows the average model simulated with D=0.64 then in time 0.5 second the duty cycle change from 0.64 to 0.645.
0.07 0.072 0.074 0.076 0.078 60
62 64 66 68 70 72
X: 0.07397 Y: 65.32
Time(s)
Ou
tpu
t v
olt
age
(V) X: 0.07202
Y: 67.08
0 0.2 0.4 0.6 0.8 1
64 65 66 67 68 69
Time(s)
Output
voltag
e(V)
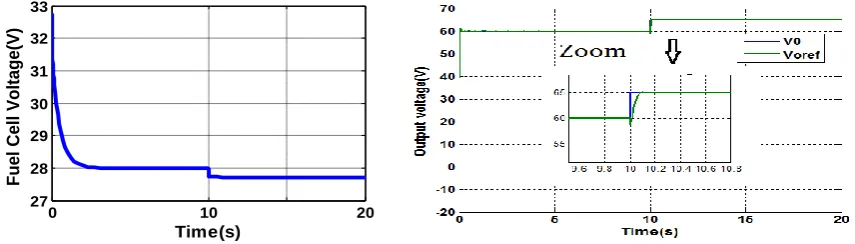
Simulation results are shown in figure 9. It can be seen that the controller can regulate voltage in the desired voltage in proper time with changing of the fuel cell voltage.
0 10 20
27 28 29 30 31 32 33
Time(s)
Fue
l Cell V
oltag
e(V)
Figure 9: Closed loop system response
VI.CONCLUSION
In this paper, the analysis has concentrated on finding the average model forinterleaved DC/DC Boost ,only taking into account the parasitic resistance of the MOSFET and diode. Simulation results for the DC-DC converter show the feasibility of the proposed model for steady-state analysis and small signal analysis and verify the derived model. A PI controller has been presented to regulate the output voltage in changing the duty cycle. error. Using both formal analysis and simulation, it has been proven that the obtained model achieves the performances such as small settling time, slight overshoot, and very low steady-state error.
REFERENCES
[1] H.S.Khaldi and A.C.Ammari ‟‟Design and Comparison of two DC/DC Converter Topologies Interfacing a Hybrid Energy Storage System to the DC Bus „‟ International Conference on Control, Engineering & Information Technology (CEIT‟14) , Tunisia 2014.
[2] S. Tsotoulidis and A. Safacas „‟ Analysis of a Drive System in a Fuel Cell and Battery powered Electric Vehicle‟‟. International Journal Of Renewable Energy Research, Vol.1, issue.3, pp.31-42 ,2011.
[3] J. Shang ,K.Kendall and B.C.Bullet „‟. Hybrid hydrogen PEM fuel cell and batteries without DC–DC converter‟‟,International Journal of Low –Carbon Technologies ,Vol.8, Issue 4, pp.1-6, 2013.
[4] A.Boucherit, A.Djerdir and M. Cirrincione ‟‟A New Topology of a Variable Output-Voltage DC-DC Converter for Fuel Cell Vehicles‟‟ Journal of Energy and Power Engineering,Vol.6, issue 11, pp.1848-1855, 2012.
[5] M. Sai Krishna Reddy* , Ch. Kalyani, M. Uthra and D. Elangovan „‟ A Small Signal Analysis of DC-DC Boost Converter‟‟, Indian Journal of Science and Technology, Vol.8, issue.2, pp.1-6, 2015.
[6] L. Mohammadian, E. Babaei and M. B.B.Sharifian.‟‟ Buck-Boost DC-DC Converter Control by Using the Extracted Model from Signal Flow Graph Method‟‟International Journal of Applied Mathematics, Electronics and Computers,vol..3, issue3, pp.155-160, 2015.
[7] M.Sarailoo ,Z.Rahmani and B. Rezaie „‟ Fuzzy Predictive Control of Step-Down DC-DC Converter Based on Hybrid System Approach‟‟ I.J. Intelligent Systems and Applications, vol.2, issue.1, pp.1-13, 2014.
[8] A.Skandarnezhad1, A.Rahmati1 , A.Abrishamifar1 and A.Kalteh‟‟ Small-Signal Transfer-Function Extraction of a Lossy Buck Converter Using ASM Technique‟‟, International Journal of Innovative Research in Electrical, Electronics, Instrumentation and Control Engineering Vol. 2, Issue .7, pp.1760-1763, 2014.
[9] W.Na,B.Gou and T.Kim „‟Analysis and control of a bidirectional DC- DC converter for an ultra-capacitor in a fuel cell generation system‟‟ ,JEE: Theory and application, vol.1, pp .72-78, 2010.
BIOGRAPHY
Ghouili Jamel received the B.ing, M.Sc.A and Ph.D degrees from the University of Québec Trois-Rivières (UQTR), Canada, in 1986, 1988, and 2004 respectively. He is currently professor and chair conversion energy center at University of Moncton, Canada. His main research interests include electric and hybrid vehicles, energy optimization, ac drives, sensorless control, wind and solar energy, fuzzy logic and neural network applications in power electronics and drives.
Mansour Amari was born in Tunisia in 1968. He obtained his Engineering Degree in Electrical Engineering in 1993 from the Higher Institute of Industries and Mines of Gafsa, Tunisia. He received the Master Degree of Research in Electrical and Industrial System and Ph.D degrees from the High School of Technical Sciences of Tunis in 2008 and 2015 respectively. Since 2002, he has been a Lecturer (Technologist) at Higher Institute of Technological Studies of Nabeul. His main research interests modeling of power electronic system and electrical vehicle.
Bacha Faouzi was born in Ben Guerdanne, Tunisia in 1964. He received “Habilitation Universities” in electrical engineering on 2008 from the National School of electric engineering (ENIT), Tunisia. He is currently a Professor at the National School of Engineers of Tunis (ENSIT) in University of Tunis, Tunisia. He has numerous publications on direct torque control of synchronous and induction machines. His research fields include modeling and simulation of electrical machines, power system and wind energy. Prof Bacha is a member of working group on Wind