Automated Detection of Diabetic Retinopathy Using
Fundus Image Analysis
Jaspreet Kaur
ECE,MMU, mullana University, ,Dr. H.P.Sinha
Abstract-Diabetic retinopathy is one of the serious eye diseases that can cause blindness and vision loss. Diabetes mellitus, a metabolic disorder, has become one of the rapidly increasing health threats both in India and worldwide. The complication of the diabetes associated to retina of the eye is diabetic retinopathy. A patient with the disease has to undergo periodic screening of eye. For the diagnosis, ophthalmologists use color retinal images of a patient acquired from digital fundus camera. The present study is aimed at developing an automatic system for the extraction of normal and abnormal features in color retinal images. Prolonged diabetes causes micro-vascular leakage and micro-vascular blockage within the retinal blood vessels. Filter based approach with morphological filters is used to segment the vessels. The morphological filter are tuned to match that part of vessel to be extracted in a green channel image. To classify the pixels into vessels and non vessels local thresholding based on gray level co-occurrence matrix is applied. The performance of the method is evaluated on two publicly available retinal databases with hand labeled ground truths. The performance of retinal vessels on drive database, sensitivity 86.39%, accompanied by specificity of 91.2%. While for STARE database proposed method sensitivity 92.15 % and specificity 84.46%. The system could assist the ophthalmologists, to detect the signs of diabetic retinopathy in the early stage, for a better treatment plan and to improve the vision related quality of life.
Keywords— Vessel segmentation, Morphological filter, Image Processing, Diabetic Retinopathy .
I. INTRODUCTION
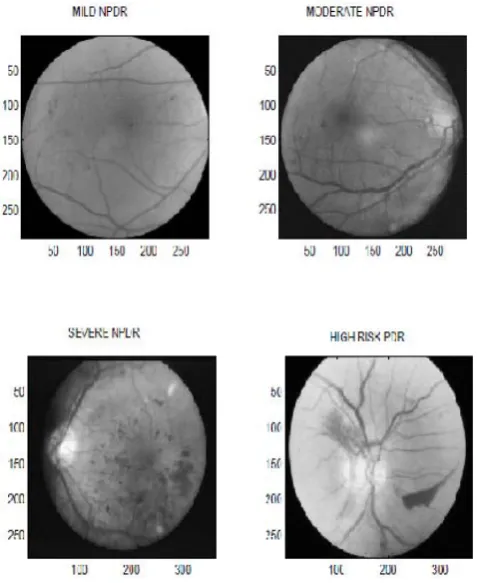
Diabetic Retinopathy (DR) is an eye disease which occurs due to diabetes. It damages the small blood vessels in the retina resulting in loss of vision. The risk of the disease increases with age and therefore, middle aged and older diabetics are prone to Diabetic Retinopathy. Retinopathy is a progressive disease, which can advance from mild stage to proliferative stage. There are three stages: (i)early stage or non-proliferate diabetic retinopathy (NPDR) or background retinopathy, (ii)maculopathy and (iii)progressive or proliferate retinopathy.
The early stage is further classified as mild NPDR and moderate to severe NPDR. In mild NPDR, signs such as microaneurysms, dot and blot hemorrhages and hard or intra-retinal exudates are seen in the retinal images. Microaneurysms are small, round and dark red dots with sharp margins and are often temporal to macula. Their size
ranges from 20 to 200 microns i.e., less than 1/12th
the diameter of an average optic disc and are first detectable signs of retinopathy. Hemorrhages are of two types: Flame and Dot-blot hemorrhages. Flame hemorrhages occur at the nerve fibers and they originate from precapillary arterioles, which located at the inner layer of the retina. Dot and blot hemorrhages are round, smaller than micro aneurysms and occur at the various levels of retina especially at the venous end of capillaries. Hard exudates are shinny, irregularly shaped and found near prominent microaneurysms or at the edges of retinal edema. In the early stage, the vision is rarely affected and the disease can be identified only by regular dilated eye examinations.
FIGURE 1: Colour fundus image showing main features of retina.
Fundus images are used for diagnosis by trained clinicians to check for any abnormalities or any change in the retina. They are captured by using special devices called ophthalmoscopes. A typical fundus image with its features marked is shown in the Figure 1. Each pixel in the fundus image consists of three values namely red, green and blue, each value being quantised to 256 levels. Diabetic Maculopathy is a stage where fluid leaks out of damaged vessels and accumulates at the center of the retina called macula (which helps in seeing the details of the vision very clearly) causing permanent loss of vision. This water logging of the macula area is called clinically significant macular oedema which can be treated by laser treatment.
Diabetic Maculopathy is a stage where fluid leaks out of damaged vessels and accumulates at the center of the retina called macula (which helps in seeing the details of the vision very clearly) causing permanent loss of vision. This water logging of the macula area is called clinically significant macular oedema which can be treated by laser treatment.
FIGURE 2: Different stages of Diabetic Retinopathy
1.1 RELATED WORK:
Sinthaniyothin [12] uses maximum variance to obtain the optic disk center and a region growing segmentation method to obtain the exudates. [11] tracks the optic disk through a pyramidal decomposition and obtains disk localization from a template-based matching that uses the Hausdorff distance measure on the binary edge image. However, the above methods will fail if exudates similar in brightnes and size to the optic disk are present. [1, 13] used blood vessel intersection property to obtain the optic disk. However, they use the whole blood vesse network which can lead to wrong or inconclusive result because of noise from the fringe blood vessels. In contrast we use only the main blood vessels, which is more robust Statistical classification techniques have been very popular lately for the problem of lesion classification. Exudates have color properties similar to the optic disk while Microaneurysms are difficult to segment due to their similarity in color and proximity with blood vessels. In order to classify detected features, typically, candidate regions are detected using color/morphological techniques and then classification is done on these regions using some classifier. Many classifiers have been tried including Fuzzy C-means
clustering [15], SVMs ([17],[22], [9]) and simple Bayesian classification [9].
STARE is a complete system for various retinal diseases [6]. The optic disk is detected using blood vessel convergence and high intensity property. In order to determine the features and classification method to be used for a given lesion, a Bayesian probabilistic system is used.
This paper focuses on the automated detection of vascular changes that are seen clearly in the moderate to severe stages of DR. These abnormalities are detected by processing retinal images using Morphological Filter. Extraction of vessels using gray level co-occurrence matrix is used for the segmentation of vessels. There are two databases DRIVE and STARE for testing the segmentation of blood vessels.
The rest of the paper is organized as follows: Section 2 detection of blood vessel extraction while section A Morphological Filter banks Section B describes the spatial filtering of vessels and section C presents the method of extraction of vessels. While in section D presents local thresholding and section 3 the results of the algorithm over an extensive dataset are presented.
II. DETECTION OF BLOOD VESS EL
There are different image-processing methods that can be used for capturing variations. Methods include image segmentation, edge or boundary detection, shape and texture analysis. The detection process can be carried out either on the original image or in the transform domain. Some of the transforms that are used in image processing are wavelet transform, Fourier transform, and discrete cosine transform (DCT). This paper utilizes morphological filter for automated detection and classification of retinal images.
A. Morphological filter:
Morphological image processing exploits features of the vasculature shape that are known a priori, such as it being piecewise linear and connected. Algorithms that extract linear shapes can be very useful for vessel segmentation. Structuring elements of a certain intensity can be added (dilation) or subtracted (erosion) to the underlying image. Opening (erosion followed by dilatation) with a structuring element of a certain shape can separate objects in an image,by preserving image structures that can contain the structural element and removing those that cannot. Closing (dilatation followed by erosion) can be used to ‘fill-in’ small holes within an image.Morphological operations play a key role in digital image processing with special application in the field of machine vision and automatic object detection. The morphological operations include dilation, erosion, opening, closing etc.
a) Dilation
of 0s and 1s. Mathematically, dilation operation can be written in terms of set notation as below
A ⊕ As = {z|(A’s)z ∩ A ≠ Φ }
Where Φ is an empty element and As is the structuring element. The dilation of A by As is the set consisting of all structuring element origin locations where the reflected and transmitted As overlaps at least some portions of A. Dilation operation is commutative and associative.
b) Erosion
Erosion shrinks or thins the objects in a binary image by the use of structuring element. The mathematical representation of erosion is as shown below.
A Θ As = {z|(As)z ∩ Ac ≠ Φ }
Erosion is performed in MATLAB using the command imerode (Image Name, SE).
c) Opening and Closing
In image processing, dilation and erosion are used most often and in various combinations. An image may be subjected to series of dilations and or erosions using the same or different SE. The combination of this two principles leads to morphological image opening and morphological image closing. Morphological opening can be described as an erosion operation followed by a dilation operation. Morphological opening of image X by Y is denoted by X O Y, which is erosion of X by Y followed by dilation of the result obtain by Y closing and opening
X οY = (X ⊕Y)ΘY
X •Y = (XΘY )⊕Y
Morphological closing can also be described as dilation operation followed by erosion operation. Morphological Closing of Image X by Y is denoted by X Y, which is dilation of X by Y followed by erosion of the result obtained by Y. Image opening and image closing and are implemented in MATLAB by the use of imopen(image name) and imclose(image name) respectively.
A. EXTRACTION OF VESSELS:
The enhanced vessel segments in the Gabor filter response image, an effective thresholding scheme is required. The entropy based thresholding using gray level co-occurrence matrix is employed. It computes optimal threshold by taking into account the spatial distribution of gray levels that are embedded in the co-occurrence matrix. The GLCM contains information on the distribution of gray level frequency and edge information, as it is very useful in finding the threshold value. The gray level co-occurrence matrix is a L×L square matrix of the gray scale image I of spatial dimension M×N with gray levels in the range [0, 1. . . L-1]. It is denoted by T = [ti,j ]L×L matrix. The elements of the matrix specify the number of transitions between all pairs of gray levels in a particular way. For each image
pixel at spatial co-ordinate (m, n) with its gray level specified by f(m ,n), it considers its nearest four neighbouring pixels at locations of (m+1, n), (m-1, n), (m, n + 1) and (m, n - 1). The co-occurrence matrix is formed by comparing gray level changes of f(m, n) to its corresponding gray levels, f(m +1, n), f(m -1, n), f(m, n + 1)
and f(m, n - 1). Depending upon the ways in which the gray level i follows gray level j, different definitions of co-occurrence matrix are possible. The co-co-occurrence matrix by considering horizontally right and vertically lower transitions is given by
Where,
the total number of transitions in the co-occurrence matrix, a desired transition probability from gray level i to gray level j is obtained as follows
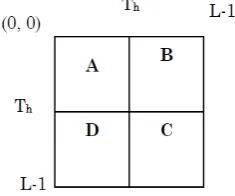
FIGURE 4: Gray level co-occurrence matrix.
B. LOCAL THRESHOLDING:
Based on the gray level variation within or between
object and background, the gray level co-occurrence matrix is divided into quadrants. Let Th be the threshold within the
range 0≤ Th≤ L-1 that partitions the gray level
co-occurrence matrix into four quadrants, namely A, B, C and D.
quadrant A represents gray level transition within the object while quadrant C represents gray level transition within the background. The gray level transition between the object and the background or across the object’s boundary is placed in quadrant B and quadrant D. These four regions can be further grouped into two classes, referred to as local quadrant and joint quadrant. Local quadrant is referred to quadrant A and C as the gray level transition that arises within the object or the background of the image. Then quadrant B and D is referred as joint quadrant because the gray level transition occurs between the object and the background of the image.
The local entropic threshold is calculated considering only quadrants A and C. The probabilities of object class and background class are defined as
the normalized probabilities of the object class and background class are functions of threshold vector (Th, Th) are defined as
The second-order entropy of the object is given by
the local transition entropy A denoted by HA(TH
). Similarly, the second-order entropy of the background is given by
up the local transition entropies, the total second-order local entropy of the object and the background is given by
Finally, TEthe gray level corresponding to the maximum of
HT(Th) over Th gives the optimal threshold for value
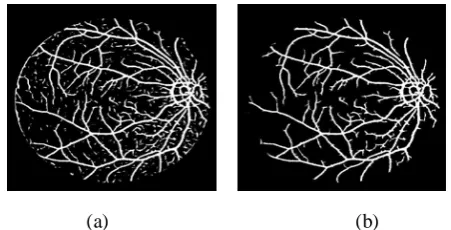
It can be seen that there exists small unconnected pixels in the thresholded image. These isolated pixels are removed by performing length filtering based on connected pixel labeling. The result of removing these unconnected pixels can be seen in the final segmented image. To ensure that
only the section of the image containing data is considered during image processing and analysis, a mask image is generated for each image. It is applied to remove any artifacts present outside the region of interest.
(a) (b)
FIGURE 6: Segmented vessels; (a) Thresholded response image; (b) Final segmented image after removing unconnected pixels.
III. RES ULT
The retinal images from the DRIVE database and STARE database are used for evaluating the performance of the vessel segmentation method. The manually segmented vessels provided in both the databases are used as gold standard. Figure and Figure illustrates the result of vessel segmentation on one of the images in each database. The entire process of segmenting vessels was performed on Intel PC with 1.66 GHz CPU and 512MB memory using Matlab 7.10. The processing of each image including convolution and thresholding took about 30 seconds.
Morphologic filtering is used to enhance the multi-oriented vessels. For each of the images a corresponding manually segmented image is provided. It is binary image with pixels that are determined to be part of a blood vessel by a human observer under the instruction of an ophthalmologist are coloured white. Quantitative evaluation of the segmentation algorithm is done by comparing the output image with the corresponding manually segmented image. The comparison yields statistical measures that can be summarized using contingency table, as shown in Table. True positives are pixels marked as vessel in both the segmentation given by a method and the manual segmentation used as ground truth. False positives are pixels marked as vessel by the method, but that are actually negatives in the ground truth. True negatives are pixels marked as background in both images. And false negatives are pixels marked as background by the method, but actually are vessel pixels
From these sensitivity and specificity are evaluated. Sensitivity gives the percentage of pixels correctly classified as vessels by the method and specificity gives the percentage of non-vessels pixels classified as non-vessels by the method as follows
where Tp is true positive, Tn is true negative, Fp is false positive and Fn
Method
is false negative at each pixel. The method is compared with the matched filter based method of [14]using the DRIVE database. Table shows that Morphological filter is better in classifications of vessels with less false positive fraction rate.
Senstivity(%) Specificity(%) Proposed method 86.39 91.28
Gabor filter 85.47 90
Matched filter 83.79 89.59
TABLE 2 : Performance of retinal blood vessels segmentation method on DRIVE database
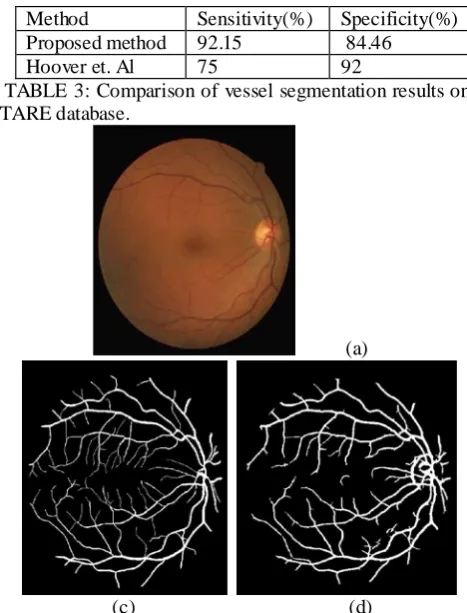
The results of the proposed method are also compared with those on twenty images from the STARE database and the result is depicted in Table. Here also the proposed method performs better with lower specificity even in the presence of lesions in the abnormal images
Method Sensitivity(%) Specificity(%) Proposed method 92.15 84.46 Hoover et. Al 75 92
TABLE 3: Comparison of vessel segmentation results on STARE database.
(a)
(c) (d)
FIGURE 8: Result of vessel segmentation on image from DRIVE database; (a) Input image;; (b) Manual segmentation by expert; (c) Automatic Segmentation by the method
(a)
(b) (c)
FIGURE 9: Result of vessel segmentation on image from STARE database; (a) Input image; (b)Manual segmentation by expert; (c)Automatic Segmentation by the method.
IV. SUMMARY AND CONCLUS IONS
A general introduction of the potential and challenges of retinal image analysis was presented. With digital retinal imaging playing an increasingly prominent role in the diagnosis and treatment of eye diseases, the problem of extracting clinically useful information has become important. For example, retinal vasculature help to define the character and extent of diseases like diabetic retinopathy and glaucoma, aiding diagnosis and treatment. Therefore, segmentation of these features becomes a key challenge for proper analysis, visualization and quantitative comparison. This has been the main focus of this dissertation, i.e., segmentation of normal and abnormal features in colour retinal images. It provided a review of common segmentation algorithms for retinal image features. From both number and diversity of algorithms used for retinopathy detection it was clear that there is no gold standard which solves entire problem.
The segmentation of blood vessels in color retinal images using Morphological filters. It was found that the appearance of vessels is highly sensitive in the gray scale image containing only the wavelength of green. Therefore, for segmentation of vessels was performed using only green channel of RGB color image. Morphological filter, whose application in the field of machine vision and automatic object detection, were explored to detect and enhance vessel features in retinal image. When compared with the matched filter and gabor filter for detecting line like features, morphological filter provided a better result.. The morphological operations include dilation, erosion, opening, and closing. Dilation is a process that thickens objects in a binary image, Erosion shrinks or thins the objects in a binary image by the use of structuring element. Values of all the filter parameter were selected based on the properties of vessels. Increasing the number of filter banks did not result in significant improvement of result but increased the time consuming convolution operation. The resulted enhanced vessels were then subjected to thresholding for vessel pixel classification. Entropic threshold calculation based on gray level co-occurrence matrix as it contained information on the distribution of gray level frequency and edge information have been presented. Two publicly available databases were used to evaluate the performance of the method and also to compare it with the matched filter and gabor filter methods. It was found that for DRIVE database the method provided sensitivity of 86.39% and 91.28% specificity. And for the STARE database 92.15% sensitivity and 84.46% specificity were achieved. It was found that the number of miss classified pixels was less compared to matched filter methods using the same database.
V. REFERENC ES
1. K. A kita and H. Kuga. A co mputer method of understanding ocular fundus images. Pattern Recognition, 15(6):431–443, 1982.
2. Fra me A., Mc Cree M., Olson J., Mc Hardy K., Sharp P., and Forrester J.V., ―Structural analysis of retinal vessels‖, Proceedings of the 6th International Conference on Image Processing and its Applications, vol. 2, pp. 824–827, 1996.
3. Chaudhuri S., Chatterjee S., Kat z N., Nelson M., and Go ldbaum M. ―Detection of blood vessels in retinal images using two dimensional matched filters‖, IEEE transactions on Medical Imaging, vol. 8, no. 3, pp. 263– 269. 1989.
4. J.L.Co mpany, “ Grad ing diabetic retinopathy from stereoscopic color fundus photographs - an e xtension of the modified airlie house classification,” ETDRS Report No. 10, Ophthalmology, the Journal
of the American Academy of Ophthalmology, vol. 98, no. 5, p. 78,
May 1991
5. K. J. Frank and J. P. Diec kert, “ Clin ical review of d iabetic eye disease:A primary care perspective,” Southern Medical Journal, vol. 89, no. 5,pp. 463–470, May 1996.
6. M. Go ldbaum, S. Moezzi, A. Taylor, S. Chatterjee , J. Boyd, E. Hunter, and R. Ja in. Automated diagnosis and image understanding with object e xtraction, object classificat ion, and infe rencing in retina l images. International Conference on ImageProcessing, 3:695–698, Sept. 1996
7. R. Kle in, “ Diabetic retinopathy,” Public Health, vol. 17, pp. 137– 158,May 1996.
8.J. G.O´Shea and D. A. Infe ld, “ Screening and mon itoring diabetic retinopathy,” Birmingham and Midland Eye Centre, 1999
9.H. Wang, W. Hsu, G. K. G., and L. M. L. An effective approach to detect lesions in color ret inal images. In In Proc. Conf.Comp. Vision Pattern Rec., pages II: 181–186, 2000.
10. Chen J., Sato Y., and Tamura S., ―Orientation space filtering for mu ltip le orientation line segmentation‖, IEEE Transactions of Pattern
Analysis and Machine Intelligence, vol.22, pp.417-429, 2000.
11. L. Gagnon, M. Lalonde, M . Beau lieu, and M.-C. Boucher. Procedure to detect anatomical structures in optical fundus images. In
Proc. SPIE Medical Imaging: Image Processing, pages 1218–1225,
2001.
12. C. Sinthanayothin, J. F. Boyce, T. H. Willia mson, H. L. Cook, E. Mensah, S. La l, and D. Usher. Automated detection of diabetic retinopathy on digital fundus images. DiabeticMedicine, 19:105–112, 2002.
13. Hoover and M. Gold Baum. Locating the optic nerve in retina l image using the fuzzy convergence of the blood vessels. IEEE Trans. on
Medical Imaging, 22:951–958, Aug. 2003
14. Chanwimaluang T., and Fan G., ―An efficient algorithm for e xtraction of anatomical structures in retina l images‖, Proceedings of
International Conference on Image Processing, vol. 1, pp. 1093-1096,
2003.
15. A. Osareh. Automated Identification of Diabetic Retinal Exudates and the Optic Disc. PhD thesis, Univ. of Bristol, Jan.2004.
16. Bone H., Steel C., and Steel D., ―Screening for diabetic retinopathy‖,
Optometry, vol. 6, no. 10, pp. 40-43, 2004.
17. X. Zhang and O. Chutatape. Top-down and bottom-up strategies in lesion detection of background diabetic retinopathy. In n Proc. Conf.
Comp. Vision Pattern Rec., pages 422–428, 2005
18. Chang C. I., Du Y., Wang J., Guo S. M., and Thouin P. D., ―Survey and comparative analysis of entropy and relative entropy thresholding techniques‖, IEEE Proceedings of Vision, Image and Signal Processing, vol. 153, no. 6, pp. 837-850, 2006.
19. Al-Rawi M., Qutaishat M., and Arrar M., ―An improved matched filter fo r blood vessel detection of digital ret inal images‖, Computers in Biology & Medicine, vol. 37, no. 2, pp. 262-267, 2007.
20. Sopharak, K. Thet Nwe, Y. A. Moe, M. N. Da iley, and B. Uyyanonvara. Automatic e xudate detection with a na ïve bayes classifier. In International Conference on Embedded Systems and
Intelligent Technology (ICESIT), pages 139–142, Feb. 2008.
21. Dougherty G., Johson M. J., and Wiers M., ―Measurement of retinal vascular tortuosity and its application to retina l pathologies‖, Journal of Medical & Biological Engineering & Computing, vol. 48, no. 1, pp. 87-95, 2010.
22. N. J. Lingel, “ Care of the patient with diabetic retinopathy,”
Pacific On-Line Optometry Education.
![6,6′ Dimethoxy 2,2′ [4,5 dimethyl o phenylenebis(nitrilomethylidyne)]diphenol monohydrate](data:image/gif;base64,R0lGODlhAQABAIAAAP///wAAACH5BAEAAAAALAAAAAABAAEAAAICRAEAOw==)