Software Reliability, Metrics, Reliability Improvement Using
Agile Process
Gurpreet Kaur
1, Kailash Bahl
2PG student in CSE at PIET
Faculty in CSE at PIET
Abstract:
The objective of this research paper is to study about the software reliability metrics. Reliability is one of the important aspects of any software that cannot be ignored and hard to measure. According to ANSI, “Software Reliability is defined as the probability of failure-free software operation for a specified period of time in a specified environment”. Software Reliability is different from Hardware reliability. Achieving Software reliability is hard because the complexity of software tends to be high. Software Reliability can be categorized into 3 parts: modelling, measurement & improvement. Various approaches can be used to improve the reliability of the software, however, it is hard to balance development time and budget with software reliability. But the best approach to assure software reliability is to develop a high quality software through all of the stages of software life cycle. In this research paper we will discuss about software reliability metrics. Metrics used early can aid in detection and correction of requirement faults that will lead to prevention of errors later in the software life cycle. This article provides an overview of Software Reliability measurement techniques.Keywords
Software, Software Reliability, Reliability Metrics.
1.
INTRODUCTION
Today generally systems are software based systems. The objective of the system is to satisfy the users of the system. Software cannot be seen or touched, but it is essential to the successful use of computers. It is necessary that the reliability of software should be measured and evaluated. It has become a crucial part of many aspects of society: home appliances, telecommunications, automobiles, airplanes, shopping, auditing, web teaching, personal entertainment, and so on.
Software Reliability is the key task for achieving the high reliability of any software industry. It applies the attributes that are helpful for achieving the reliability and it focus on metrics.IEEE defines reliability as "The ability of a system or component to perform its required functions under stated conditions for a specified period of time”.
Software reliability is comprised of three activities:
1. Error prevention
2. Fault detection and removal.
3. Measurements to maximize reliability, specifically measures that support the first two activities
There has been extensive work in measuring reliability using mean time between failure and mean time to failure metrics. Software Reliability is an important factor that effects system reliability. It differs from hardware reliability as it reflects the design perfection, not manufacturing perfection. This paper tries to give general idea for software reliability and the metrics used to measure the software reliability. The goal of measuring the software reliability is to improve possible software error during the design process prior to releasing the software to public. So this paper also focuses on reliability measurement techniques so that reliability of software will be improved.
2.
SOFTWARE RELIABILITY
Reliability may be defined as the probability of an item to perform a required function under stated conditions for a specified period of time. Software Reliability is defined as the probability of the failure free software operation for a specified period of time in a specified environment. Unreliability of any product comes due to the failures or presence of faults in the system. The unreliability of software is primarily due to bugs or design faults in the software. It occurs only when system is in use and are not preceded by warnings.
3.
SOFTWARE RELIABILITY V/S
HARDWARE RELIABILITY
Software Reliability is defined as the probabilistic function &comes with the notion of time but as compared to the hardware reliability it is not the direct function of time. Software will not change over time until it is intentionally changed or upgraded by the programmer. Electronic and mechanical parts may become "old" and wear out with time and usage, but software will not rust or wear-out during its life cycle.
3.1 BATHTUB CURVE FOR
HARDWARE RELIABILITY &
SOFTWARE RELIABILITY
due to errors, ambiguities or misinterpretation of the specification that the software is supposed to satisfy, carelessness or incompetence in writing code, inadequate testing, incorrect or unexpected usage of software or other unforeseen problems Over time, hardware exhibits the failure characteristics as shown in Figure Known as bathtub curve.
“Figure 1” Bathtub curve for hardware Reliability
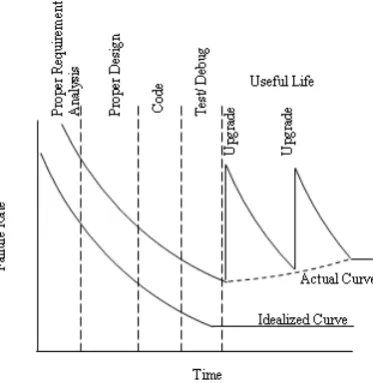
“Figure 2” Software Reliability curve
There are two major differences between hardware and software curves.
1) One difference is that in the last phase, software does not have an increasing failure rate as hardware does. In this phase, software is approaching obsolescence; there are no motivation for any upgrades or changes to the software. Therefore, the failure rate will not change.
2) The second difference is that in the useful-life phase, software will experience a drastic increase in
failure rate each time an upgrade is made. The failure rate levels off gradually, partly because of the defects found and fixed after the upgrades.
Since the reliability of software keep on decreasing with increase in software complexity, a possible curve is shown in Figure 3.
“Figure 3”
4.
BASIC RELIABILITY METRICS
Reliability metrics are used to quantitatively express the reliability of the software product. The choice of which metric is to be used depends upon the type of system to which it applies & the requirements of the application domain.Measuring the software reliability is a difficult problem because we don't have a good understanding about the nature of software. It is difficult to find a suitable way to measure software reliability, and most of the aspects related to software reliability. Even the software sizes have no uniform definition. If we cannot measure the reliability directly, something can be measured that reflects the characteristics related to reliability.
Some reliability metrics which can be used to quantify the reliability of the software product are discussed below:-
4.1 MEAN TIME TO FAILURE (MTTF)
MTTF is defined as the time interval between the successive failures. An MTTF of 200 means that one failure can be expected every 200 time units. The time units are totally dependent on the system & it can even be specified in the number of transactions. MTTF is relevant for systems with long transactions. For example, it is suitable for computer-aided design systems where a designer will work on a design for several hours as well as for Word-processor systems.4.2 MEAN TIME BETWEEN FAILURE
(MTBF)
We can combine MTTF &MTTR metrics to get the MTBF metric.
Thus, an MTBF of 300 indicates that once the failure occurs, the next failure is expected to occur only after 300 hours. In this case the time measurements are real time & not the execution time as in MTTF.
4.3 RATE OF OCCURRENCE OF
FAILURE (ROCOF)
It is the number of failures occurring in unit time interval.The number of unexpected events over a particular time of operation. ROCOF is the frequency of occurrence with which unexpected behavior is likely to occur. An ROCOF of 0.02 means that two failures are likely to occur in each 100 operational time unit steps. It is also called failure intensity metric.
4.4 MEAN TIME TO REPAIR (MTTR)
Once the failure occur sometime is required to fix the error. MTTR measures the average time it takes to track the errors causing the failure & to fix them.4.5 PROBABILITY OF FAILURE ON
DEMAND (POFOD)
POFOD is defined as the probability that the system will fail when a service is requested. It is the number of system failures given a number of systems inputs.
POFOD is the likelihood that the system will fail when a service request is made. A POFOD of 0.1 means that one out of a ten service requests may result in failure.
POFOD is an important measure for safety critical systems. POFOD is appropriate for protection systems where services are demanded occasionally.
4.6 AVAILABILITY (AVAIL)
Availability is the probability that the system is available for use at a given time. It takes into account the repair time & the restart time for the system. An availability of 0.995 means that in every 1000 time units, the system is likely to be available for 995 of these. The percentage of time that a system is available for use, taking into account plannedand unplanned downtime. If a system is down an average of four hours out of 100 hours of operation, its AVAIL is 96%.
5 SOFTWARE RELIABILITY
MEASUREMENT TECHNIQUES
Reliability metrics are used to quantitatively express the reliability of the software product. The choice of which metric is to be used depends upon the type of system to which it applies & the requirements of the application domain.
Measuring the software reliability is a difficult problem because we don't have a good understandingabout the nature of software. It is difficult to find a suitable way to measure software reliability, and most of the aspects related to software reliability. Even the software sizes have no uniform definition. If we cannot measure the reliability directly, something can be measured that reflects the characteristics related to reliability.
Some reliability metrics which can be used to quantify the reliability of the software product are discussed below:-
Fig 1: Software Quality Improvement Factors
5.1 PRODUCT METRICS
Product metrics are those which are used to build the artifacts i.e. requirement specification documents, system design documents etc. These metrics help in assessment if the product is good enough through reports on attributes like usability, reliability, maintainability & portability. In this measurements are taken from the actual body of the source code.
• Software size is thought to be reflective of complexity, development effort and reliability. Lines of Code (LOC), or LOC in thousands (KLOC), is an intuitive initial approach to measuring software size. The basis of LOC is that program length can be used as a predictor of program characteristics such as effort &ease of maintenance. It is a measure of the functional complexity of the program and is independent of the programming language.
• Function point metric is a method to measure the functionality of a proposed software development based on the count of inputs, outputs, master files, inquires, and interfaces.
• Test coverage metric estimate fault and reliability by performing tests on software products, assuming that software reliability is a function of the portion of software that is successfully verified or tested.
• Complexity is directly related to software reliability, so representing complexity is important. Complexity-oriented metrics is a method of determining the complexity of a program's control structure, by simplifying the code into a graphical representation. Representative metric is McCabe's Complexity Metric.
efficiency (DRE). DRE provides a measure of quality because of various quality assurance and control activities applied throughout the development process.
5.2 PROJECT MANAGEMENT
METRICS
Project metrics describe the project characteristics and execution. If there is good management of project by the programmer then this help us to achieve better products. Relationship exists between the development process and the ability to complete projects on time and within the desired quality objectives. Cost increase when developers use inadequate processes. Higher reliability can be achieved by using better development process, risk management process, configuration management process. These metrics tells about:-
• Number of software developers
• Staffing pattern over the life-cycle of the software
• Cost and schedule
• Productivity
5.3 PROCESS METRICS
Process metrics quantify useful attributes of the software development process & its environment. They tell if the process is functioning optimally as they report on attributes like cycle time & rework time. The goal of process metric is to do the right job on first time through the process. The quality of the product is a direct function of the process. So process metrics can be used to estimate, monitor and improve the reliability and quality of software. Process metrics describe the effectiveness and quality of the processes that produce the software product. Examples are:
• Effort required in the process
• Time to produce the product
• Effectiveness of defect removal during development
• Number of defects found during testing
• Maturity of the process
5.4 FAULT & FAILURE METRICS
A fault is a defect in a program which arises when programmer makes an error and causes failure when executed under particular conditions. These metrics are used to determine the failure-free execution software.
To achieve this goal, number of faults found during testing and the failures or other problems which are reported by the user after delivery are collected, summarized and analyzed.. Failure metrics are based upon customer information regarding failures found after release of the software. The failure data collected is therefore used to calculate failure
density, Mean Time Between Failures (MTBF) or other parameters to measure or predict software reliability.
6 SOFTWARE METRICS FOR
RELIABILITY
The Metrics are used to improve the reliability of the system by identifying the areas of requirements. The different types of software metrics that are used are:-
6.1
REQUIREMENT RELIABILITY
METRIC
Requirements indicate what features the software must contain. It specify the functionality that must be included in the software.The requirements must be written such that is no misunderstanding between the developer & the client. The requirements must contain valid structure to avoid the loss of valuable information. The requirements should be thorough and in a detailed manner so that it is easy for the design phase. The requirements should not contain inadequate information. Requirement Reliability metrics evaluates the above said quality factors of the required document.
6.2 DESIGN & CODE RELIABILITY
METRIC
The quality factors that exists in design and coding plan are complexity, size and modularity. Complex modules are difficult to understand & there is high probability of occurring errors. The reliability will decrease if modules have a combination of high complexity and large size or high complexity and small size. These metrics are also applicable to object oriented code, but in this, additional metrics are required to evaluate the quality.
6.3 TESTING RELIABILITY METRIC
These metrics use two approaches to evaluate the reliability. First it ensures that the system is equipped with the functions that are specified in the requirements. Because of this, the errors due to the lack of functionality decreases.Second approach is evaluating the code, finding the errors & fixing them. To ensure that the system contains the functionality specified, test plans are written that contain multiple test cases. Each test case is based on one system state and tests some functions that are based on a related set of requirements The objective of an effective verification program is to ensure that every requirement is tested, the implication being that if the system passes the test, the requirement’s functionality in included in the delivered system.
7 CONCLUSION
These metrics measures software reliability in requirements, design and coding, and testing phases. The scope of this paper is the measurement knowledge and metrics that are necessary to ensure the reliability of software agile process. So, using various software measurement techniques mentioned in this paper we can remove any error or fault from the software process, thus improving the reliability of the software product.
[17]Musa, John, Anthony Iannino & Kazuhira Okumoto, Software Reliability McGraw-Hill, 1987.
[18] H. Pham, Software Reliability, Springer, Singapore,2000.
REFERENCES
[1] Michael R. Lyu, “Software Reliability Engineering: A Roadmap”.
[2] Jiantao Pan, “Software Reliability”, 18-849b Dependable Embedded Systems, CMU, 1999.
[3] Musa, Iannino and Okumoto, “Software Reliability Engineering: Measurement, Prediction, Application.”, Mc Graw Hill, 1987.
[4] Michael R. Lyu , “Handbook of Software Reliability Engineering.” McGraw-Hill publishing, 1995, ISBN 0-07-039400-8.
[5] Goutam Kumar Saha, “Software Reliability Issues: Concept Map”, IEEE Reliability Society 2009 Annual Technology Report
[6] Pardeep Ramachandran , Sarita Adve, Pradip Bose, Jude Rivers and Jayanth Srinivasan “ Metrics for lifetime reliability “ August 2006.
[7] Vinay Tiwari1, Dr. R.K. Pandey2 International Journal of Advanced Research in Computer and Communication Engineering Vol. 1,Issue 10, December 2012 “open source software and reliability metrics”.
[8] Nasib Singh Gill “Software engineering: software reliability , testing and quality assurance.
[9] Ritika Wasen , P. Ahemed, M. Qasim Rafiq “New papadigm for software reliability estimation “ Volume 44, No. 14, April 2012.
[10]John C.Munson, Taghi M.Khashgoftear “Software metrics for reliability assessment.
[11]Aasia Quyoum, Mehraj – Ud - Din Dar, M. K. Quadri Di. “Improving Software Reliability using Software Engineering Approach- A Review”, International Journal of Computer Applications (0975 – 8887)Volume 10– No.5, November 2010.
[12]E Eduardo Valido-Cabrera, “Software reliability methods”, Technical University of Madrid August, 2006.
[13]ANSI / IEEE , “Standard Glossary Of Software Engineering Terminology”.
[14]Vasilescu, B., Serebrenik, A., van den Brand, M. (2011). By No Means: A Study on Aggregating Software Metrics. WETSoM’11(May 24, 2011), Waikiki, Honolulu, HI USA.
[15]Mair, C., Shepperd, M. (2011) Human Judgement and Software Metrics: Vision for the Future. WETSoM’11
(May 24, 2011), Waikiki, Honolulu, HI USA.