1
Supplementary Information
Sterepinic acids A–C, new carboxylic acids produced by a
marine alga-derived Fungus
Takeshi Yamada
1,*
Miwa Matsuda
1, Mayuko Seki, Megumi Hirose, and Takashi Kikuchi
1Structures of metabolites in the fungal strain
2
Table S1 Spectral data including 2D NMR data for 1
3
Table S2 Spectral data including 2D NMR data for 2
4
Table S3 Spectral data including 2D NMR data for 3
5
Table S4 Spectral data including 2D NMR data for 4
6
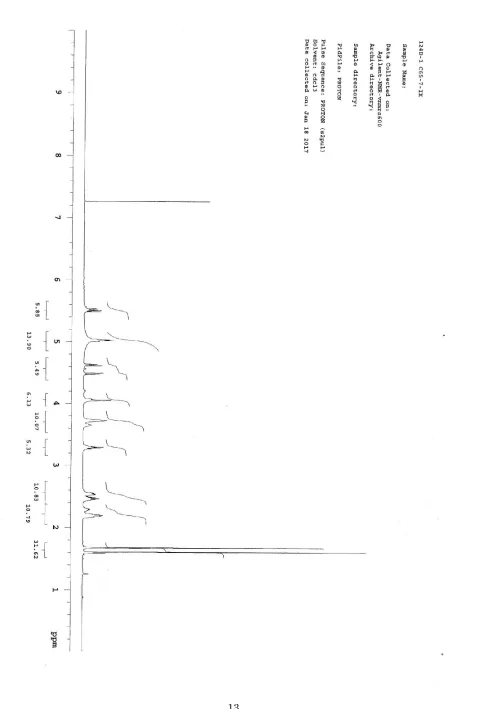
Figure S1
1H NMR spectrum of 1 in CDCl
37
Figure S2
13C NMR spectrum of 1 in CDCl
38
Figure S3
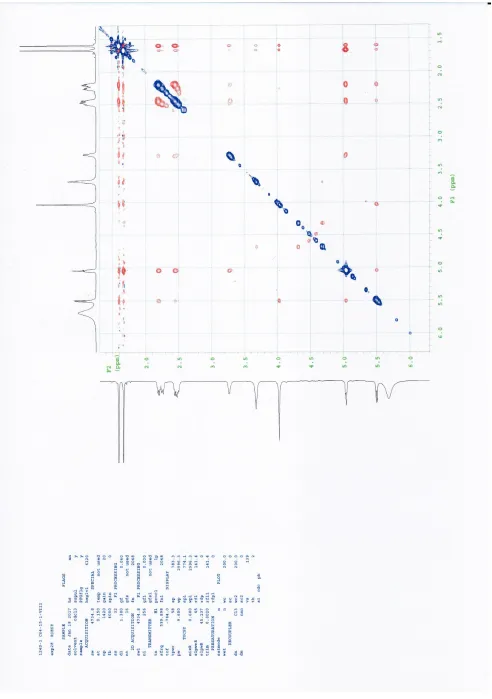
1H-
1H COSY of 1
9
Figure S4 NOESY of 1
10
Figure S5 HMQC of 1
11
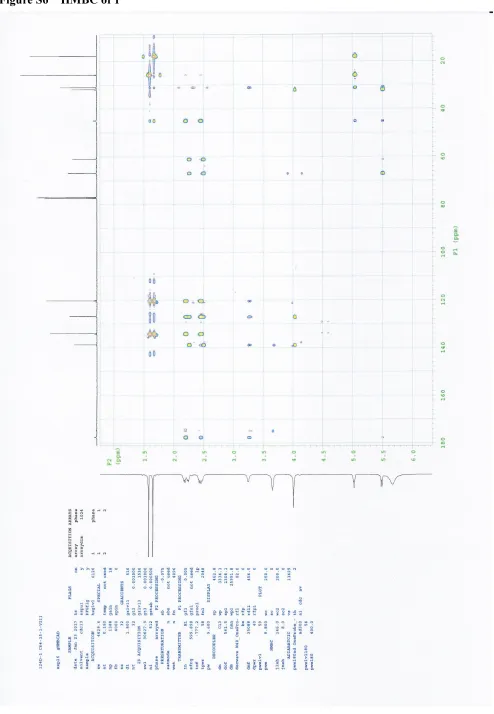
Figure S6 HMBC of 1
12
Figure S7
1H NMR spectrum of 2 in CDCl
313
Figure S8
13C NMR spectrum of 2 in CDCl
314
Figure S9
1H-
1H COSY of 2
15
Figure S10 NOESY of 2
16
Figure S11 HMQC of 2
17
Figure S12 HMBC of 2
18
Figure S13
1H NMR spectrum of 3 in CDCl
319
Figure S14
13C NMR spectrum of 3 in CDCl
320
Figure S15
1H-
1H COSY of 3
21
Figure S16 NOESY of 3
22
Figure S17 HMQC of 3
23
Figure S18 HMBC of 3
24
Figure S19
1H NMR spectrum of 4 in CDCl
325
Figure S20
13C NMR spectrum of 4 in CDCl
326
Figure S21
1H-
1H COSY of 4
27
Figure S22 NOESY of 4
28
Figure S23 HMQC of 4
29
Figure S24 HMBC of 4
30
Figure S25
1H NMR spectra of 1a in CDCl
331
Figure S26
1H NMR spectra of 1b in CDCl
335
Figure S27
1H NMR spectra of methyl ester of 1 in CDCl
338
3
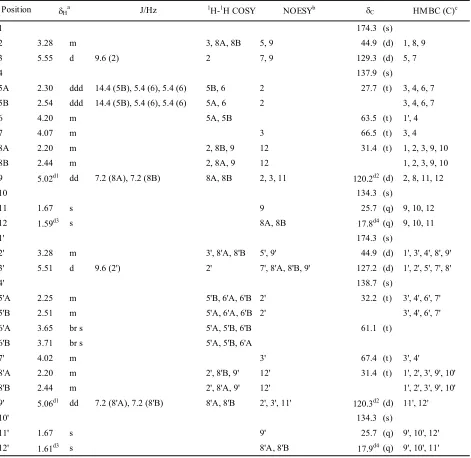
J/Hz 1
H-1H COSY NOESYb HM BC (C)c
1 177.5 (s)
2 3.27 m 3, 8A, 8B 9, 11, 12 44.9 (d) 1, 3, 4, 8, 9 3 5.50 d 10.2 (2) 2 8A, 8B, 9, 11, 12 127.0 (d) 1, 2, 5, 7, 8
4 138.7 (s)
5A 2.25 m 5B, 6 31.9 (t) 3, 4, 6, 7 5B 2.49 m 5A, 6 3, 4, 6, 7 6 3.68 br s 5A, 5B 11, 12 61.0 (t) 4
7 4.03 br s 3, 11, 12 66.8 (t) 3, 4, 5 8A 2.20 m 2, 8B, 9 3, 11, 12 30.9 (t) 1, 2, 3, 9, 10 8B 2.44 m 2, 8A, 9 3, 11, 12 1, 2, 3, 9, 10 9 5.04 dd 7.2 (8), 7.2 (8) 8A, 8B 2, 3, 11, 12 120.2 (d) 2, 8, 11, 12
10 134.1 (s)
11 1.67 s 2, 3, 6, 7, 8A, 8B, 9 25.7 (q) 9, 10, 12 12 1.60 s 2, 3, 6, 7, 8A, 8B, 9 17.8 (q) 9, 10, 11
Table S1 NMR spectral data of
1
in
CDCl
3dC
dH a
Position
a 1H chemical shift values (d ppm from SiMe4) followed by multiplicity and then the coupling constants (J/Hz). Figures in parentheses indicate the proton coupling with that position. b The correlations with
4
J/Hz 1H-1H COSY NOESYb HM BC (C)c
1 173.5 (s)
2 3.28 m 3, 8A, 8B 5, 9 45.4 (d) 1, 3, 4, 8, 9 3 5.49 d 10.8 (2) 2 7A, 7B, 8A, 8B 129.3 (d) 2, 5, 7, 8
4 133.9 (s)
5A 2.18 m 5B, 6A, 6B 2 32.3 (t) 3, 4, 6, 7 5B 2.54 m 5A, 6A, 6B 2 3, 4, 6, 7 6A 3.65 br s 5A, 5B, 6B 61.4 (t)
6B 3.72 br s 5A, 5B, 6A
7A 4.48 d 13.2 (7B) 7B 3 67.9 (t) 1, 3, 4, 5 7B 4.62 d 13.2 (7A) 7A 3 1, 3, 4, 5 8A 2.20 m 2, 8B, 9 3, 11, 12 30.8d1(t) 1, 2, 3, 9, 10 8B 2.46 m 2, 8A, 9 3, 11, 12 1, 2, 3, 9, 10 9 5.03 m 8A, 8B 2, 11, 12 120.2d2(d) 2, 8, 11, 12
10 134.2d3(s)
11 1.67 s 9 25.7 (q) 9, 10, 12 12 1.60 s 8A, 8B, 9 17.8 (q) 9, 10, 11
1' 173.5 (s)
2' 3.28 m 3', 8'A, 8'B 5', 9' 45.4 (d) 1', 8', 9' 3' 5.52 d 10.2 (2') 2' 7', 8'A, 8'B 127.2 (d) 5', 7'
4' 139.6 (s)
5'A 2.29 m 5'B, 6' 2' 32.3 (t) 3', 4', 6', 7' 5'B 2.54 m 5'A, 6' 2' 3', 4', 6', 7' 6' 3.72 br s 5'A, 5'B 60.5 (t)
7' 4.05 br s 3' 67.5 (t) 3', 4', 5' 8'A 2.20 m 2', 8'B, 9' 3', 11', 12' 30.6d1(t) 1', 2', 3', 9', 10' 8'B 2.46 m 2', 8'A, 9' 3', 11', 12' 1', 2', 3', 9', 10' 9' 5.03 m 8'A, 8'B 2', 11', 12' 120.3d2(d) 2', 8', 11', 12'
10' 134.3d3(s)
11' 1.67 s 9' 25.7 (q) 9', 10', 12' 12' 1.60 s 8'A, 8'B, 9' 17.8 (q) 9', 10', 11'
Table S2 NMR spectral data of
2
in
CDCl
3dC
dH a
Position
a 1H che+B14:L36mical shift values (d ppm from SiMe4) followed by multiplicity and then the coupling constants (J/Hz). Figures in parentheses indicate the proton coupling with that position. b The
5
J/Hz 1
H-1H COSY NOESYb HM BC (C)c
1 174.3 (s)
2 3.28 m 3, 8A, 8B 5, 9 44.9 (d) 1, 8, 9 3 5.55 d 9.6 (2) 2 7, 9 129.3 (d) 5, 7
4 137.9 (s)
5A 2.30 ddd 14.4 (5B), 5.4 (6), 5.4 (6) 5B, 6 2 27.7 (t) 3, 4, 6, 7 5B 2.54 ddd 14.4 (5B), 5.4 (6), 5.4 (6) 5A, 6 2 3, 4, 6, 7 6 4.20 m 5A, 5B 63.5 (t) 1', 4
7 4.07 m 3 66.5 (t) 3, 4
8A 2.20 m 2, 8B, 9 12 31.4 (t) 1, 2, 3, 9, 10 8B 2.44 m 2, 8A, 9 12 1, 2, 3, 9, 10 9 5.02d1 dd 7.2 (8A), 7.2 (8B) 8A, 8B 2, 3, 11 120.2d2(d) 2, 8, 11, 12
10 134.3 (s)
11 1.67 s 9 25.7 (q) 9, 10, 12 12 1.59d3 s 8A, 8B 17.8d4(q) 9, 10, 11
1' 174.3 (s)
2' 3.28 m 3', 8'A, 8'B 5', 9' 44.9 (d) 1', 3', 4', 8', 9' 3' 5.51 d 9.6 (2') 2' 7', 8'A, 8'B, 9' 127.2 (d) 1', 2', 5', 7', 8'
4' 138.7 (s)
5'A 2.25 m 5'B, 6'A, 6'B 2' 32.2 (t) 3', 4', 6', 7' 5'B 2.51 m 5'A, 6'A, 6'B 2' 3', 4', 6', 7' 6'A 3.65 br s 5'A, 5'B, 6'B 61.1 (t)
6'B 3.71 br s 5'A, 5'B, 6'A
7' 4.02 m 3' 67.4 (t) 3', 4'
8'A 2.20 m 2', 8'B, 9' 12' 31.4 (t) 1', 2', 3', 9', 10' 8'B 2.44 m 2', 8'A, 9' 12' 1', 2', 3', 9', 10' 9' 5.06d1 dd 7.2 (8'A), 7.2 (8'B) 8'A, 8'B 2', 3', 11' 120.3d2(d) 11', 12'
10' 134.3 (s)
11' 1.67 s 9' 25.7 (q) 9', 10', 12' 12' 1.61d3 s 8'A, 8'B 17.9d4(q) 9', 10', 11'
Table S3 NMR spectral data of
3
in
CDCl
3dC
dH a
Position
6
J/Hz 1H-1H COSY NOESYb HM BC (C)c
1 3.68 m 2, 8A, 8B 9 40.2 (d)
2 5.36 br s 1 8A, 8B, 9,13A, 13B 121.2 (d) 4, 7, 8, 13
3 139.2 (s)
4A 2.45 br d 19.2 (5B) 4B, 5 13A 30.3 (t) 4B 2.59 m 5A, 5B, 6B 13B
5a 4.68 ddd 12.6 (4B), 12.6 (5b), 1.8 (4A ) 4, 5b 64.4 (t) 3, 4, 7 5b 4.33 ddd 12.6 (5a), 4.8 (4B), 2.4 (4A) 4, 5a 3, 4, 7 6
7 174.3 (s)
8A 2.33 ddd 14.4 (8B), 6.6 (1), 6.6 (9) 1, 8B, 9 2, 11 30.1 (t) 1, 2, 7, 9, 10 8B 2.52 ddd 14.4 (8A), 6.6 (1), 6.6 (9) 1, 8A, 9 2, 11 1, 2, 7, 9, 10 9 5.14 dd 6.6 (8A), 6.6 (8B) 8A, 8B 1, 2, 11 120.9 (d) 1, 8, 11, 12
10 134.6 (s)
11 1.72 s 9 25.8 (q) 9, 10, 12 12 1.67 s 8A, 8B 18.0 (q) 9, 10, 12 13A 3.99 d 13.8 (13B) 2, 4 67.4 (t) 2, 3, 4 13B 4.01 d 13.8 (13A) 2, 4
Table S4 NMR spectral data of
4
in
CDCl
3dC
dH a
Position
a 1H chemical shift values (d ppm from SiMe4) followed by multiplicity and then the coupling constants (J/Hz). Figures in parentheses indicate the proton coupling with that position. b The correlations with geminal and vicinal protones