Google Earth, Google SketchUp and GIS software;
An interoperable work flow for generating elevation
data
José Gomes Santos 1, *, Kevin Bento 2 and Joaquim Lourenço Txifunga 3
1 Department of Geography and Tourism – Faculty of Arts, University of Coimbra, Portugal; Centre for Studies in Geography and Regional Planning – CEGOT
University of Coimbra, Coimbra 3004-530, Portugal; [email protected]
2 Department of Geography and Tourism – Faculty of Arts, University of Coimbra,; [email protected] 3 Department of Geography and Tourism – Faculty of Arts, University of Coimbra,; [email protected] * Correspondence: [email protected]; Tel.: +351 962609367
Abstract: Data creation is often the only way for researchers to produce basic geospatial information for the pursuit of more complex tasks and procedures such as those that lead to the production of new data for studies concerning river basins, slope morphodynamics, applied geomorphology and geology, urban and territorial planning, detailed studies, for example, in architecture and civil engineering, among others. This exercise results from a reflection where specific data processing tasks executed in Google Sketchup (Pro version, 2018) can be used in a context of interoperability with Geographical Information Systems (GIS) software. The focus is based on the production of contour lines and Digital Elevation Models (DEM) using an innovative sequence of tasks and procedures in both environments (GS and GIS). It starts in Google Sketchup (GS) graphic interface, with the selection of a satellite image referring to the study area – which can be anywhere on Earth's surface; subsequent processing steps lead to the production of elevation data at the selected scale and equidistance. This new data must be exported to GIS software in vector formats such as Autodesk Design Web format – DWG or Autodesk Drawing Exchange format – DXF. In this essay the option for the use of GIS Open Source Software (gvSIG and QGIS) was made. Correcting the original SHP by removing "data noise" that resulted from DXF file conversion permits the author to create new clean vector data in SHP format and, at a later stage, generate DEM data. This means that new elevation data becomes available, using simple but intuitive and interoperable procedures and techniques which confgures a costless work flow.
Keywords: Interoperability, Digital Elevation Model, Google Sketchup, Geographical Information Systems-Science, Free and Open Source Software
1. Introduction
Geomorphometry is generally understood as a sub-branch of Geomorphology, whose object is related to the analysis and comparison of quantitative parameters (descriptive measures – attributes) related to the relief forms (objects) of the terrestrial surface. As referred by Hengl & MacMillan (2009, apud Silveira & Silveira, 2015) [1], DEM documents are widely used for providing continuous covering for large areas at a relative low cost. This automated digital computing provides measurements of surface shapes, context, patterns and texture, that can be used as substitutes for the criteria considered in image or aerial photo interpretation. In the same work, the main argument for its use is the variety of procedures associated with measurements, dimensions and objects that can be derived by automated analysis of elevation data, applied to natural landscape mapping and modeling. This analysis permits the consistent extraction of several parameters or objects that can be considered as direct analogues of the criteria used by the manual
interpreter to identify and delineate objects applied to several studies such as Hydrology, Pedology, Ecology, Geomorphology and Geology.
It is quite simple to identify and select for work some examples of standalone context tools (eg Arc2Earth, CoutouringGE, among others) that help us to extract elevation data directly from Google Earth. However, not all of them are available for free, not all are up-to-date or not all offer the required accuracy and precision, or the required interoperability. This exercise reveals an original work flow that permits the production of contour lines related to any area of the globe (with the selected equidistance), by the implementation of specific tasks performed in a software suite that includes Google SketchUp (GS) from which it becomes possible to export data in vector formats, namely DWG and DXF, and GIS software. From the moment the elevation data already converted to SHP format (open standard) enters the GIS environment some specific procedures must be carried out in order to correct errors and reduce uncertainty. In a later stage, it becomes possible to derive 3D information based on the production of a DEM. Depending on the user's objectives, the exercise could be completed and stopped at this stage, but he can also proceed and follow other directions, for example, the construction of derived raster maps (slope, slope exposure, contours, among others). Finally, it becomes also possible to produce new derived vector maps (SHP format) with elevation data in which the selected equidistance may be different from that initially used in the GS environment.
1.1. Terms and concepts
According to Hirt (2016) [2], the term “DEM” (an acronym for Digital Elevation Model), is often used as a generic term for Digital Surface Model (DSM) and Digital Terrain Model (DTM)1. In fact, some definitions do not seem to distinguish the terms DEM and DSM, and it is also common to find some others that equals the terms DEM and DTM (Podobnikar, 2008) [3], or consider DEM as subset of DTM that represents other morphological elements (Li et al., 2005) [4]. Other definitions can be found such as the one proposed by the USGS in the Glossary of the Landslide Hazard Program, (http://landslides.usgs.gov/learning/glossary.php) [5], which defines “DEM” as a regularly spaced GRID and “DTM” as a three-dimensional model (Triangulated Irregular Network – TIN). The DEM can be represented as a raster (a grid of squares, also known as a height map when representing elevation) or a vector-based TIN. In this case, TIN datasets are also referred to as a primary (measured) DEM, whereas the Raster DEM is referred to as a secondary (computed) DEM (Toppe, R., 1987) [6]. Other literature Li et al. (2005) [4] considers that DEM data could be acquired through techniques such as photogrammetry, lidar, ifSAR, land surveying, among others. In general terms, DEM is often used in GIS and is the most common basis for digital relief maps.
Although the DSM may be useful for landscape modeling, city modeling and visualization applications, the DTM is often required for flood or drainage modeling, land-use studies (Balenovic et al., 2015) [7], geology and other applications (UK Environment Agency, 2005) [8]. According to Al-husban (2017) [9], DEM is a computerized representation of Earth relief, and is used in many applications such as Geosciences and Geostudies but also, in Architecture, Civil Engineering, and
all issues related to urban studies, land use and territorial planning. In this following, along with the present document, DEM will be used as a generic term for both DSM and DTM data documents. One of the most common challenges that researchers and practitioners dealing with geospatial data are facing is data collection. As referred by Nelson et Al. (2009, apud Silveira and Silveira, 2015) [9], there are three main sources of data for the construction of a DEM: a) Field survey techniques, from the acquisition of precise points of latitude, longitude and elevation (x, y, z); b) Topographic maps, from the derivation of contour lines, drainage, lakes and points of elevation; c) Remote sensing, from the interpretation of aerial photographs or images acquired from satellites2, especially for photogrammetry (stereoscopic methods), radars and, more recently, laser surveys.
The production of MDT data usually derives from line vector files that gather elevation data but it is also common to construct MDT files using interpolation processes executed on the basis of a cloud of points. In the year 2000, SRTM mission collected data over most of the land surface positioned between 60º N and 54º S (about 80% of all land on Earth) and allowed to generate a complete base of terrestrial digital topographic maps of high resolution, freely available now in two resolutions: 90 m and 30 m. In this case, the derivation of MDT data in GIS environment, with or without 3d visualization, obliges that the work must be done with raster files and in a later stage to convert them for vector formats. Nasa Jet Propulsion Laboratory website (https://asterweb.jpl.nasa.gov/gdem.asp, accessed on February, 17th) informs about the origins of ASTER GDEM mission stating that "The Ministry of Economy, Trade and Industry (METI) of Japan and the United States National Aeronautics and Space Administration (NASA) jointly announced the release of the Advanced Spaceborne Thermal Emission and Reflection Radiometer (ASTER) Global Digital Elevation Model Version 2 (GDEM V2)3 in October 17, 2011. ASTER GDEM coverage spans from 83º N to 83º S, encompassing 99% of the mass of the Earth. This represents another excellent geodata provider for spatial researches once it is generally accepted the idea that DEM data is often a very useful tool for landscape analysis.
Taking in line the considerable number of methodological options that allow the production of elevation data which will always depend on the available data, the access to it, as well as on the objectives of the user, especially in terms of application, the main purpose of this study4 is in the presentation of an interoperable methodology which is based on a set of applications that performs specif tasks leading to the derivation of MDT in any area of the globe, from the selection of a satellite image acquired and processed in GS software and geoprocessed in GIS environments.
2. Materials and Methods
This exercise requires the articulation between practices and tasks carried out in a two step process (two stages): Stage A) Google Sketchup environment and Stage B) GIS environment.
2.1. Google Sketchup environment
2.1.1. Study area selection, data acquisition and preparation
In GS environment, the template selection "Urban Planning Meters" leads to the access of a graphical interface from which users can select the display mode of the image as well as the procedures that will allow the extraction of data from the Z coordinate. The execution of the
2
More recently the Unnamed Aerial Vehicles (UAV) has been a much used resource.3 The first version of the ASTER-GDEM, released in June 2009, was generated using stereo-pair images collected by the
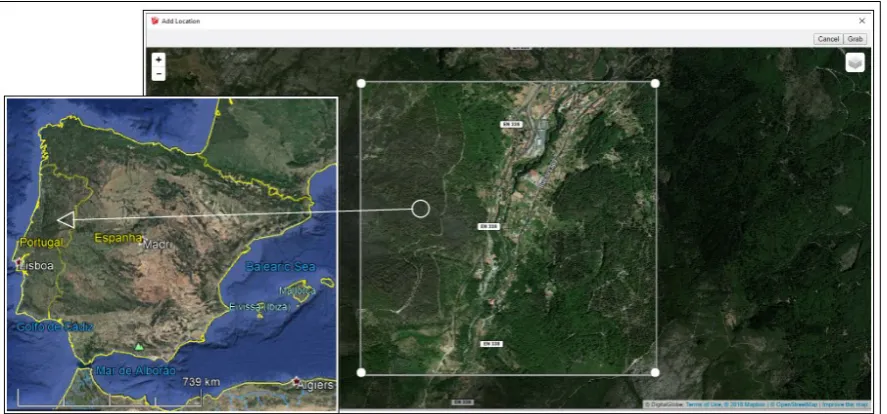
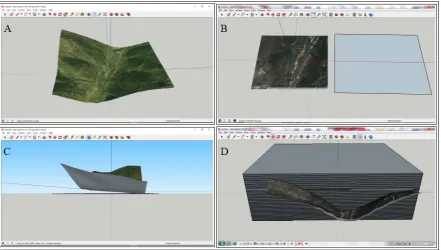
ASTER instrument on board “Terra”.following commands "File> Geo-location> add location" allows us to select the study area and the image to work and prepare it for the extraction of elevation data based on contour lines. In this essay the study area is located in the Central Region of Portugal (Figure 1), concretely, it is an area of the mountainous massif of the Serra da Estrela in which stands out the presence of a glacier valley - Glacier Valley of the River Zêzere. The command File> Geo-location> Show terrain, show us a 3D image (Figure 2a) and the use of tools "Orbit" and "Zoom" helps us to identify the volumes and the topography associated with the selected image. In order to extract ielevation data from this satellite image it is necessary to draw a rectangle whose area completely involves the image to be selected (Figure 2b). The functionalities of the "show terrain" tool returns to 3D visualization of the orthoimage that we will now have to overlap the tangential to the base of the rectangle (Figure 2c)5.
Figure 1. The mountainous massif of the Serra da Estrela, Central Region of Portugal (image obtained from Google Earth, on the left); Selection of the satellite image to be rendered in GS environment (on the center).
2.1.2. Box model and contour lines generation
In conceptual terms, the aim of this process is to create a “box module” with a layer-based architecture that, in its set, will intersect the orthoimage (Figure 2a). The first procedural task to generate the cutting layers consists on the use of the "Show Terrain" command, which allows us to view the orthoimage in a 3D perspective and informs about the altitude of the plans. By using the "Move" tool we have to create an over-raised copy of a rectangle (Figure 2b) whose area must completely involve the orthoimage. To raise this copy (new layer) that will have to be replicated as often as necessary in order to fill the “box module”, it is crucial to identify the execution status. For this purpose, the operator must verify if the cursor has a crosshair shape, and confirm if there is a graphic return defined by a "+" sign which must be accompanied by the information "on blue axis" (Z). The rectangle should be positioned tangentially to the lowest point of the orthoimage (Figure 2c), while in the lower right corner of the GS graphical interface, in "Distance / Lenght" it must be typed the distance (in meters) to which the new copy of the rectangle will be positioned above the original; that is, in practice, we are defining the equidistance value for the layers to be generated.
The iteration of this procedure, by typing "40x", or "50x", or more, until the orthoimage is completely covered by the replicates of the rectangle leads to the generation of a volumetric layer-based module (Figure 2d).
Figure 2. Initial processing stage for the recording of contour lines in GS environment.
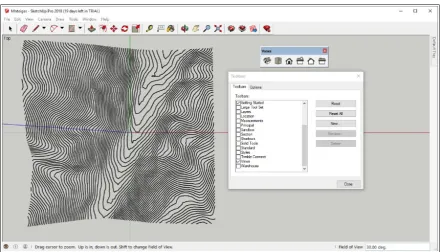
After ensuring the uniqueness of this polyhedron through the "Make Group" command, with the "Move" tool selected, the sequence "Intersect faces> With Model" must be carried out. When removing the geometric model in order to permit the orthoimage to be seen, we verified that the contour lines corresponding to the altitude layers intersected by the model were recorded on the satellite image (Figure 3a). After deleting the geometric model by following the Window> Default Tray> Layers path and, deactivating the "Location Terrain" and "Location snapshot" layers, we obtain the 3D image of the generated contours (Figure 3b). To view this elevation data in the ortho-projection mode, we must select the commands View> Toolbars> Views> Top path (Figure 4).
Figure 4. Ortho-projection of the topographic surface engraved with the contour lines.
The sequence of procedures and tasks performed in GS environment produced a set of elevation data and features that can be stored in vector formats which can be loaded in GIS software. Considering that GS does not allow to export data in SHP format, other options such as the DXF format are suitable because it can be loaded in GIS software and later converted to a first generation SHP, so-called because it involves raw data containing topographic, hypsometric and topological errors which need to be corrected or even removed from the SHP.
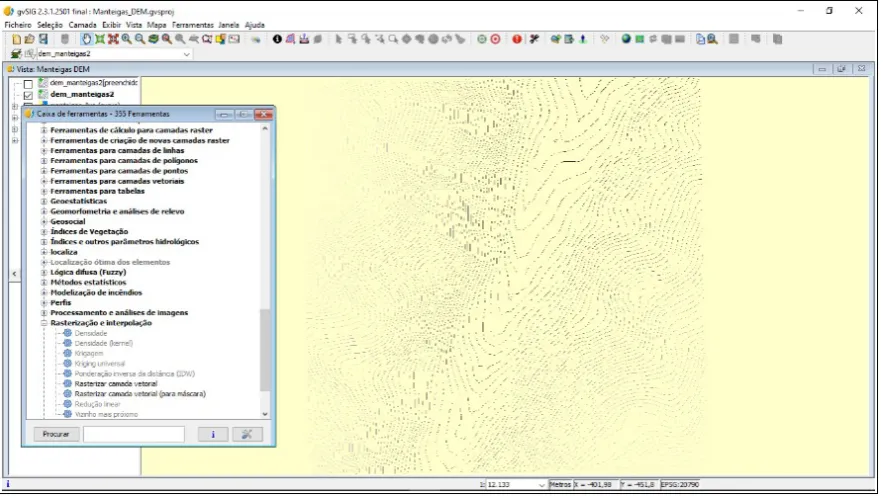
2.2. GIS environment-gvSIG and QGIS
The export of the vector data produced in the previous stage, in the GS environment, carries a lot of uncertainty and data noise, consequently, error as it was previously mentioned. It is therefore necessary to use a sequence of tasks and procedures for SHP correction. This geoprocessing stage was accomplished by using gvSIG and QGIS software (Free and Open Source Software). Once the conversion of the DXF file to SHP format has been performed, the observation and analysis of the SHP attribute table confronts us with the existence of four types of data that require attention:
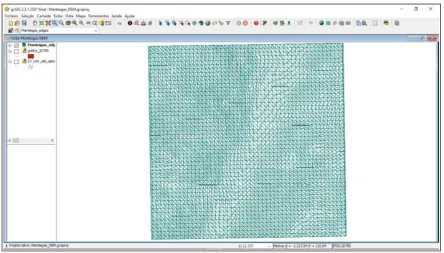
1. Data exported among with the contour lines, which have to be removed (Figure 5).
Figure 5. Resulting DXF file, from the export process from GS to the gvSIG.
Figure 6. Data resulting from the DXF - SHP conversion process, before and after the correction of the attribute values by running the merge of adjacent line features algorythm in gvSIG.
Figure 8. DEM generated after the running of void filling process (pixel-resolution 10 m).
Figure 9. Contour lines (in vector format and with records multiples of 10m), processed with the "Vectorise" algorithm (Sextant module).
3. Results
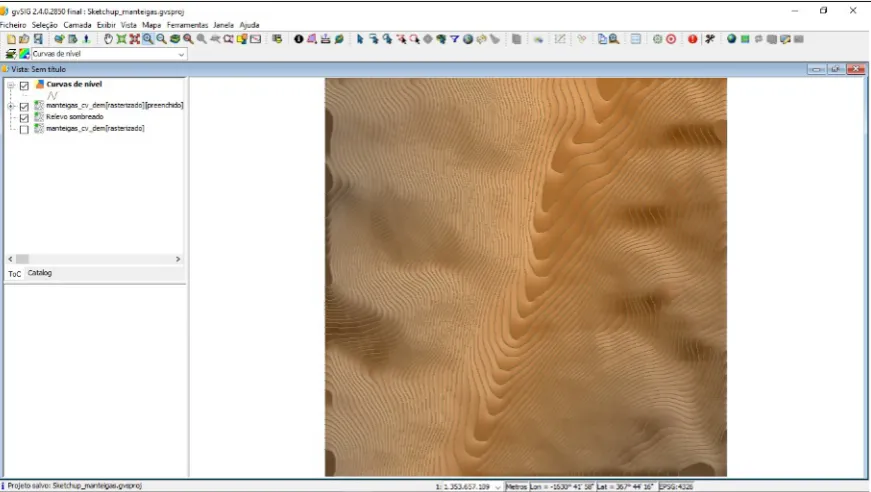
as a new basis for more complex works. An example of it can be seen in Figure 10, which displays the result of the overlapping of contour lines in vector data model with the DEM rendered with hillshade effect (shaded relief). The user now has at his disposal derived elevation data, with desired detail and scale, which can serve as a basis for deriving new data, such as slope and slope exposure maps, and perform calculations to other complementary studies, such as the generation of river networks, basins and watersheds, stream order and other hydrologic data.
Figure 10. Contour lines final layer (vector format, with 10m of equidistance) and DEM with shaded relief efect (raster format, 10m resolution pixel).
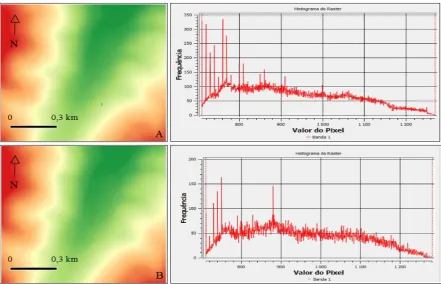
Figure 11. DEM derived from GS-GIS conversion process and raster histogram for a sample of the study area (A), performed in QGIS software. DEM derived from line features, sheets 213 and 224 of the Portuguese Military Map, 1/25000 (B).
4. Discussion
The lack, scarcity, high cost or simply conditioned access to geospatial data constitute barriers to research (academic and scientific) which sometimes can be overcome by the researchers themselves. Using autonomous strategies, one can produce basic data suitable for a subsequent integration into thematic complex work, and dispense themselves from the obligation to have recourse to institutional sources that do not always guarantee free and open access to geospatial data. As can be seen from the close-up of the figures presented, namely from Figures 10 and 11 which show the final results obtained, the methodology tested consists of a set of interoperable procedures that allows to obtain new data on the altimetry of any globe region.
5. Conclusion
A considerable number of sciences requires the use of basic altimetric data for the characterization of the physical support of human activities, from the detailed urban studies to those involving tasks and activities related to land use and territory planning and management.
The implementation of a suite of interoperable solutions that allow the use of GIS software to match with other applications that render vector or raster information as, in this case, Google Sketchup, reflexes the creation of new elevation data which after undergoing processes such as error correction, uncertainty reducing and cartographic noise removal, shall be available to derive new data, with the guarantee of preservation of its integrity and reliability, so that it can integrate new chains of procedures related to various studies applied to diverse areas of Science and its applications, social and/or natural.
The generation of contour lines and DEM data are examples of a creative low cost process, the importance of which is recognized in several domains of its application. The exercise here presented is intended only as an example of expedited solutions which, based on an articulated procedural sequence, ensures a methodological work flow for the production of basic data that allows researchers to overcome barriers placed at initial stages of most of the works, and that invariably begins with the formulation of problems and equations for which they will have to find answers. "I do not have data – and now, what do I do?" This conception, which is sometimes more a matter of attitude than a real dilemma or a real problem, can cease to be an obstacle and have a deterrent effect on researchers decision-making process at crucial moments in the research process, if we think that the creation of geospatial data, with the required prudence, can be assured and performed by researchers and non professional users. This is a singular perspective of the Volunteered Geographic Information paradigm, where data users can be also data producers and providers.
Author Contributions: Conceptualization, José Gomes dos Santos, Kevin José Barroqueiro Bento and Joaquim Lourenço Tunga Txifunga; Data curation, Kevin José Barroqueiro Bento and Joaquim Lourenço Tunga Txifunga; Formal analysis, José Gomes dos Santos; Investigation, José Gomes dos Santos; Methodology, José Gomes dos Santos, Kevin José Barroqueiro Bento and Joaquim Lourenço Tunga Txifunga; Project administration, José Gomes dos Santos; Software, José Gomes dos Santos; Supervision, José Gomes dos Santos; Validation, José Gomes dos Santos; Writing – review & editing, José Gomes dos Santos.
Funding: This research received no external funding.
Conflicts of Interest: The authors declare no conflict of interest.
References
[1] Silveira, R.; Silveira, C. Análise comparativa entre modelos digitais de elevação com distintas características de processamento e aquisição, Bol. Geogr., Maringá, 2015, v. 33, Número Especial, p. 106-121. DOI: 10.4025. [2] Hirt, C. Digital Terrain Models. In Encyclopedia of Geodesy, Switzerland: Springer International Publishing Switzerland, 2016, DOI: 10.1007/978-3-319-02370-0_31-1. (pdf available at https://www.researchgate.net/publication/278683672_Digital_Terrain_Models).
[4] Li, Z., Zhu, Q.; Gold, C. Digital Terrain Modeling: Principles and Methodology. 1st Edition, CRC Press, Boca Raton, Florida, USA, 2004, 318 p., ISBN 0-415-32462-9.
[5] USGS Glossary of USGS Landslide Hazard Program. Available at https://landslides.usgs.gov/learn/glossary.php.
[6] Toppe, R. Terrain models - A tool for natural hazard Mapping. In Avalanche Formation, Movement and Effects. Proceedings of the Davos Symposium, Davos, Switzerland, September, 1986, International Association of Hydrological Sciences Publ., Wallingford, UK, 1987, abstract no. 162, 629-638.
[7] Balenovic, I.; Marjanovic, H.; Vuletić, D.; Paladinić, E.; Sever, M.; Indir, K. Quality assessment of high density digital surface model over different land cover classes. Periodicum Biologorum, 2015, Vol. 117, nº 4, 459 - 470, (pdf available at http://www.racurs.ru/www_download/articles/balenovic.pdf).
[8] UK Environment Agency. Appendix A – Glossary and Acronyms. Severn Tidal Tributaries Catchment Flood
Management Plan – Scoping Stage. 2005. (pdf available at
https://web.archive.org/web/20070710054700/http://www.environmentagency.gov.uk/commondata/acrobat/ app_a_1243533.pdf ).
[9] Al-husban, Y. Comparison of Accuracy of Two Global DEMs, and the
Extracted DEM from the Topographic Map of the Tafilah