Article
1
Quick, Easy and Economic Mineralogical Studies of
2
Flooded Chalk for EOR Experiments Using Raman
3
Spectroscopy
4
Laura Borromeo1, 2, *, Nina Egeland1, 2, Mona Wetrhus Minde1, 2, Udo Zimmermann1, 2,
5
Sergio Andò3, Merete Vadla Madland1, 2, Reidar Inge Korsnes1, 2
6
1 Department of Energy Resources, University of Stavanger, Norway
7
2 The National IOR Centre of Norway, Stavanger, Norway
8
3 Department of Earth and Environmental Sciences, University of Milano - Bicocca, Milano, Italy
9
* Correspondence: [email protected]; Tel.: +39 3386008504
10
Abstract: Understanding the chalk-fluid interactions and the associated mineralogical and
11
mechanical alteration at sub-micron scale are major goals in Enhanced Oil Recovery. Mechanical
12
strength, porosity, and permeability of chalk are linked to mineral dissolution that occurs during
13
brine injections, and affect the reservoir potential. This paper presents a novel „single grain“
14
methodology to recognize the varieties of carbonates in rocks and loose sediments: Raman
15
spectroscopy is a non-destructive, quick, and user-friendly technique representing a powerful tool
16
to identify minerals down to 1 µm. An innovative working technique for oil exploration is proposed,
17
as the mineralogy of micron-sized crystals grown in two flooded chalk samples (Liége, Belgium)
18
was successfully investigated by Raman spectroscopy. The drilled chalk cores were flooded with
19
MgCl2 for c. 1.5 (Long Term Test) and 3 years (Ultra Long Term Test) under North Sea reservoir
20
conditions (Long Term Test: 130°C, 1 PV/day, 9.3 MPa effective stress; Ultra Long Term Test: 130°C,
21
varying between 1-3 PV/day, 10.4 MPa effective stress). Raman spectroscopy was able to identify
22
the presence of recrystallized magnesite along the core of the Long Term Test up to 4 cm from the
23
injection surface, down to the crystal size of 1-2 µm. In the Ultra Long Term Test core the growth of
24
MgCO3 affected nearly the entire core (7 cm). In both samples, no dolomite or high-magnesium
25
calcite secondary growth could be detected when analysing 557 and 90 Raman spectra on the Long
26
and Ultra Long Term Test, respectively. This study can offer Raman spectroscopy as a breakthrough
27
tool in petroleum exploration of unconventional reservoirs, due to its quickness, spatial resolution,
28
and non-destructive acquisition of data. These characteristics would encourage its use coupled with
29
electron microscopes and energy dispersive systems or even electron microprobe studies.
30
Keywords: flooded chalk; Raman spectroscopy; Enhanced Oil Recovery; carbonates; calcite; magnesite.
31
32
1. Introduction
33
Injection of seawater-like brines is one of the most successful Improved Oil Recovery (IOR)
34
methods on the Norwegian Continental Shelf [amongst many others: 1,2]. The mechanical strength
35
of chalk is weakened by seawater at reservoir temperatures, and as a consequence, compaction and
36
loss in porosity occur, affecting the oil recovery factor of carbonate fields [3-10]. It is important to
37
understand how fluids interact with rocks because textural and chemical/mineralogical changes in
38
the pore space affect the way water will adsorb and expel oil from the rock [3, 8, 11-17]. Previous
39
research on fluid injection has been carried out [5, 8, 17-21] and three ions have proven to play
40
important roles when chalk is exposed to seawater at elevated temperatures: Ca2+, Mg2+, and SO42-.
41
The injected seawater triggers several mechanisms such as precipitation, dissolution, ion exchange,
42
adsorption, and desorption, to interplay at the same time, with different relative significance
43
depending on the position in the reservoir (nearby to the injector or to the producer). It is therefore
44
beneficial to simplify the system and study each ion individually. With MgCl2 brines, which represent
45
simplified aqueous chemistry of seawater, the role of Mg2+ is specifically studied.
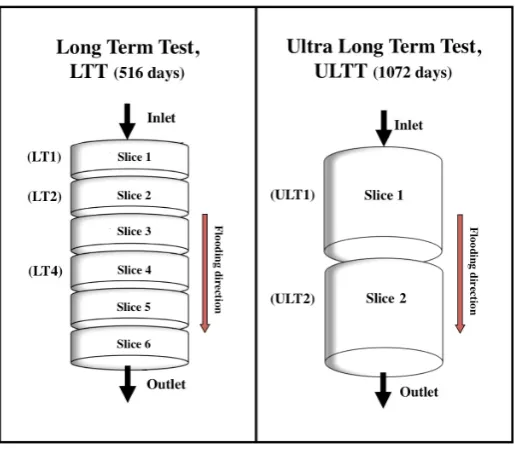
46
The two cores investigated in this study (see Fig. 1), were flooded with MgCl2 for 1.5 (Long Term
47
Test, LTT) and 3 years (Ultra Long Term Test, ULTT) under reservoir conditions (LTT: 130°C, 1
48
PV/day, 9.3 MPa effective stress, ULTT: 130°C, varying between 1-3 PV/day, 10.4 MPa effective
49
stress), in order to reach a mineralogical insight of the basic processes that happen during long time
50
brine injection.
51
The analyses are carried out by Raman spectroscopy, which is a quick and versatile
information-52
rich technique that can easily be applied to almost all substances (gases, liquids, solids, organic, and
53
inorganic) with the only exception of metals. In the last decades Raman spectroscopy has proven to
54
be an easy way to obtain mineral identification (see Fig. 2) [22-27] as every Raman spectrum is like a
55
fingerprint that can provide various information such as crystallinity, phase, intrinsic stress/strain,
56
and polymorphism [28-31]. Furthermore, mineral phases can be identified down to a few microns
57
[32], a possibility of paramount importance in chalk investigation. By applying Raman to flooded
58
chalk, a „grain by grain“ methodology was developed to obtain a better understanding of its
59
mineralogy.
60
2. Materials and Methods
61
2.1. Samples
62
The samples studied in this project are all chalk, fine-grained carbonate rocks, built primarily of
63
the skeletal debris of micro- and nano-organisms, mainly coccoliths, shed from coccolithophores (see
64
SEM images in Fig. 3). The cores were sampled at the Lixhe outcrop (Gulpen Formation, Campanian
65
to late early Maastrichtian) [33] near Liège in Belgium, in particular from the Zeven Wegen Member
66
[34] with an age of 75.5–78.0 Ma. The chalk shows clear signs of recrystallization, contact cements,
67
and particle interlocking. Nevertheless, coccoliths are still well preserved and the rock presents
68
intrafossil porosity [35]. The chalk from Liège shows a clean compositional nature, as the main
69
mineral component is calcite (CaCO3) together with minor abundances of non-carbonate material
70
(between 3-5 wt.% in total) [36, 37] that mainly consists of quartz, smectite/mixed smectite-illite layer,
71
mica, kaolinite, and clinoptilolite, and minor amounts of zeolite, apatite, opal, feldspar, pyroxene,
72
pyrites, and titanium oxide [36, 38].
73
The porosities lie in the range of 40-45 % [21, 35, 39-42]. More information about mineralogy,
74
petrography, and rheological characteristics of these chalk successions can be found in literature [35,
75
39, 40-42]. Onshore chalk successions are used as analogues for North Sea reservoir chalk in several
76
studies [8, 17, 20, 21, 35].
77
2.2. Flooding experiments
78
For this study, two long-term tests were analysed. Both cores were flooded with MgCl2 at
79
reservoir conditions. The chalk cores (length: ~70 mm, diameter: ~38 mm) were mounted into triaxial
80
cells that allow for measurements of axial strains while flooding of reactive fluids at elevated
81
pressures, stresses, and temperatures. Each triaxial cell was equipped with a heating jacket and a
82
regulation system that kept the temperature constant at 130 ± 0.1°C throughout the experiment. To
83
avoid boiling at temperatures above 100°C, a pore pressure of 0.7 MPa was applied prior to the
84
heating of the system. While distilled water was injected to ensure a clean pore system and to clean
85
the sample, the confining pressure and pore pressure were simultaneously increased from 0.5 and 0
86
MPa to 1.2 and 0.7 MPa, respectively, with a constant effective stress equal to 0.5 MPa Then, the
87
hydrostatic pressure was increased to 10.0 MPa (LTT) and 11.1 MPa (ULTT). A 0.219 M MgCl2 brine
88
was injected with a flooding rate of 1 pore volume per day (PV/day) for the LTT and varying between
89
1-3 PV/day for the ULTT. The effective stress was 9.3 MPa and 10.4 MPa for the LTT and the ULTT,
90
respectively. After the experiment was finished, the cores were cleaned, and after drying, cut into
91
slices with thicknesses of about 10 mm (LTT; to the left in Fig. 1) and of about 35 mm (ULTT; to the
92
of the performed tests, the reader is referred to Zimmermann et al. (2015) [36] for the LTT and
94
Nermoen et al. (2015) [43] for the ULTT.
95
96
Figure 1. Schematic drawings of how the two cores were cut after the flooding experiment: Long Term
97
Test (LTT) to the left (modified from Zimmermann et al. 2015 [36]) and Ultra Long Term Test to the
98
right.
99
2.3. Field Emission Gun-Scanning Electron Microscopy with Energy-Dispersive Spectroscopy
100
Field Emission Gun-Scanning Electron Microscopy with Energy-Dispersive Spectroscopy
(FEG-101
SEM) analyses were performed at the University of Stavanger using a Zeiss Supra VP 35. Freshly
102
chipped off pieces of slices from the three core samples were analysed together with chips of
103
unflooded chalk from the end-pieces of the same cores. The samples were coated with palladium
104
ensuring a steady flux of electrons. The microscope parameters were set at an acceleration voltage
105
between 12 to 15kV, 30 µm aperture, and a working distance between 10 and 12 mm. The high current
106
setting was used. To perform qualitative and semi-quantitative analyses of the chemical composition
107
of the imaged areas an EDAX energy-dispersive x-ray spectroscopy (EDS) system was used. To
108
optimize the quantification results, and because the chalk predominantly consists of calcite, an
109
Iceland spar calcite crystal was used to calibrate the system [36].
110
2.4. Raman spectroscopy
111
During this study, most of the spectra (465 of 557; reported with “H” in figures and Table 1)
112
were collected with a Horiba XploRA Raman spectrometer equipped with an Olympus microscope
113
with maximum magnification of 100x, and a motorized x–y stage. Calibration of spectra was obtained
114
using a silicon wafer with a main peak at 520.7 cm-1 as reference and maintained during the analysis
115
with a constant checking of the position of a sharp neon lamp emission line at 476.8 cm-1. Other
116
spectra (92 of 557; LTT slice 1: p1_G and I; p2_D and E; slice 4: C and D; reported with “R” in Fig. 2)
117
were obtained using a high-resolution Renishaw inVia Reflex confocal Raman microscope, equipped
118
with a Leica DM2500 polarizing microscope (maximum magnification of 100x) and motorized x–y
119
stages. With both spectrometers, spectra were collected with a 532 nm line, solid-state lasers (10 mW
120
at the sample), laser spot around 1 µm, spectral resolution of ±1 cm-1, acquisition time of 1-2 minutes,
121
magnification of 100x. Microscope pictures were taken for each beamed grain or cluster of grains. The
122
spectral region found to be the most important and convenient to our study was the low-medium
123
one; setting the XploRA spectrometer with a 2400 lines/mm grating in back-scattering configuration
124
inVia spectrometer instead, allowed us to collect in the range of 140-1900 cm-1. In order to try to detect
126
the occurrence of hydrated silicates, the region between 2900 and 4200 cm-1 was investigated
127
collecting 200 spectra with the Renishaw inVia Reflex confocal Raman microscope at 100x of
128
magnification.
129
Determination of the position of the peaks was performed through the Gaussian - Lorentzian
130
(Pseudo Voight) deconvolution method, with an accuracy of 0.2 cm-1, using the software Labspec 5,
131
utilized also for baseline subtraction that helped to eliminate the occasional fluorescence of
132
carbonates. Fluorescence and Raman scattering have similar origins, as both involve the inelastic
133
scattering of photons. Practically, fluorescence represents a strong background noise that can
134
obliterate the Raman signal. To avoid this phenomenon, chalk cores were not analysed directly on
135
the rock surface but as very small amounts of powder that were scraped off with a needle from the
136
rock, placed and spread on a glass slide. As the quantity required is almost negligible, and no specific
137
preparation is needed to perform these analyses, Raman procedure allows for further investigation
138
with other instrumentation if needed.
139
2.5. Raman spectroscopy on carbonates
140
For their large diffusion and good Raman signal, carbonates have been investigated in detail,
141
with particular attention to thermodynamic properties and their vibrational spectra (23, 25, 44-49).
142
Their Raman peaks positions are influenced by the magnesium content and crystallographic structure
143
and allow in distinguishing calcite from Mg-calcite, aragonite, magnesite, huntite, and dolomite [32,
144
45, 49-52].Carbonate minerals show comparable spectra as their structure is quite similar; a consistent
145
increase in Raman shifts according to their Mg content occurs between calcite and magnesite, as a
146
consequence of increased inter-atomic distances following the substitution of Ca2+ with the smaller
147
Mg2+ ion in the cell [23, 45, 53]. This shift assists in distinguishing between the different carbonates.
148
Carbonate group minerals spectra (see Fig. 2) present four main peaks which can be divided into
149
internal vibrations of the (CO3)2- group (symmetric stretching, 600 – 1200 cm-1, and asymmetric
150
stretching, 1200 – 1700 cm-1) [38, 45, 52, 54-56] and into lattice vibrations involving translation and
151
librations of the (CO3)2- group relative to the Ca2+ or Mg2+ ions (100 – 500 cm-1). The strongest and
152
sharpest peak (ν1,symmetric stretching mode of the carbonate ion) is present around 1086 – 1095 cm-1
153
(calcite – magnesite respectively) along with other subsidiary bands at 150 – 215 cm-1 (T, translational
154
mode), 280 – 330 cm-1 (L, librational mode), and 712 – 738 cm-1 (ν4, in-plane bending of the (CO3)2- group)
155
[45, 57, 58].
156
2.6. Earlier studies and characterisation of the sample material
157
Various high-resolution methods were used to study mineralogical alteration in flooded chalk:
158
field emission gun scanning electron microscopy– energy-dispersive X-ray spectroscopy
(FEG-SEM-159
EDS) [3, 5, 8, 14, 36, 38, 59], nano secondary ion mass spectrometry (NanoSIMS) [36, 50, 60], x-ray
160
diffraction (XRD) [36], whole-rock geochemistry techniques [36, 37, 60], Tip-Enhanced Raman
161
Spectroscopy-Atomic Force Microscopy (TERS-AFM) [61, 62], Transmission Electron Microscopy
162
(TEM) [59, 63], Mineral Liberation Analysis (MLA) [59]. The authors (LTT [36], and ULTT [43])
163
determined a loss of Ca2+ and a gain in Mg2+, demonstrating a precipitation of new Mg-minerals in
164
the core. FEG-SEM and TEM images have shown magnesite crystals with a grain size between 100
165
nm and 1 µm [59, 63].
166
Based on geochemical methods, Zimmermann et al. (2015) [36] could calculate that 20 % of the
167
mass of the core had been dissolved during a 1.5 years long experiment. The core experienced axial
168
170
Figure 2. Raman spectra of calcium and magnesium carbonates: dolomite (UNIMIB standard sample,
171
Selvino, Italy); magnesite (M.A.C. certificated standard); calcite (UNIMIB standard sample,
172
Chihuahua, Mexico, ~ 0 mol% MgCO3), aragonite (UNIMIB – University of Milano Bicocca – standard
173
sample, Val Formazza, Italy). Spectra with ‘R’ were analysed by the Renishaw inVia confocal Raman
174
microscope and spectra with ‘H’ by Horiba Xplora. Stars represent the neon lamp emission line at
175
476.8 cm-1 used for calibration with the Horiba XploRA spectrometer. Peak positions are reported
176
without decimals. After Borromeo et al. 2017a [49].
177
In the Long Term Test (LTT), using x-ray diffraction (XRD) [36], could detect the presence of
178
magnesite, chrysotile (slice 1-3), tilleiyte (only in slice 4), quartz, anthophyllite as well as gypsum (the
179
latter only in the unflooded chalk). Following a geochemical model [14], talc should precipitate, but
180
this mineral could not be detected by XRD or other mineralogical analyses. Furthermore, magnesite
181
could only be detected when it was rather abundant, and showed the limits of XRD as a detection
182
method for traces of minerals. NanoSIMS 50 was the only analytical method that could detect
183
positively with an image proof magnesite and very tiny new grown quartz of micron- and sub-micron
184
sizes [36]. When analysed by MLA, the shorter of the two tests, LTT, displayed a rather sharp (~1.5
185
mm) transition between two areas with different mineralogy [59]. Closest to the inlet of the core, the
186
rock material is completely altered into magnesite with minor contents of calcium along with clay
187
minerals. In the area furthest away from the inlet, the mineralogy is still dominated by calcite, with
188
occurrences of magnesite and clay, indicating only partial dissolution of calcite and precipitation of
189
magnesite opposed to the complete substitution at the inlet. In the ULTT, the whole core showed
190
similar composition, magnesite with the mentioned calcium impurities and clay.
191
Nermoen et al. (2015) [43] describes the flooding experiment of the 3-years-test (ULTT) in detail
192
and a porosity decrease from 41.32 % to 40.02 % was observed at the end of the experiment,
193
documenting how dissolution and precipitation of the solid volume may significantly alter the
194
porosity evolution during compaction. The solid density increased from 2.68 to 2.90 g/cm3 throughout
195
the experiment, simultaneously the core has lost 22.93 g, which exemplifies that solid volume changes
196
occur during flooding of MgCl2 brines.
197
Common for the two tests is that compaction alone cannot explain the changes in permeability
198
and porosity over time. For the ULTT [43] the permeability and calculated porosity are lowered
199
during the start of the experiment where compaction is the controlling mechanism, while throughout
200
the experiment, the permeability and porosity starts to increase again. This is believed to be caused
201
by processes that involve mineralogical transformation through dissolution of primary and
202
both qualify and quantify to understand geomechanical alteration, as also seen in Wang et al. (2016)
204
[37].
205
3. Results
206
3.1. FEG-SEM-EDS
207
The composition of the two cores after flooding has been affected by the nature of the fluid flow
208
paths. This is often only visible at microscale, has a specific geometric form and is composed of
209
several compositional trends [59] and therefore awaits a detailed study and is not of relevance here.
210
Hence, a quick and thorough investigation of the mineralogical composition prior to detailed
FEG-211
SEM-EDS studies or further meticulous electron- and ion-beam-based analyses would be helpful.
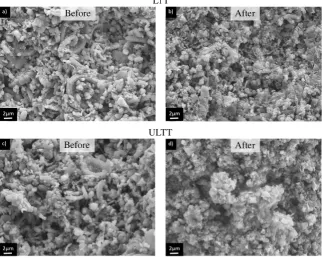
212
When studied by FEG-SEM-EDS, both the texture and the chemical composition of the chalk is
213
significantly altered compared to the unflooded material (Fig. 3). The newly precipitated crystals are
214
found in massive parts of the core (inlet part), with a homogenous high-magnesium carbonate
215
composition as well as single crystals within the calcite dominated areas. The grains are no longer
216
rounded, but show a rhombic crystal shape, with grain-size mostly below 1 µm. In the completely
217
altered areas, coccoliths and other micro/nano-fossils are no longer observed, while in parts where
218
the calcite is still present, clear signs of dissolution is visible [36, 59]. Additionally, significant
219
amounts of clay-minerals are present, with main constituents being Mg and Si, which could be
220
interpreted to be talc.
221
222
Figure 3. (a) SEM-micrograph of unflooded chalk from the end-piece of the LTT-core (from
223
Zimmermann et al. 2015; [36]). Main components are coccoliths and fragments with a calcitic
224
composition. (b) SEM-micrograph of the severely altered part of the flooded core (LTT) towards the
225
inlet of the core (from Zimmermann et al. 2015 [36]). Coccoliths and other fossils are no longer visible,
226
only crystals mainly below 1 µm in size, with high magnesium content. (c) SEM-micrograph of
227
unflooded chalk of the ULTT with main components as observed in (a). (d) SEM-micrograph from
228
slice 5 of the ULTT after flooding with MgCl2. Texture and composition is as observed in (b).
229
3.2. Raman Spectroscopy
230
Raman spectroscopy has proven to be easy to use, but it requires an experienced operator to
232
decide the setting of the instrument and how to interpret the spectra (see below). The mineralogical
233
changes due to fluid injection were quickly evaluated: in few tens of seconds it was possible to
234
distinguish the carbonate minerals present in the chalk (see Table 1). 647 spectra were collected, of
235
which only 5 could not be identified, as they were not present in databases or literature. In LTT core
236
557 low region spectra were collected, 226 in slice 1 (120 in fragment 1, LT1_p1; 106 in fragment 2,
237
LT1_p2), 220 in slice 2 (LT2), and 111 in slice 4 (LT4). In ULTT 90 spectra were collected in 9 different
238
areas of the core.
239
In both ULTT and LTT cores no dolomite, aragonite, huntite, or high magnesium-calcite (45, 49)
240
could be detected. As calcite Raman peaks positions reflect the magnesium content present in its
241
lattice [49], it is possible to determine that the calcites present in ULTT and LTT always contain a low
242
magnesium content (0 – 10 mol % ≈ 4 w.%; [49]) in the mineral.
243
Table 1. Mineral composition of the two cores: amounts and percentages of Raman spectra collected
244
for each mineral in the Long Term Test (LTT) and in the Ultra Long Term Test (ULTT). When a two
245
minerals spectrum was found, both components were counted to obtain the calcite/magnesite
246
percentages.
247
248
spectra % spectra % spectra % spectra %
LT1_p1A 20 77% 6 23%
LT1_p1B 3 13% 20 87%
LT1_p1C 20 87% 3 13%
LT1_p1D 10 31% 20 63% 2 6%
LT1_p1E 7 26% 20 74%
LT1_p1F 18 60% 12 40%
LT1_p1G 0 0% 22 96% 1 Brookite 4%
LT1_p1H 0 0% 25 100%
LT1_p1I 0 0% 25 100%
LT1_p2A 18 82% 4 18%
LT1_p2B 2 10% 18 90%
LT1_p2C 13 39% 20 61%
LT1_p2D 16 53% 14 47%
LT1_p2E 4 82% 16 18%
LT2_A 71 92% 6 8%
LT2_B 49 86% 7 12% 1 2%
LT2_C 48 61% 31 39%
LT2_D 30 41% 43 58% 1 Rutile 1%
LT4_A 19 79% 5 21%
LT4_B 18 69% 6 23% 2 8%
LT4_C 20 100% 0 0%
LT4_D 20 100% 0 0%
ULT1_1 3 23% 10 77%
ULT2_4 1 9% 10 91%
ULT2_5 0 0% 10 100%
ULT2_5B 3 23% 10 77%
ULT2_6 1 9% 10 91%
ULT2_7 2 17% 10 83%
ULT2_8 1 9% 10 91%
ULT1_9 0 0% 9 100%
ULT1_10 3 8% 10 92%
An important issue regarding the results presented in this study (Table 1) that are shown as a
249
percentage mineral/total is that we need to consider these % not as weight % or volume %, as the data
250
express the presence of the signal of a mineral compared to the total of the collected spectra. When
251
vibrational modes of both calcite and magnesite were detected simultaneously in one spectrum, both
252
minerals were counted. In fact, occasionally, peaks of both calcite and magnesite were present in the
253
same spectrum: this can happen when the analyses are performed on overlapped or very closely
254
spaced fine grains (dimension of 1-2 μm), when the laser beams both grains at the same time and the
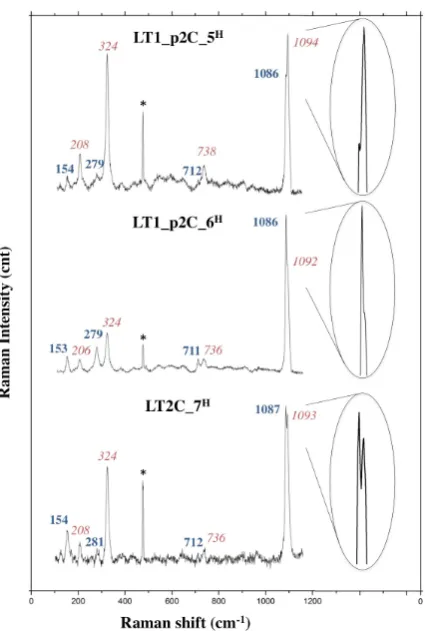
255
laser diameter is too large. In this case, the detector collects photons scattered from the two minerals,
256
resulting in a spectrum that is the mathematical sum of the two spectra of the two minerals (see Fig.
257
4). Consequently, the strong and sharp ν1 peak (symmetric stretching mode of the carbonate ion) of both
258
calcite and magnesite is present in one spectrum, respectively around 1086 and around 1095 cm-1 (25,
259
45, 46, 49) depending on the intensity, sharpness, and nearness of these two peaks, shoulders
260
(asymmetric peaks) or double peaks (peaks with two edges) can be present (examples in Fig. 4).
261
However, of importance is the fact that this can be detected. Another clear result of the simultaneous
262
presence of calcite and magnesite signals in the same spectrum is given by the occurrence of the L
263
(librational mode) peaks of the two carbonates at 280 and 330 cm-1 respectively. When a two minerals
264
spectrum was found, both components were counted to obtain the calcite/magnesite percentages for
265
each slice (see Table 1). It is important to point out that, as Raman spectroscopy can differentiate
266
between the carbonate species, the spectrum collected in cases as the one described above (a
267
magnesite and a calcite beamed at the same time, resulting in a combined spectrum) would be
268
different from high Mg-calcite [49] or a dolomite spectrum (compare spectra shown in Fig. 2 and the
269
ones presented in Fig. 4).
270
271
Figure 4. Raman spectra showing magnesite and calcite peaks in the same spectrum. This will happen
272
when grains of 1-2 μm in size and different mineralogy are overlapped or placed very close: the laser
273
beams both grains at the same time and as a consequence, the instrumentation detects the vibrational
274
modes of both minerals. In LT1_p2C_5 the signal from magnesite is stronger than the calcite one, in
275
minerals are very close, generating a high peak with a “shoulder”. In the third example shown,
277
LT2C_7, the ν1 of the two grains is so sharp and strong that a double peak is present. Calcite peaks
278
are reported in blue/ bold, magnesite peaks in red/italic. All the spectra were collected with the Horiba
279
XploRA spectrometer, stars represent the neon lamp emission line at 476. 8 cm-1 used for calibration.
280
Peak positions are reported without decimals.
281
In order to detect the occurrence of hydrated silicates, the presence of diagnostic vibrational
282
modes in the high frequencies region (2900-4200 cm-1) of the Raman spectra was used, where the
283
(OH)- vibrational modes are located [25, 64, 65]. The signal of phyllosilicates is quite weak and, in the
284
0-1200 cm-1 region, it is easily covered by the calcite and magnesite stronger intensity. As these two
285
carbonates are anhydrous, they do not show peaks in the high region of the spectra. More than 200
286
high region spectra were collected in slice one, LT1_p2_B where an intense recrystallization of
287
magnesite was already registered by Raman spectroscopy. The platy and very thin habit of
288
phyllosilicates and clay minerals makes them really challenging to be detected, as it is very difficult
289
to focus the laser inside their crystals and distinguish their weak scattering. Also, camera resolution
290
and laser wavelength limit the analysis, and can lower the capability of focusing on the sample
291
surface (under 1-2 μm in size).
292
3.2.2. Long Term Test
293
294
Figure 5. Raman spectra collected on the first slice of the Long Term Test. Raman showing the
295
occurrence of the original calcite (LT1_p1C_6) and the presence of recrystallized magnesite
296
(LT1_p1B_6). Calcite peaks are reported in blue/italic, magnesite peaks in red/bold. All the spectra
297
were collected with the Horiba XploRA spectrometer, stars represent the neon lamp emission line at
298
476.8 cm-1 used for calibration with the Horiba XploRA spectrometer. Peak positions are reported
299
Raman spectroscopy could identify the presence of recrystallized magnesite along the core of
301
the Long Term Test up to 4 cm from the injection surface (see Figs. 5 and 6), which is also supported
302
by Zimmermann et al. (2015) [36]. As predictable, the average alteration of the core is more pervasive
303
close to the inlet surface, showing a decreasing amount of newly grown minerals with flooding
304
direction (60 % of magnesite in slice 1-LT1; 30 % in in slice 2-LT2; and 10 % in slice 4-LT4; see Table 1
305
and Fig. 6). In Zimmermann et al. (2015) [36] positive XRD proof for magnesite could not be given in
306
slice 4, but, however, geochemical data highlighted c. 3.9 % of MgO present in this slice, in
307
comparison to 0.3 % of MgO in the unflooded material. In this study, only two non-carbonate crystals
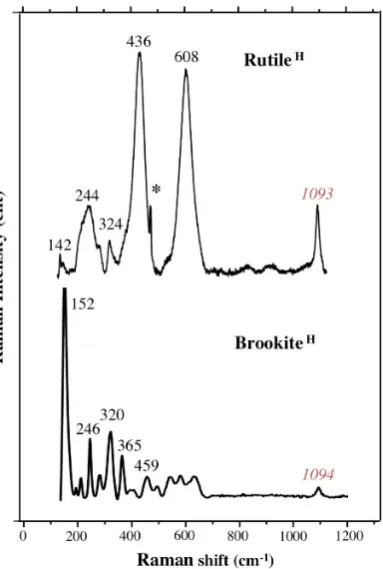
308
out of 647 Raman spectra were detected in LTT: brookite in LT1_p1_G and rutile in LT2_D (see Table
309
1 and Fig. 7).
310
311
Figure 6. Mineralogical composition of the LTT core: 10 to 70 spectra have been collected in each of
312
the area shown (9 areas in LT1_p1, 4 in LT1_p2, 4 in LT2, and 4 in LT4). Colour legend reflects the
313
percentage of calcite and magnesite spectra collected in each area of the sample. See Table 1 for calcite
314
and magnesite amounts and percentages obtained for each area. Flooding direction is indicated. Inner
315
(core) end external (rim) parts of the samples are marked. The scales represent 0.25 cm. A schematic
316
drawing (modified from Zimmermann et al. 2015 [36]) of how the cores were cut after the flooding
317
experiment is shown to the right.
318
Two pieces of Slice 1 (LT1_p1 and LT1_p2, LTT; see Fig. 6) were analysed, with a total of 14
319
In fragment 1 (LT1_p1) an intense magnesite regrowth is present in the inner portion of the core
321
(LT1_p1 E and B 74, and 87 %, respectively, see Table 1 and Fig. 6), which becomes less pervasive
322
close to the external rims (LT1_p1 A, F: 23, 40 %, respectively). In LT1_p1 a brown/ocre flow
semi-323
circular structure is present and clearly visible to naked eye in the external part of the core; here a
324
complete recrystallization to magnesite is present, reaching 100 % (LT1_p1 G and H, see Fig. 6).
325
However, in this region, also a crystal of brookite (TiO2) was detected (see Table 1 and Fig. 7). The
326
average recrystallization of LT1_p2 is 47 %, and another textural element has been observed, a grey
327
vein of calcite (CaCO3 82 %, LT1_p2 E, see Fig. 6). In order to try to detect hydrated minerals in
328
LT1_p2, 210 high region spectra were collected. Unfortunately, no signal of clay minerals or talc was
329
registered in any of them.
330
In Slice 2 (LT2; LTT) a longitudinal gradient in Mg content is perfectly detectable along flooding
331
direction with a major magnesite recrystallization in the nearest areas to the inlet surface (from 58 (in
332
LT2_D) to 8 (in LT2_A) %, see Table 1 and Fig. 6). Four areas were investigated in slice 2, with a total
333
amount of 220 Raman spectra. A rutile spectrum was collected in LT2_D (see Table 1 and Fig. 7).
334
In Slice 4 (LT4; LTT) the recrystallization is less pervasive in the core than in the others (LT1 and
335
LT2, LTT), as is the furthest from the inlet surface (Table 1; Fig. 6). A diagonal deep and pale grey
336
structure crosses the LT4 slice (see Fig. 6) with a pure calcitic composition (111 spectra, 100 % of
337
CaCO3 no magnesite spectra were detected in this area). Some MgCO3 spectra have been collected in
338
a brownish area near the rim of the core (23 % of magnesite).
339
340
Figure 7. A brookite spectrum (identified in LT1_p1G) and one for rutile as identified in LT2_D (see
341
Table 1). The main peak of magnesite (labelled in red) is present in both of them at 1093 and 1094 cm
-342
1, since the two minerals are surrounded by carbonates, which have a strong signal. Both spectra were
343
collected whit the Horiba Xplora spectrometer, the star represents the neon lamp emission line at
344
476.8 cm-1 used for calibration. Peak positions are reported without decimals.
345
3.2.3. Ultra Long Term Test
346
The Ultra Long Term Test presents a widespread recrystallization of magnesite (MgCO3)in the
347
range of 77-100 % (see Table 1 and Figs. 8 and 9) along the entire core, and no alteration front was
348
350
Figure 8. Raman spectra collected on the Ultra Long Term Test Raman showing the presence of
351
recrystallized magnesite. The spectrum at the bottom of the figure (ULTT_10_4) shows the presence
352
of a peak of calcite at 288 cm-1 (L, librational mode). Calcite peaks are reported in blue/bold, magnesite
353
peaks in red/italic. Both spectra were collected with the Horiba XploRA spectrometer, stars represent
354
the neon lamp emission line at 476.8 cm-1 used for calibration with the Horiba XploRA spectrometer.
355
Peak positions are reported without decimals.
356
357
Figure 9. Mineralogical composition of the ULTT core: 10 spectra have been collected in each of the 9
358
areas shown. Colour legend reflects the percentage of calcite and magnesite spectra collected in each
359
area of the sample. See Table 1 for calcite and magnesite amounts and percentages obtained for each
360
area. Flooding direction is indicated. The scale represents 0.5 cm. A schematic drawing of how the
361
Raman spectra were collected in 9 different areas situated along the 7 cm core (90 spectra in total,
363
see Table 1 and Fig. 9). No structures or patterns are visible to the naked eye and the core seems to
364
be quite mineralogically homogeneous. Another study [60] made using ICP-MS (induced coupled
365
plasma mass spectrometry) confirmed our data as average of 4 % of CaO was detected on the bulk
366
sample, with no great difference in composition in the different portions of the sample.
367
4. Discussion
368
This study represents the first attempt to apply Raman spectroscopy to chalk mineralogy with a
369
single grain approach on micron scale. The very fine-grained and soft texture of this sedimentary
370
rock made detailed analysis quite challenging with common methods, and for this reason in the last
371
years several high performing techniques have been included in Enhanced Oil Recovery (EOR)
372
research. Raman spectroscopy, thanks to its quickness, low cost, and micrometric resolution, turned
373
out to be very suitable for these studies as, in few seconds and without any sample preparation, a
374
mineralogical identification can be provided. It is perfectly complementary to methods such as
SEM-375
EDS.
376
The major alteration front in LTT was previously suggested between LT3 and LT4 [36], however
377
by the use of Raman spectroscopy, it was possible to detect magnesite even in slice 4 (Table 1; Fig. 6),
378
when XRD studies could not be positive in this regard [36]. The calcite dissolution and magnesite
379
recrystallization were massive in the first 2 cm of the core (slice 1 and 2 of LTT; Fig. 6). LTT5 and
380
LTT6 were not studied in this investigation as in a previous study [36],these slices were found to be
381
the least altered slices by the flooding unable to provide further information when applying the used
382
methods. Raman spectroscopy confirmed that such an alteration front was no longer present within
383
the ULTT, which means that in three years of MgCl2 injection, a sufficient quantity of Mg2+ was
384
flooded into the core [43], permitting the substitution of almost all the Ca2+ to take place (92 % of
385
magnesite Raman spectra; see Table 1 and Fig. 9).
386
As already seen with other techniques (SEM, XRD) applied in a previous study [36] it was not
387
possible to identify clay-minerals in the two cores using Raman spectroscopy. It is very difficult to
388
find a technique that could provide a resolution high enough to spot <1 µm crystals and
389
simultaneously have the capability to cover a portion of the sample wide enough to detect a ≤ 5 %
390
component, in a quick way, and image it at the same time. A principle technique would be a Mineral
391
Liberation Analyser (MLA) with a nanometre-small spot size, which is still technically challenging
392
using electron-beams on such small scales, or a Nano-scale Secondary Ion Mass Spectrometer
(nano-393
SIMS) [36] or nanoRaman (TERS, Tip Enhanced Raman Spectroscopy) [61,62], application coupled
394
with an Atomic Force Microscope (AFM). In the LTT sample nano-crystals of quartz has been
395
detected only by nano-SIMS [36], which is a very time-consuming and destructive methodology,
396
extraordinarily expensive and not quantitative. Another technique would be TEM-EDS
397
(Transmission Electron Microscopy) with the same critique points besides that the latter reveals
398
quantitative data along with mineral-identification through diffraction analysis [63]. Raman
399
spectroscopy could be the tool to use but with the known limits of 1-2 micron spotsize and the
400
impossibility to image the analysed area with an optical microscope. An advance would be to scan
401
an area, which is still a technical issue. A very low abundance of a mineral may be challenging to
402
detect unless collecting a really huge number of spectra, which in turn would be time consuming.
403
Furthermore, the identification of small and thin hydrated minerals is quite difficult to achieve in the
404
0-1200 cm-1 region of the Raman spectra, since their signal is weak and easily covered by the higher
405
carbonate peaks. For this reason, we tried to detect them with a different setting of the
406
instrumentation, moving the analyses to the high region of the Raman spectra, around 3500 cm-1,
407
where the OH- vibrational modes are present. Anhydrous minerals such as calcite and magnesite do
408
not show peaks in this region. Unfortunately, no signal from phyllosilicates has been detected,
409
possibly as a consequence of these technical difficulties.
410
Despite the impossibility to recognise so low-concentrated and platy minerals, since the set-up
411
is relatively economical and rapid the authors think that Raman spectroscopy represents a very
412
drilling steering tool, because carefully investigations could show that positive and useful results
414
were generated. This can lead to well-developed methodologies in the future for different
415
approaches, like the petroleum industry.
416
5. Conclusions
417
The mineralogical and textural changes that follow dissolution, precipitation and compaction in
418
brine-injected chalk affect the permeability, porosity, reservoir potential, and the oil flow pathways
419
(e.g. 8, 21, 36, 59). For this reason, a deep investigation of secondary mineral recrystallization is of
420
paramount importance in EOR research.
421
This study demonstrates that Raman spectroscopy is a robust, cheap, user-friendly
point-422
analysis technique that with a non-destructive sample preparation allows to quickly obtain
semi-423
quantitative mineralogical and chemical information. This method has been applied to micron-sized
424
chalk samples, giving an advantage in comparison to time consuming methods like SEM, thin section
425
studies, nano-Raman or EMPA, and ion-probe analysis. An estimation of the magnesite
426
recrystallization could be performed on two chalk cores that were flooded under reservoir conditions
427
with MgCl2: Long Term Test (1.5-years-test, LTT) and Ultra Long Term Test (3-years-test, ULTT). In
428
the LTT the average recrystallization is more pervasive close to the inlet surface and varies with
429
flooding direction from c. 60 % (slice 1) to c. 10 % (slice 4). ULTT is, on the other hand, quite
430
homogeneous, as the alteration front is no longer visible and the whole core is predominantly
431
consisting of magnesite (92 %).
432
However, not all reservoir rocks do contain minerals and/or phases as small as those in chalk,
433
which would make the here shown methodology very attractive. Raman spectroscopy can, together
434
with other research methods, provide a full range of information on flooded chalk cores for a broader
435
understanding of chemical and mineralogical changes in those samples during the mentioned EOR
436
experiments.
437
Until today Raman spectroscopy has been only occasionally applied in the oil industry [67- 70]
438
and it is time for it to become a routine analysis.
439
Acknowledgments: The authors acknowledge the Research Council of Norway and the
440
industry partners; ConocoPhillips Skandinavia AS, Aker BP ASA, Eni Norge AS, Maersk Oil Norway AS, Statoil
441
Petroleum AS, ENGIE E&P NORGE AS, Lundin Norway AS, Halliburton AS, Schlumberger Norge AS,
442
Wintershall Norge AS, DEA Norge AS of The National IOR Centre of Norway for support.
443
This study is a central part of the PhD thesis of LB who thanks the NIOR Centre of Norway for a grant to carry
444
out the research, Eduardo Garzanti and the group of Provenance Studies (University of Milano – Bicocca) for
445
their advices.
446
Author Contributions: L.B. made a substantial contribution to every step of the study, such as acquisition (with
447
the fundamental help of N.E.) and interpretation of the data and writing of the paper. U.Z., L.B, MW.M. and S.A.
448
contributed to design and conception of the present publication. M.V.M. and R.I.K. designed and performed the
449
long-term tests on the chalk cores. All the co-authors performed a critical revision of the intellectual content of
450
the paper.
451
Conflicts of Interest: The authors declare no conflict of interest. The founding sponsors had no role in the design
452
of the study; in the collection, analyses, or interpretation of data; in the writing of the manuscript, and in the
453
decision to publish the results.
454
References
455
1. Hermansen, H; Landa, G. H.; Sylte, J. E.; Thomas, L. K. Experiences after 10 years of waterflooding the
456
Ekofisk Field, Norway. J. Pet. Sci. Eng. 2000, 26.1, 11-18.
457
2. Nagel, N. B. Compaction and subsidence issues within the petroleum industry: from Wilmington to Ekofisk
458
and beyond. Phys. Chem. Earth A. 2001, 26, 3-14.
459
3. Risnes, R.; Madland M. V.; Hole M.; Kwabiah N. K. Water weakening of chalk – Mechanical effects of
water-460
4. Heggheim, T.; Madland, M. V.; Risnes, R.; Austad, T. A chemical induced enhanced weakening of chalk by
462
seawater. J. Pet. Sci. Eng. 2005, 46(3), 171-184.
463
5. Korsnes, R. I.; Strand S.; Hoff Ø.; Pedersen T.; Madland M. V.; Austad T. Does the chemical interaction
464
between seawater and chalk affect the mechanical properties of chalk? In Multiphysics coupling and long term
465
behaviour in rock mechanics; Cotthem; A. V.; Charlier R.; Thimus J. F. and Tshibangu J. P. Eds.; Taylor &
466
Francis: London, England, 2006; pp. 427-434.
467
6. Korsnes, R. I.; Madland, M. V.; Austad, T.; Haver, S.; Rosland, G. The effects of temperature on the water
468
weakening of chalk by seawater. J. Pet. Sci. Eng. 2008a, 60, 183- 193.
469
7. Madland, M. V.; Midtgarden, K.; Manafov, R.; Korsnes, R. I.; Kristiansen, T.; Hiorth, A. The Effect of
470
Temperature and Brine Composition on the Mechanical Strength of Kansas Chalk. International Symposium
471
of the Society of Core Analysts, Abu Dhabi, 2008, 6.
472
8. Madland, M.V.; Hiorth, A.; Omdal E.; Megawati M.; Hildebrand-Habel T.; Korsnes I. R.; Evje S.; Cathles M.
473
L. Chemical alterations induced by rock-fluid interactions when injecting brines in high porosity chalks,
474
Transp. Porous Med. 2011, 87, 679-702.
475
9. Zangiabadi, B.; Korsnes, R. I.; Hildebrand-Habel, T.; Hiorth, A.; Surtarjana, I. K.; Lian, A.; Madland, M. V.
476
Chemical water weakening of various outcrop chalks at elevated temperature. In Poromechanics IV, Ling H.
477
I., Smyth A., and Betti, R., Eds. DEStech Publications, Inc., Lancaster, England, 2009; pp. 543-548.
478
10. Andreassen, K.A. and Fabricius, I. L. Biot critical frequency applied to description of failure and yield of
479
highly porous chalk with different pore fluids, Geophysics, 2010, 75(6), E205-E213.
480
11. Zhang, P.; Tweheyo, M.T.; Austad T.; Wettability alteration and improved oil recovery by spontaneous
481
imbibition of seawater into chalk: impact of the potential determining ions Ca2+, Mg2+, and SO42+, Colloids
482
Surf. A Physicochem. Eng. Aspects, 2007, 301, 199–208.
483
12. Strand, S.; Hjuler, M. L.; Torsvik, R.; Pedersen, J. I.; Madland, M. V.; Austad, T. Wettability of chalk: impact
484
of silica, clay content and mechanical properties. Petroleum Geoscience, 2007, 13(1), 69-80.
485
13. Austad, T.; Strand, S.; Madland, M.V.; Puntervold, T.; Korsnes, R.I. Seawater in chalk: An EOR and
486
compaction fluid, SPE Reservoir Evaluation and Engineering, 2008, 11(4), 648-654.
487
14. Hiorth, A.; Cathles, L.; Madland, M. The Impact of Pore Water Chemistry on Carbonate Surface Charge
488
and Oil Wettability, Transp. Porous Med. 2010, 85(1), 1–21.
489
15. Fathi, S.J.; Austad, T.; Strand, S. ''Smart Water'' as a Wettability Modifier in Chalk: The Effect of Salinity
490
and Ionic Composition, Energy & fuels, 2010, 24, 2514-2519.
491
16. Ali, A.Y., Salah Hamad, A.S., Abdulaziz, A.K.; Mohammed Saleh, A.J., Laboratory Investigation of the
492
Impact of Injection Water Salinity and Ionic Content on Oil Recovery From Carbonate Reservoirs, SPE
493
Reservoir Evaluation & Engineering, 2011.
494
17. Megawati, M.; Hiorth, A.; Madland, M. V. The impact of surface charge on the mechanical behavior of
495
high-porosity chalk. Rock Mech. Rock Eng. 2013, 46.5, 1073-1090.
496
18. Zhang, P.; Tweheyo, M. T.; Austad, T. Wettability Alteration and Improved Oil Recovery in Chalk: The
497
Effect of Calcium in the Presence of Sulfate. Energy & Fuels, 2006, 20(5), 2056-2062.
498
19. Andersen, P.Ø., Evje, S., Madland, M.V.; Hiorth, A., A geochemical model for interpretation of chalk core
499
flooding experiments, Chem. Eng. Sci. 2012, 84, 218-241.
500
20. Megawati, M.; Madland, M. V.; Hiorth, A. Mechanical and physical behavior of high-porosity chalks
501
exposed to chemical perturbation: J. Pet. Sci. Eng. 2015, 133, 313-327.
502
21. Wang, W.; Madland, M. V.; Zimmermann, U.; Nermoen, A.; Reidar, I.; Korsnes, R.; Bertolino, S. R. A.;
503
Hildebrand-Habel, T. Evaluation of porosity change during chemo-mechanical compaction in flooding
504
experiments on Liege outcrop chalk. In Reservoir Quality of Clastic and Carbonate Rocks: Analysis, Modelling
505
and Prediction. Armitage, P. J.; Butcher, A. R.; Churchill, J. M.; Csoma, A. E.; Hollis, C.; Lander, R. H.; Omma,
506
J. E. & Worden, R. H. Eds.; Geological Society: London, England, 2016, Special Publications, 435.
507
22. Raman, C.V. A new radiation. Indian J. Phys. 1928, 2, 387–398.
508
23. Krishnamurti, D. Raman spectrum of magnesite. Proceedings of the Indian Academy of Sciences – Section A
509
1956, 43, 210.
510
24. Griffith, W.P., Raman spectroscopy of minerals. Nature 1969, 224, 264–266.
511
25. Kuebler, K.; Wang A.; Abbott, K.; Haskin, L. A. Can we detect carbonate and sulfate minerals on the surface
512
26. Downs, R. T. "The RRUFF Project: an integrated study of the chemistry, crystallography, Raman and
514
infrared spectroscopy of minerals." In Program and Abstracts of the 19th General Meeting of the International
515
Mineralogical Association in Kobe, Japan, 2006. 2006.
516
27. Andò, S. and Garzanti, E. Raman spectroscopy in heavy-mineral studies. In Sediment Provenance Studies in
517
Hydrocarbon Exploration and Production Scott, R. A., Smyth, H. R., Morton, A. C. & Richardson, N. Eds.
518
Geological Society: London, England, Special Publications, 2013, 386.
519
28. Gillet, P.; Biellmann, C.; Reynard, B.; McMillan, P. Raman spectroscopic studies of carbonates Part I:
High-520
pressure and high-temperature behaviour of calcite, magnesite, dolomite and aragonite. Phys. Chem.
521
Minerals, 1993; 20 (1), 1-18.
522
29. Bendel, V. and Schmidt, B. C. Raman spectroscopic characterisation of disordered alkali feldspars along
523
the join KAlSi3O8–NaAlSi3O8: application to natural sanidine and anorthoclase. Eur. J. Mineral. 2008, 20,
524
1055–1065.
525
30. Noguchi, N.; Abduriyim, A.; Shimizu, I.; Kamegata, N.; Odake, S.; Kagi, H. Imaging of internal stress
526
around a mineral inclusion in a sapphire crystal: application of micro-Raman and photoluminescence
527
spectroscopy. JRS. 2013, 44(1), 147-154.
528
31. De La Pierre, M.; Carteret, C.; Maschio, L.; André, E.; Orlando, R.; Dovesi, R. The Raman spectrum of CaCO3
529
polymorphs calcite and aragonite: a combined experimental and computational study. J. Chem. Phys. 2014,
530
140(16), 164509.
531
32. Del Monte, B.; Paleari, C. I.; Andò, S.; Garzanti, E.; Andersson, P. S.; Petit, J. R.; Crosta, X.; Narcisi, B.; Baroni,
532
C.; Salvatore, M. C.; Baccolo, G.; Maggi V. Causes of dust size variability in central East Antarctica (Dome
533
B): Atmospheric transport from expanded South American sources during Marine Isotope Stage 2. Quat.
534
Sci. Rev. 2017, 168, 55-68.
535
33. Molenaar, N. and Zijlstra, J. J. P. Differential early diagenetic low-Mg calcite cementation and rhythmic
536
hardground development in Campanian-Maastrichtian chalk. Sediment. Geol., 1997, 109(3-4), 261-281.
537
34. Robaszynski, F.; Dhondt, A. V.; John, W. M. Cretaceous lithostratigraphic units (Belgium). Geol. Belg. 2001,
538
4 1-2, 121-134.
539
35. Hjuler, M.L.; Fabricius, I.L. Engineering properties of chalk related to diagenetic variations of Upper
540
Cretaceous onshore and offshore chalk in the North Sea area. J. Pet. Sci. Eng. 2009, 68, 151–170. DOI:
541
10.1016/j.petrol.2009.06.005.
542
36. Zimmermann, U.; Madland, M. V.; Nermoen, A.; Hildebrand-Habel, T.; Bertolino, S. A. R.; Hiorth, A.;
543
Korsnes, R. I.; Audinot, J. N.; Grysan P. Evaluation of the compositional changes during flooding of reactive
544
fluids using scanning electron microscopy, nano-secondary ion mass spectroscopy, x-ray diffraction, and
545
whole-rock geochemistry: AAPG. Bulletin, 2015, 99, 791-805.
546
37. Wang, W., Madland, M.V., Zimmermann, U., Nermoen, A., Korsnes, R.I., Bertolino, S.R.A.,
Hildebrand-547
Habel, T. Evaluation of porosity change during chemo-mechanical compaction in flooding experiments on
548
Liège outcrop chalk. Geol. Soc. Spec. Publ. 2016; DOI: 10.1144/SP435.10
549
38. Hjuler, M. L., and Fabricius, I. L. Diagenesis of upper cretaceous onshore and offshore chalk from the North
550
Sea area. Technical University of Denmark, Department of Civil Engineering, Arctic Technology Centre,
551
ARTEK, 2007.
552
39. Felder, R. M.; Spence, R. D.; Ferrell, J. K. A method for the dynamic measurement of diffusivities of gases
553
in polymers. J. Polym. Sci. 1975. 19(12), 3193-3200.
554
40. Molenaar, N., and Zijlstra, J. J. P. Differential early diagenetic low-Mg calcite cementation and rhythmic
555
hardground development in Campanian-Maastrichtian chalk. Sediment. Geol. 1997, 109(3-4), 261-281.
556
41. Slimani, H. New species of dinoflagellate cysts from the Campanian-Danian chalks at Hallembaye and
557
Turnhout (Belgium) and at Beutenaken (the Netherlands), J. Micropalaeontol. 2001, 20 (1), p. 1–11,
558
DOI:10.1144/jm .20.1.1.
559
42. Strand, S.; Hjuler, M. L.; Torsvik, R.; Pedersen, J. I.; Madland, M. V.; Austad, T. Wettability of chalk: impact
560
of silica, clay content and mechanical properties. Petrol. Geosc. 2007, 13(1), 69-80.
561
43. Nermoen, A.; Korsnes, R. I.; Hiorth, A.; Madland, M. V. Porosity and permeability development in
562
compacting chalks during flooding of nonequilibrium brines: Insights from long-term experiment. JGR:
563
Solid Earth 2015, 120(5), 2935-2960.
564
44. Rutt, H. N. and Nicola, H. J. Raman spectra of carbonates of calcite structure. Phys. C: Solid State Phys. 1974,
565
45. Bischoff, W. D.; Sharma, S. K.; MacKenzie, F. T. Carbonate ion disorder in synthetic and biogenic magnesian
567
calcites: a Raman spectral study. Am. Mineral. 1985, 70(5-6), 581-589.
568
46. Herman, R. G.; Bogdan, C. E.; Sommer, A. J.; Simpson, D. R. Discrimination among carbonate minerals by
569
Raman spectroscopy using the laser microprobe. Appl. Spectrosc.1987, 41(3), 437-440.
570
47. Edwards, H.; Villar, S.; Jehlicka, J.; Munshi, T. FT–Raman spectroscopic study of calcium-rich and
571
magnesium-rich carbonate minerals. Spectrochim. Acta A, 2005; 61, 2273.
572
48. Korsakov, A.; De Gussem, K.; Zhukov, V. P.; Perraki, M.; Vandenabeele, P.; Golovin, A. V.
Aragonite-573
calcite-dolomite relationships in UHPM polycrystalline carbonate inclusions from the Kokchetav Massif,
574
northern Kazakhstan. Eur. J. Mineral. 2009, 21, 1301.
575
49. Borromeo, L.; Zimmermann, U.; Andò, S.; Coletti, G.; Bersani, D.; Basso, D.; Gentile, P.; Schulz, B. and
576
Garzanti, E. Raman spectroscopy as a tool for magnesium estimation in Mg-calcite. JRS. 2017a, 48(7),
983-577
992.
578
50. Dandeu, A.; Humbert, B.; Carteret, C.; Muhr, H.; Plasari, E.; Bossoutrot, J. M. Raman Spectroscopy – A
579
Powerful Tool for the Quantitative Determination of the Composition of Polymorph Mixtures: Application
580
to CaCO3 Polymorph Mixtures. Chem. Eng. Technol. 2006; 29, 221.
581
51. Carteret, C.; De La Pierre, M.; Dossot, M.; Pascale, F.; Erba, A.; Dovesi, R. The vibrational spectrum of
582
CaCO3 aragonite: A combined experimental and quantum-mechanical investigation. J. Chem. Phys. 2013;
583
138, 014201.
584
52. Sun, J.; Zeguang, W.; Hongfei, C. A Raman spectroscopic comparison of calcite and dolomite, Spectrochim.
585
Acta A, 2014; 117, 158.
586
53. Purgstaller, B.; Mavromatis, V.; Immenhauser, A.; Dietzel, M. Transformation of Mg-bearing amorphous
587
calcium carbonate to Mg-calcite – In situ monitoring. Geoch. Et Cosmoch. Acta, 2016, 174, 180–195.
588
54. Krishnan, R. S. Proc. Math. Sci. 1945; Part. I: Calcite, 182.
589
55. White, W.B., In Infrared Spectra of Minerals, V.C. Farmer Eds. Mineralogical Society Monograph 4,
590
Mineralogical Society, London, England, 1974a, pp 87–110.
591
56. White, W.B., In Infrared Spectra of Minerals, V.C. Farmer Eds. Mineralogical Society Monograph 4,
592
Mineralogical Society, London, England, 1974b, pp 227– 284.
593
57. Gillet, P.; Biellmann, C.; Reynard, B.; McMillan, P. Raman spectroscopic studies of carbonates Part I:
High-594
pressure and high-temperature behaviour of calcite, magnesite, dolomite and aragonite. Phys. Chem.
595
Minerals 1993; 20 (1), 1-18.
596
58. Urmos, J.; Sharma, S. K.; Mackenzie, T. Characterization of some biogenic carbonates with Raman
597
spectroscopy, Am. Mineral. 1991; 76, 641.
598
59. Minde, M. W.; Haser, S.; Korsnes, R. I.; Zimmermann, U.; Madland, M. V. Comparative Studies of
599
Mineralogical Alterations of Three Ultra-long-term Tests of Onshore Chalk at Reservoir Conditions. In IOR
600
2017-19th European Symposium on Improved Oil Recovery 2017, 2017.
601
60. Minde, M. W.; Zimmermann, U.; Madland, M. V., Korsnes, R. I. Submicron investigations –What can we
602
learn? IOR Norway 2016, Stavanger, 2016.
603
61. Borromeo, L.; Minde, M.; Toccafondi, C.; Zimmermann, U.; Andò, S.; Ossikovski R. A New Frontier
604
Technique for Nano-analysis on Flooded Chalk-TERS (Tip Enhanced Raman Spectroscopy). In IOR
2017-605
19th European Symposium on Improved Oil Recovery. 2017b.
606
62. Borromeo, L.; Toccafondi, C.; Minde, M.; Zimmermann, U.; Andò, S.; Madland, M. V., Korsnes, R. I.
607
Ossikovski R. Application of Tip Enhanced Raman Spectroscopy in the nanoscale characterization of
608
flooded chalk. Submitted to Minerals, January 2018;
609
63. Egeland, N.; Minde, M.W.; Kobayashi, K.; Ota, T.; Nakamura, E.; Zimmermann, U.; Madland, M.W. and
610
Korsnes, R.I.. Quantification of Mineralogical Changes in Flooded Carbonate under Reservoir Conditions.
611
In IOR 2017-19th European Symposium on Improved Oil Recovery. 2017.
612
64. Frezzotti, M. L.; Tecce, F.; Casagli. A. Raman spectroscopy for fluid inclusion analysis, J Geochem Explor.
613
2012, 112, 1–20;
614
65. Wang, A.; Freeman, J. J.; Jolliff, B. L. Understanding the Raman spectral features of phyllosilicates, JRS,
615
2015, 46, 829–845.
616
66. Egeland, N. Raman Spectroscopy Applied to Enhanced Oil Recovery. University of Stavanger, unpublished
617
MSc thesis, 2015.
618
67. Gorelik, V. S.; Chervyakov, A. V.; Kol'tsova, L. V.; Veryaskin, S. S. Raman Spectra of Saturated
619
68. Costa, J. C. S.; Sant’Ana, A. C.; Corio P; Temperini, M. L. A. Chemical analysis of polycyclic aromatic
621
hydrocarbons by surface-enhanced Raman spectroscopy. Talanta 2006, 70, 1011-1016.
622
69. Sebek, J.; Pele, L.; Potma, E. O.; Gerber, R. B. Raman spectra of long chain hydrocarbons: anharmonic
623
calculations, experiment and implications for imaging of biomembranes. PCCP, 2011, 13, 12724-12733.
624
70. Andrews, A. B.; Wang D.; Marzec, K. M.; Mullins, O. C.; Crozier, K. B. Surface enhanced Raman
625
spectroscopy of polycyclic aromatic hydrocarbons and molecular asphaltenes. Chem. Phys. Lett. 2015, 620,