A Study of Remote Visual Methods to Detect Cracking in Reactor Components
Stephen E. Cumblidge, Michael T. Anderson, Steven R. Doctor, Fredric A. Simonen, Pacific Northwest National Laboratory, Richland, WA 99352*
Anthony J. Elliott, Oregon State University Corvallis, OR 97331
ABSTRACT
Recently, the U.S. nuclear industry proposed replacing current volumetric and/or surface examinations of certain components in commercial nuclear power plants, as required by the ASME Boiler and Pressure Vessel Code (ASME Code) Section XI, Inservice Inspection of Nuclear Power Plant Components, with a simpler visual testing (VT) method. The advantages of VT are that these tests generally involve much less radiation exposure and examination times than do volumetric examinations such as ultrasonic testing (UT). PNNL conducted a parametric study that examined the important variables influencing the effectiveness of a remote visual test. Tested variables included lighting techniques, camera resolution, camera movement, and magnification. PNNL also conducted a limited laboratory test using a commercial visual testing camera system to experimentally determine the ability of the camera system to detect cracks of various widths under ideal conditions. The results of these studies and their implications are presented in this report.
INTRODUCTION
Visual testing is widely used as a primary inspection technique or to provide complementary information for other, more indirect nondestructive examination (NDE) methods. The human eye is highly adept at detecting small features or irregularities on the surfaces of materials, and direct VT, if applied under specific parameters, with appropriate optical tools and lighting, can exhibit highly reliable inspection results. Many VT applications use remotely-operated video camera systems due to factors such as the location, size, and geometry of the parts or adverse environment surrounding the surfaces to be inspected. Because VT appears to be fundamentally simple and straightforward and remote VT systems are convenient to deploy for periodic inspections, greater reliance is being placed on VT to determine the structural integrity of nuclear power plant components. However, the variables associated with VT and systems used are often times not well defined. A better understanding is required in order to determine their overall capabilities and limitations in detecting the targeted degradation.
Nuclear utilities today follow guidelines for remote VT found in the Electric Power Research Institute (EPRI) BWR Vessel and Internals Project-03[1]. These guidelines specify that examined surfaces must be clean, and for underwater testing, that the water be clean and clear. The BWRVIP guidelines also describe training requirements for personnel and specify which areas around a weld should be examined, how to measure the sizes of indications found, and how to test the resolving power of the visual equipment used for the test. There are no guidelines dealing with scanning speed or field of view used during the inspection. To test the visual acuity of the camera system and lighting, the EPRI guidelines call for the camera system to image a sensitivity, resolution, and contrast standard (SRCS) before and after the inspection. This SRCS typically contains two perpendicular wires 12 µm (0.0005 in.) in diameter as a resolution calibration standard.
Few comprehensive studies of the probability of various video systems used for remote VT to detect cracks relative to crack opening displacement (COD) have been published to date. A visual system was used in Sweden to test crack detectability in reactor components, and the reported detectable limit for flaws was 20 µm (0.0008 in.)[2]. Useful
information on the evaluation of remote VT was also found in a recent human factors study performed in Sweden[3]. Cracks larger than 40 µm (0.0016 in.) COD were detected easily, while cracks less than 20 µm (0.0008 in.) COD had, at best, a 20% probability of detection using the “Lenient” grading scale defined by Enkvist (2003). A study on the detectability of tight thermal fatigue cracks [4] under normal inspection conditions was performed using a commercially available remote camera system. This study determied that the smallest cracks that could be reliably detected were 100 µm (0.0039 in.) COD or larger, and the smallest defects possible to detect were 40 µm (0.0016 in.) COD. The detection rate for cracks smaller than 100 µm (0.0039 in.) COD was approximately 20%.
PNNL conducted a study on the effects of various parameters on the ability of a mechanical system to image cracks on a stainless steel surface. This paper expands on the work performed earlier by Pacific Northwest National Laboratory[5]
*
for the NRC (NUREG/CR-6860). The work has been aimed at nuclear power plant components; however, these issues exist for all industries where remote VT is expected to reliably detect small flaws.
PARAMETRIC STUDY
The interplay between lighting technique, surface conditions, and crack CODs were explored in a matrix of 192 examinations. This matrix was constructed using nine samples with six CODs, four surface conditions, and six lighting conditions. Each sample was examined in the following conditions: as-received, polished, and with scratches perpendicular and parallel to the cracks. All examinations were performed at the same magnification and with the same resolution setting, 1.3 megapixels.
The most rigorous method of testing each of the inspections would be to have a series of inspectors make calls on the cracked surfaces for each inspection condition. This would be impractical for the number of conditions examined, however. A subjective evaluation was made by one inspector for each condition and the results tabulated. The inspector gave four levels of crack detectability—excellent, good, fair, and poor. This matrix is designed to show general trends for crack detection to help gain an understanding of the complexities of the interactions between and among crack size, surface conditions, and lighting technique.
Lighting Style
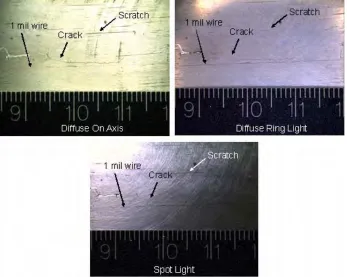
Lighting style can strongly affect all three factors in crack detection. Three lighting styles were used in the
parametric study—bare-bulb LED and incandescent spotlights, a diffuse ring light, and a diffuse on-axis light. Examples of a crack illuminated with each technique using the Lightwise 1.3-megapixel video camera are given in Figure 1. The results from the parametric matrix are shown in Table 1. The results show that the diffuse on-axis light provides the best lighting for crack detection. Surprisingly, the spotlighting was comparable to the diffuse ring lighting. While the ring light is somewhat better, spotlights from several directions is comparable. If one can get the spotlights parallel to the crack, one can get better illumination than with the ring light; but when the spotlighting is perpendicular to the crack, the lighting is relatively ineffective.
Table 1: Matrix Results for Lighting Techniques
Lighting Style Excellent Good Fair Poor Diffuse Axis 56.7% 13.3% 23.3% 6.7% Diffuse Ring 33.3% 6.7% 16.7% 43.3%
Spot Average 18.0% 25.8% 11.7% 44.5%
Scanning Speed
The effects of scanning need to be quantified for the actual inspection conditions. Every camera is different, and how a given camera will respond to scanning speed is very strongly dependent on several factors. When describing camera motion, defining the camera speed is complex. The effects of camera motion on image sharpness are a function of the camera speed, the distance between the camera and the subject, the focal length of the lens, and the exposure time used to take the image. When one is taking images from a moving automobile, objects close to the car can be very blurred while objects very far away would remain sharp. For a digital camera, the ultimate arbiter of the effect of camera motion is the distance a pixel is scanned over the course of the exposure.
Scanning over a surface can have effects on both the contrast and the resolution of the image captured by a camera. The loss of contrast and resolution are caused by the pixel imaging a larger area than it would in a stationary image. The area imaged by each pixel, and the resulting loss in contrast and resolution, increase as the scanning speed and exposure time increases. A video camera in low light produces noticeable loss of acuity when moved even at slow speeds.
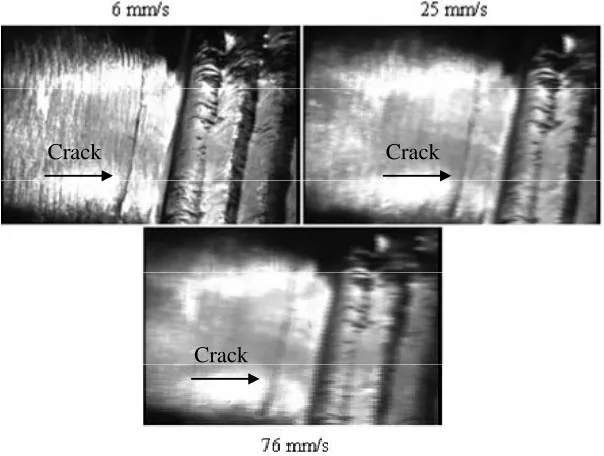
The radiation-hardened pan/tilt/zoom camera was scanned at speeds ranging from 6 mm/s to 76 mm/s (0.24 to 3.0 in./s) over a 125-µm (0.005 in.) COD crack, and the resulting images were examined. Example images from this experiment are given in Figure 2. Slow scanning appeared to cause little distortion in the image, while scanning at 76 mm/s caused gross distortion in the image.
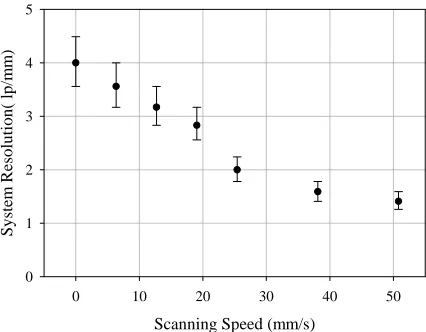
For the resolution tests, the camera was scanned over a 1951 Air Force resolution target, and the camera resolution was recorded for each pass. The smallest resolvable group and element number were recorded, as well as the corresponding number of lines per millimeter. The theoretical maximum resolution for the magnification was 4.7 lp/mm, which is close to the 4 lp/mm that was obtained on a stationary target. A graph of the results of the scanning speed versus resolution
experiment is given in Figure 3. It must be stressed that these results are for a given radiation-hardened camera under one set of conditions, but the results for another camera under other conditions may be different.
The scanning experiment shows that the resolution loss at slow speeds such as 6 mm/s (0.24 in.) do not greatly reduce the resolution of the system, while scanning at higher speeds reduces the resolution to less than half the acuity of a stationary camera.
Crack
Crack
Crack
Scanning Speed (mm/s)
0 10 20 30 40 50
S
y
ste
m
Resolution(
lp/m
m
)
0 1 2 3 4 5
Figure 3: Effects of Scanning Speed on Resolution of Radiation-Hardened Camera
Crack Opening Displacement/Crack Size
As the COD increases, all three main parameters, contrast, recognition, and discrimination between the crack and innocuous features, are improved. The COD affects primarily the contrast between the crack and the background when one is using brightfield lighting. In almost all cases, the contrast between the crack and the background increases as the crack COD increases. Also, the crack becomes more easily recognized as a crack as it gets larger. Crack tortuosity and possible branching are often easier to recognize. Finally, the crack is much more easily discriminated compared to the surface conditions, such as scratches and machining marks, as the COD increases. When a crack COD is larger than the size of the scratches or geometrical effects, it is less likely to be confused for an innocuous feature.
As crack length increases, the crack becomes easier to detect as the inspector has more length over which to recognize the crack. The contrast between the crack and the background is not improved by crack length, however. A short crack with a large COD (<100 µm or <0.004 in.) is easier to detect than a long crack with a very small COD (<20 µm or 0.0008 in.).
The parametric matrix results show a strong effect of the COD on crack detectability, as shown in Table 2. Cracks larger than 100 µm (0.004 in.) are usually detectable, while cracks less than 20 µm (0.0008 in.) are usually very difficult to detect even under optimized conditions. The detectability of the middle range of 20- to 100-µm COD cracks depends strongly on the lighting and surface conditions and does not show any clear trend.
A long crack with a wide COD (≥100 µm) can usually be detected on a bad surface with a low-resolution camera under poor lighting conditions. The only time when such a crack becomes difficult to detect is when one is panning the camera quickly over the cracked area.
Table 2: Effects of Crack COD on Crack Detectability
COD (µm) Excellent Good Fair Poor
<20 2.1% 14.6% 10.4% 72.9%
20–40 31.3% 22.9% 16.7% 29.2%
40–100 22.9% 27.1% 16.7% 33.3%
100+ 47.9% 16.7% 12.5% 22.9%
LABORATORY TEST RESULTS
Fixed-Focus Camera Test Results
target was performed at the conclusion of a camera test. The inspectors were allowed to call detected indications as definite cracks or as areas of interest (AOI).
In the most lenient case, it was assumed that all indications noted as areas of interest were called correctly; that is, all cracks that were noted were counted as a hit, and all scratches that were called areas of interest were left blank. The strict method of grading counted only definite hits on actual cracks. As this study is focused on crack detectability using these cameras and not on the overall reliability of visual testing, the inspectors were not penalized for false calls. Also, given the areas they were scanning and that the grader knew exactly where the flaws were and what they looked like, it was next to impossible for a false call to be counted as a hit.
The false call rates for the PNNL staff were very high. The high level of vigilance, extra time taken on the test, and propensity to make false calls did not help the PNNL staff to find more cracks than the outside contractors, as their hit rates were roughly equivalent. Also, two of the four testers took 2.5 hours to complete the test, while one took 4.5 hours. The extra time did not allow this tester to score better than a tester who took 2.5 hours.
The crack detection results were added and averaged. To determine the effects of COD on crack detectability, the crack CODs were characterized in four categories—less than 20 µm (less than 0.0008 in.), 20–40 µm (0.0008–0.0016 in.), 40–100 µm (0.0016–0.004 in.), and greater than 100 µm (0.004 in.), and the hit rates were determined. The results are summarized in Table 3.
Table 3: Probability of Detection Versus Crack COD Results Using Fixed-Focal Length Camera
Probability of Detection Crack Size Lenient Strict
<20 µm 6 ± 6% 0 ± 6%
20–40 µm 37 ± 11% 11 ± 7%
40–100 µm 42 ± 11% 32 ± 11%
100–150 µm 92 ± 8% 92 ± 8%
In summary, the very tight cracks were not reliably detected, the large cracks were easily detected, and the medium cracks were difficult but possible to detect.
Pan/Tilt/Zoom Camera Results
For the pan/tilt/zoom camera tests, the camera was situated 65 mm (2.6 in.) above the samples. The inspector was free to scan the areas using the pan/tilt/zoom features of the camera. The imaged area ranged from 75 mm by 50 mm (3 × 2 in.) at the minimum magnification and 25 mm by 17 mm (1 × 0.67 in.) at the maximum magnification. Again, each test was preceded and concluded with the 12-µm (0.0005-in.) wire test and a resolution test using a 1951 Air Force resolution target. The samples were examined by three of the four inspectors. The results from the inspections are provided in Table 4.
Table 4: Probability of Detection Versus Crack COD Results Using the Pan/Tilt/Zoom Camera
Strict Lenient False Calls Time taken
PNNL Inspector 1 70% 76% 5 4.5 hr
Contractor 1 35% 35% 0 2 hr
Contractor 2 29% 29% 0 2 hr
For this test, the statistics do not tell the entire story. The outside contractors hired to perform the tests each completed the test in slightly less than 2 hours, and each of the contractors found only the largest of cracks. Virtually all cracks smaller than 100 µm (0.004 in.) were missed by both inspectors, and their hit rate is more a function of the crack size distribution in the test than any other effect. The PNNL staff member took 4.5 hours to complete the test but was able to find all cracks greater than 20 µm (0.0008 in.) in width. It was clear that the test was not testing the abilities of the camera but of how much time and vigilance was being put into the test. When set to maximum magnification, the pan/tilt/zoom camera itself was able to get good images of all cracks over 20 µm in COD.
using the fixed focal length camera made only five using the pan/tilt/zoom camera. Five false calls are still far too many, but it is a large improvement over 11. The two outside contractors were able to get through the test making no false calls at all. The pan/tilt/zoom camera provided the inspectors with much more control than the fixed focal length camera, allowing them to have greater confidence in their calls.
Conditions in Reactors
The visual tests performed in the field are generally not performed on clean, flat samples. The welds are often in as-welded conditions with weld beads and weld toe intact. The surfaces are not polished smooth and have a variety of scratches, grinding marks, and machining marks. Some cladding styles leave ripples along the surfaces. Also, the surfaces are usually covered in oxide material.
The stainless steel reactor internals in operating BWRs and PWRs usually are covered by a surface layer of deposits. This layer of deposits is made up of colloidal corrosion products from the primary water. These corrosion products are a mix of oxides, consisting of Fe2O3, Fe3O4, Fe2CoO4, Fe2NiO4, and other metal oxides. BWRs have highly oxidizing conditions in the primary system and the deposits tend to consist primarily of Fe2O3 (hematite). The deposits in PWRs tend to be primarily M3O4, with M being made up of Fe, Ni, and Co [6].
BWRs primarily have red hematite-based deposits on all internal components. In PWRs, which have magnetite-based deposits, one sees dark grey or black deposits on internals components. The deposits usually accumulate in two layers, an adherent layer on the metal surface and a loose layer on top of the adherent layer. The loose layer can usually be removed with a brush or water jet, while the adherent layer requires aggressive methods such as wire brushing or acid etching to remove it. For practical purposes during visual testing in a reactor, soft brushing or hydrolasing is convenient to remove the loose layer and leave the adherent layer. Also, as virtually all visual testing is performed using spot lighting, removing the adherent layer and exposing a highly specular surface would severely degrade the inspectability of the cleaned components.
DISCUSSION
To determine if a remote VT system is capable of detecting actual cracks, a discussion of typical service-induced crack dimensions is needed. The primary feature of a crack to be visually detected is its width, or COD. The COD is a function of several factors, some of which are material hardness, applied loads, crack length, residual stresses around the crack opening, and the degree of corrosive attack at the crack opening. The specific variables of most importance to COD depend on the type of crack involved. For instance, literature reports that the width of intergranular stress corrosion cracking (IGSCC) is fairly random and is primarily a factor of how many grain boundaries at the crack opening are affected.
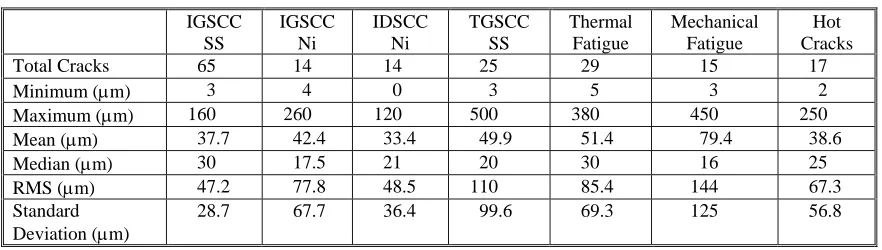
Several hundred cracks of various types and origins in many materials have been characterized and documented in the literature in the United States and in Europe[7]. The results show that the CODs of inservice-generated cracks are highly variable over most crack types and materials, and several outlier sizes were found that increase the range of the datasets. However, it was found that most reported CODs tend to be populated around a mean, or median, crack width. Table 5 provides a compilation of COD ranges for various types of service-induced degradation.
Table 5: Crack Widths in Stainless Steel Service-Degraded Components
IGSCC SS
IGSCC Ni
IDSCC Ni
TGSCC SS
Thermal Fatigue
Mechanical Fatigue
Hot Cracks
Total Cracks 65 14 14 25 29 15 17
Minimum (µm) 3 4 0 3 5 3 2
Maximum (µm) 160 260 120 500 380 450 250
Mean (µm) 37.7 42.4 33.4 49.9 51.4 79.4 38.6
Median (µm) 30 17.5 21 20 30 16 25
RMS (µm) 47.2 77.8 48.5 110 85.4 144 67.3
Standard
Deviation (µm) 28.7 67.7 36.4 99.6 69.3 125 56.8
Parametric Study
The parameter that appeared to have the largest effect on detection reliability is the crack COD. The parametric study results and the other examinations showed that cracks with CODs above 100 µm (0.004 in.) are usually detectable unless the inspection parameters and surface conditions are very unfavorable. Cracks with CODs less than 20 µm (0.0008 in.) were difficult to detect under all but the most favorable conditions.
Between these two extremes in crack COD, results become more difficult to quantify. When the other parameters are considered, the parametric study showed little difference in the reliability in detecting cracks between 20–40 µm (0.0008– 0.0016 in.) and 40–100 µm (0.0016–0.004 in.). How well one can detect these cracks appears to be very dependent on the other factors in the test.
The parametric study pointed to the factors that most affect the quality of the inspections. The most important factor is scanning speed. Higher scanning speeds severely limit crack detection capability with the result that only large cracks can be reliably detected. The parametric study suggests that reliable inspections should be limited to the use of stationary or very slowly moving cameras (6 mm/s in our tests). While very slow scanning does not appear to greatly reduce the resolving power of the camera and contrast of indications, higher scanning speeds can severely lower the quality of an inspection.
The second most important factor is lighting. Current practice is to use one or two fixed spotlights. This may lead to missed cracks. When spotlights are misaligned relative to the crack orientation, they can effectively hide even larger cracks. Properly aligned spotlights can be as effective as a diffuse ring light, but unfortunately one does not know the orientation of the cracks ahead of time. The parametric study shows that diffuse on-axis light produced by far the best results. The diffuse on-axis light is likely not practical for use in a reactor environment, but some engineering work may lead to development of a system that is equally as effective and that can be used in a reactor environment.
The following factors would have less impact on visual testing than those discussed above, but are important nonetheless. A higher-resolution radiation-hardened camera would greatly help in detecting small cracks, as the greater pixel count would allow for a higher contrast between the crack and the metal surface and would enhance discrimination between cracks and innocuous surface features such as scratches and machining marks. In addition, the current CCTV resolution standard of 400–500 lines vertical can almost certainly be improved.
Laboratory Tests
In the study, cracks with CODs larger than 100-µm (0.004-in.) wide were readily detected. This was independent of the lighting, scanning technique, and magnifications used in the tests. No system was able to reliably detect cracks with CODs smaller than 20 µm (0.0008 in.) in width. This included the PNNL use of the pan/tilt/zoom camera system and a very vigilant inspector under nearly ideal conditions.
The quality of the examinations and camera systems was of great importance in the reliability of detecting cracks with CODs between 20–100 µm (0.0008–0.004 in.). Careful inspections using good lighting and stationary cameras allowed good detection of the smaller cracks, while quick scanning resulted in very poor crack detection in this range of crack sizes. There is good agreement among results of the parametric study, the limited round-robin, the Swedish human factors study, and the Finish camera test—all agree that large cracks can be defined as cracks with a COD larger than 100 µm (0.004 in.), tight cracks can be defined as cracks with a COD smaller than 20 µm (0.0008 in.), and the mid-range cracks fall in between these values.
This mid range of 20 µm to 100 µm (0.0008 in. to 0.004 in.) is problematic, as many types of cracks have a median crack COD on the order of 16–30 µm (0.0006–0.0012 in.). This suggests that a significant fraction of potential cracks in nuclear reactors approach the low end of what the current equipment and procedures are capable of finding under ideal conditions. Careful inspections using good lighting and stationary cameras allowed good detection of the tight cracks, while quick scanning resulted in very poor crack detection in this range of crack COD sizes. The higher magnification used in the Swedish study was one reason why it may have found higher performance for crack detection in this range when compared to the PNNL study using the fixed-focus camera.
CONCLUSIONS
Based on the results achieved in both the parametric and laboratory studies, the following conclusions can be drawn:
• The current radiation-hardened video cameras being used in the field are not capable of effectively detecting cracks with CODs smaller than 20 µm (0.0008 in.).
• The reliability of detecting cracks with CODs between 20 and 100 µm (0.0008 and 0.004 in.) using current radiation-hardened video cameras is strongly dependent on the camera magnification, lighting, inspector training, and inspector vigilance.
• The scanning rate of a video camera over a surface strongly affects the visual acuity of the camera. At low speeds, the camera suffers little loss of visual acuity, but at high rates, the image becomes severely degraded.
• Diffuse lighting helps to increase the contrast between a crack and the metal surface while decreasing the contrast from scratches and machining marks in the metal surface.
• Although the oxide layer in reactors can aid in crack detection, the overall effects of the oxide layer are not known and need to be understood regarding influence on crack detectability.
REFERENCES
1 Electric Power Research Institute. 2005. BWRVIP-03 Revision 8: BWR Vessel and Internals Project – Reactor Vessel Pressure Vessel and Internals Examination Guidelines. TR-105696-R8, Palo Alto, California.
2 Efsing P, J-Å Berglund, C Sandelin and A Werner. 2001. “Visual inspection of brackets for emergency core cooling system in Barsebäck Unit 2.” In Proceedings of the 3rd International Conference on NDE in Relation to Structural Integrity for Nuclear and Pressurized Components, pp. C 25–32. November 14–16, 2001, Seville, Spain. Tecnatom s.a., Seville.
3 Enkvist J. 2003. “A study of operator performance in a visual NDT inspection task by remote video camera.” Insight
45(4):252-257.
4 Virkkunen I, P. Seppälä, D.S. Dybal, and A.A. Nikitin. 2004. Cracked samples for visual testing. 286AER002, Trueflaw Ltd., Espoo, Finland. Available at http://www.trueflaw.com/Publications/SamplesForVisual.pdf (September 2006).
5 Cumblidge SE, MT Anderson and SR Doctor. 2004. An Assessment of Visual Testing. NUREG/CR-6860, U.S. Nuclear Regulatory Commission, Washington, D.C. Available at
http://www.nrc.gov/reading-rm/doc-collections/nuregs/contract/cr6860/index.html (September 2006).
6 Kim K, H-J Lee, D-W Kanga and S Inoue. 2003. “Synthesis of simulated cruds for development of decontaminating agents.” Nuclear Engineering and Design 223:329–337.