ABSTRACT
KEARNS, BENJAMIN TAFT. A Propensity Score Matching Study of Community College Athletics (Under the direction of Dr. James Bartlett).
College athletics can be a contentious idea among educators, especially those who question its value with respect to institutions of higher learning. This study implemented propensity score matching to study what impact being a student athlete had on athletes attending a community college.
Much of the literature on community college athletics focuses on funding issues and what impact athletics has on student support services, but nothing reports how student athletes are performing compared to their non-athlete peers. This study is significant because it examines the impact that student athletes have on outcomes like GPA, transfer rates, and what developmental courses are taken. Demonstrating the value of these outcomes can help community college administrators as they plan for their athletic programs.
The population for this study consisted of community college students at a medium sized community college located in the southeastern part of the United States. The major research questions of this study examined the characteristics of the student athletes and non-athletes at this community college. Characteristics include hours attempted, developmental coursework attempted, GPA, and transfer to a four-year school.
The study implemented propensity score matching. This allowed for the creation of balanced groups of students to see what impact being a student athlete had. The students were matched on age, financial aid status, gender, and educational goals. The results
A Propensity Score Matching Study of Community College Athletics
by
Benjamin Taft Kearns
A dissertation submitted to the Graduate Faculty of North Carolina State University
in partial fulfillment of the requirements for the degree of
Doctor of Education
Adult and Community College Education
Raleigh, North Carolina 2019
APPROVED BY:
____________________________ ____________________________
Dr. James Bartlett Dr. Bobbie Frye
Committee Chair
____________________________ ____________________________
ii
DEDICATION
iii
BIOGRAPHY
Ben Kearns is a native of Pinebluff, North Carolina. He completed his undergraduate studies at East Carolina University where he earned a Bachelor of Arts in Philosophy with a minor in Business. Ben attended the University of South Carolina where he earned a Master of Library and Information Science degree and Western Carolina University where he earned a Master of Science in Mathematics.
Ben has worked a variety of jobs including being a university public services librarian, a university math tutoring center coordinator, a university math instructor, and a community college math instructor. Ben enjoys being in the classroom and the challenges of getting students to engage and enjoy math. Ben’s primary research area is examining
iv
ACKNOWLEDGMENTS
Thanks go out to my dissertation chair, Dr. James Bartlett. His overall support and initial brainstorming helped take a vague idea and streamline it into something that I enjoyed learning more about. I also want to thank my dissertation committee members who took time out of their busy schedules to contribute: Dr. Diane Chapman, Dr. Jayne Fleener, Dr. Chad Hogan, and Dr. Bobbie Frye.
I want to give special thanks to Dr. Bobbie Frye, who not only served on my
dissertation committee but helped me make that final push to get done. I would not have been able to finish if not for her patience and gift of time and being a sounding board for the data analysis.
v
TABLE OF CONTENTS
LIST OF TABLES ………..………. ix
LIST OF FIGURES ………..…….... x
CHAPTER ONE: Introduction ………..…….……….. 1
Governance ……….……….. 2
Scholarship Aid ……… 2
Campus Setting ……….……… 3
Gender Equity of Programs ……….. 3
Statement of the Problem ………. 4
Purpose of the Study ……… 5
Theoretical Framework ……… 6
Conceptual Framework ………... 11
Research Questions and Research Methods ……….………….. 12
Research Questions ……….…….... 12
Research Methods ……….. 13
Significance of the Study ………... 14
Limitations ………. 15
Delimitations ….………. 16
Definition of Terms ……… 17
Summary ……… 19
CHAPTER TWO: Literature Review ………..………... 21
Context of Community College Athletics Literature ……….……… 21
vi
Emerging Topic ……….………. 22
Observations ……….……….. 22
Research Areas ………... 24
Seminal Works ………...… 29
Theoretical Frameworks ……….………...…………. 30
Theoretical Frameworks Used in Study ………. 33
Positivism ……….……….. 34
Contingency Theory ………... 35
Propensity Score Matching in Educational Research ………. 36
Summary ………...………. 38
CHAPTER THREE: Methods ……… 39
Propensity Score Analysis Overview ……….. 39
Application to Research Topic ……… 41
Population in the Study ………... 42
Construction of the Data Set ………... 43
Recoding Variables ……….… 43
Data Analysis ……….…. 44
Pre-Screening Data ………...…….. 45
Covariate Identification ……….. 45
Propensity Score Estimation ……….……….. 45
Propensity Score Match and Selecting ……….……….. 46
Assessing the Quality of the Match ……… 46
vii
CHAPTER FOUR: Results …..……….. 48
Data Analysis ……….………. 48
Two-Year Outcomes ……….. 57
Summary ……… 59
CHAPTER FIVE: Discussion …..……..……… 60
Conclusions and Discussion ……….. 61
Research Question 1 ………... 61
Research Question 2 ………... 62
Research Question 3 ………... 63
Research Question 4 ………... 64
Research Question 5 ………... 64
Recommendations for Practice and Research ……… 65
Recommendations for Practice ………... 65
Recommendation 1 ………. 65
Recommendation 2 ………. 66
Recommendation 3 ………. 68
Recommendation 4 ………. 69
Recommendation 5 ………. 71
Implications for Practice ………. 71
Recommendations for Research ………. 73
Recommendation 1 ………. 73
Recommendation 2 ………. 74
viii
Recommendation 4 ………. 75
Recommendation 5 ………. 76
Limitations ……….. 76
Conclusion ……….. 78
ix
LIST OF TABLES
Table 1. Publication Dates of Articles, Dissertations, and Theses ………. 23
Table 2. Breakdown of States Represented in Dissertations/Theses ………. 24
Table 3. Coding Method and Occurrences ……… 25
Table 4. Top Cited Resources on Community College Athletics …….………. 29
Table 5. Middle Range Theories Used in Dissertations ……… 33
Table 6. Covariate Variable Types and Coding Schemes ………. 44
Table 7. Outcome Variable Types and Coding Schemes ……….. 44
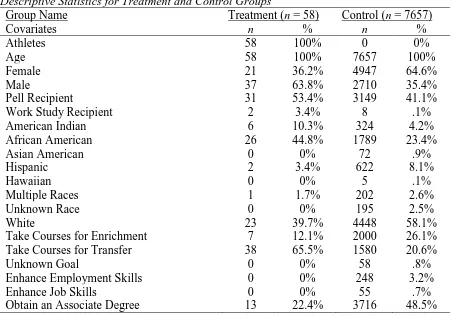
Table 8. Descriptive Statistics for Treatment and Control Groups ……… 50
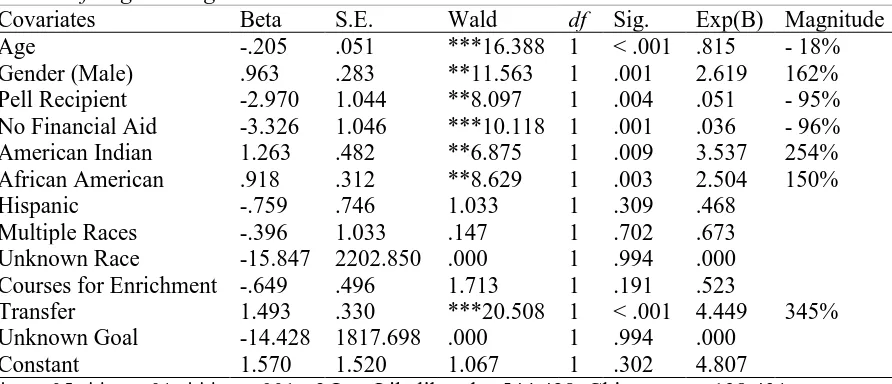
Table 9. Results of Logistic Regression Covariates in the Model ………. 52
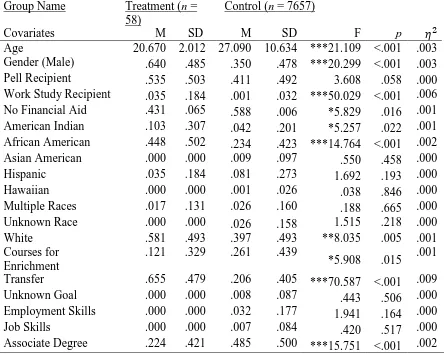
Table 10. Group Mean and Standard Deviation Characteristics of Covariates Before Propensity Matching ……….……….. 54
Table 11. Group Mean and Standard Deviation Characteristics of Covariates After Propensity Matching ………..……… 55
Table 12. Percent Share of Sum of Means Before and After Matching ……….… 57
Table 13. Outcomes for T-test of Control and Treatment Groups After Propensity Score Matching ………..……… 58
x
LIST OF FIGURES
Figure 1. Contingency Theory mapping of potential organizational and environmental
variables in relationship to the covariates and outcomes being studied. ……….. 10 Figure 2. Map of conceptual framework showing the population, covariates, propensity
score matching, and outcomes being studied. ………..…. 12 Figure 3. Percentage share (bound by 0 – 100%) of the sum of each covariate mean for
the treatment and control group across characteristics of certain covariates before propensity score matching. Notice that the group means are not
equally balanced among the covariates in each group. ………. 56 Figure 4. Percentage share (bound by 0 – 100%) of the sum of each covariate mean for
1
CHAPTER ONE: INTRODUCTION
College athletics can be contentious among educators as some question the
educational value athletics bring to institutions of higher learning (Kuga, 1996; Lumpkin, 2008). The notoriety student athletes sometimes achieve off the field and outside the
classroom can provide ammunition to the detractors of athletic programs (Lawrence, Ott, & Hendricks, 2009). Couple that with the apparent arms race to build facilities at many
Division I university programs, and one can see why it is important to exercise caution when choosing to start an athletic program in this day and age (Hoffer, & Pincin, 2016; Tsitsos, & Nixon, 2012). Mirroring their academic counterparts, community college athletics and athletic programs experienced a growth spurt during the early part of the last decade, even though funding and support services are significantly less than the average four-year
university (Ashburn, 2007; Byrd & Williams, 2007; Hines, 2005). This growth continued to occur during the aftermath of the “Great Recession” of 2007 – 2011 (Muir, 2015).
Athletics at United States community colleges date back (surprisingly) prior to World War I (Bush, Castaneda, Hardy, & Katsinas, 2009). What began as a few community or junior colleges fielding track and field teams has blossomed into the current national landscape of community colleges with varying athletic programs. There are now over 700 community college athletic programs in the U.S. (“About the USCAA”, 2016; “About the NWAC”, 2016; “NJCAA Member Colleges”, 2016). The following background will provide insight into governance, scholarship aid, campus setting, and gender equity for the
2
Governance
Governance by a national organization is not as clear cut for community college athletics as it is for athletic programs at universities. The National Collegiate Athletic Association (NCAA) governs all university athletic programs across the country, and policy choices made by the NCAA affect all aspects of these programs. Community college
athletics have a similar governance model in the National Junior College Athletic Association (NJCAA), but there are some notable differences.
The state of California and its 100-plus community college athletic programs has its own governing body, the California Community College Athletic Association (CCCAA), which does not fall under NJCAA governance (“About the CCCAA”, 2016). The states of Washington, Idaho, and Oregon also have their own governing body, the Northwest Athletic Association of Community Colleges (NWAACC), which also does not fall under NJCAA governance. The NWAACC governs 34 community colleges with athletic programs (“About the NWAACC”, 2016).
There are also approximately 30 college athletic programs identified that do not operate under any governing body (Castaneda, Katsinas, & Hardy, 2005). While the NJCAA has governance over the large majority of athletic programs at the community college level, there are potentially minor differences between the governance and by-laws of these three organizations.
Scholarship Aid
3
comprised of programs that offer partial scholarships, which is classified as Division II by the NJCAA. Lastly, programs that offer nothing in the way of athletic scholarships are classified as Division III by the NJCAA. California community colleges offer no scholarships based on athletics, which is equivalent to Division III in the NJCAA. The NWAACC offers partial scholarships, which is equivalent to Division II (Bush et al., 2009).
As a frame of reference, approximately 47 million dollars in athletic scholarship aid was awarded during the 2002-2003 year (Castaneda et al., 2005). In 2005, Bush et al. studied 567 community colleges with athletic programs and found 357 (63%) offered some form of financial aid to their student athletes while 210 (37%) did not (Bush et al., 2009).
Campus Setting
Campus setting is defined as rural, suburban, and urban. The 2005 data provided by Bush et al. show 54% of community college athletic programs are located at rural
institutions, 26% are located in suburban areas, and 20% are in urban centers. One difference between rural and other campus settings is that almost 80% of the rural schools offer some form of athletic financial aid. Research suggests that rural schools are using athletic
scholarships as a means to bolster enrollment numbers (Castaneda et al., 2005; Ashburn, E., 2007).
Gender Equity of Programs
4
public community colleges are subject to Title IX, a fact that has led to more opportunities for women to compete in athletics. As of 2003, men’s teams accounted for roughly 51% of the total number of community college athletic teams, and women’s teams accounted for roughly 49% (Castaneda et al., 2005).
On the surface, this seems reasonably equitable. Closer scrutiny, however, reveals that there is still a marked disparity in the breakdown of participants. Castaneda et al. showed that only 37% of the participants were women and that women only accounted for 42% of the athletic scholarships awarded. The biggest reason for this dissonance between equitable number of teams and inequitable number of participants is football. There is a minimal number of female participants in the sport, if any, and football programs have large team sizes and award a higher percentage of athletic scholarships.
Statement of Problem
Understanding how athletes perform academically in relation to their non-athletic peers is important since the funding for athletic programs is inherently unstable (Byrd & Williams, 2007). Faculty at higher education institutions often perceive student athletes as lacking the educational skills needed to succeed academically (Storch & Ohlson, 2009). If athletes are performing better than their non-athletic peers, then funding for athletics can be easily justified. If athletes are performing worse, then utilizing student support services to help athletes can become a top priority for administrators.
5
acting as a guide on how athletes perform academically in comparison to their non-athletic peers. Undoubtedly, each college that has added or contracted athletics has gathered
information to help in justifying that decision. However, community college administrators could have made decisions based on incomplete data which subsequently could lead to making unnecessary mistakes. Interestingly, a study of community college presidents showed they perceive athletics as being beneficial for a variety of reasons without having any
published empirical research to validate those perceptions (Williams & Pennington, 2006). A study that examines the differences in academic and demographic characteristics of athletes versus non-athletes will allow administrators to be aware of the advantages and disadvantages of having athletic programs and be better informed in their choices, whether it be in starting or maintaining an athletic program.
Purpose Statement
The purpose of this quantitative study is to examine two aspects of community college athletics. Examining the demographics of athletes and non-athletes to determine if there are any significant differences is the first aspect. Demographic examples include gender, ethnicity, age, educational goals, and if the athlete receives financial aid. The second aspect is to examine if being an athlete impacted student outcomes. Examples include overall grade point averages, participation in developmental courses, transfer rates, and credit hours attempted.
6
The student data was collected with the assistance of the Institutional Research Department at the respective community college.
Propensity score matching was used in analyzing the collected student data. Propensity score matching is a technique used to simulate an experimental study when randomization is not possible with observational data (Rosenbaum & Rubin, 1983). Propensity score matching mimics the characteristics of randomized controlled trials, thus reducing selection bias (Beal & Kupzyk, 2014). Selection bias is a concern since there is no experimental control of who is an athlete and who is a non-athlete, which threatens the validity of the study (Pan, 2015). Education studies often lack funding to conduct
randomized trails and for this reason often employ “after the fact” data for analysis (Titus, 2007). When looking at past data, it is hard to account for selection bias or even know why a person selected to be in a particular group. Propensity score analysis is an excellent tool in examining “after the fact” data, which is why it was employed for this study (Beal & Kupzyk, 2014). This study is critical in understanding the value athletics bring to a
community college by examining the academic and demographic similarities and differences between athletes and non-athletes.
Theoretical Framework
The literature surrounding community college athletics was examined to see what frameworks have been used to guide any research already published. This examination indicated possible candidates for theoretical frameworks for this study.
7
middle range, and substantive. After carefully considering the grand and middle range theories from the literature on community college athletics, two theories will guide this study. It was desired to have a grand theory as the overall guiding theoretical framework with a middle range theory to get into the specifics of the variables used for the proposed study. With that idea in mind, the grand theory chosen was Positivism with Contingency Theory being the selected middle range theory.
Positivism
Defining Positivism can be a bit tricky as there is not a “one size fits all” explanation, and Positivism continues to be employed in different ways across different fields of research (Hassan, 2016). Since multiple community colleges were examined for this study, looking at Positivism in terms of organizational theory seemed appropriate. According to Bess and Dee (2008), “Positivism assumes that an objective environment exists outside the boundaries of an organization. Organizational analysts seek to understand as completely and accurately as possible the internal conditions, the external environment, and the interaction between them” (p. 134). There is much literature challenging the assertion that it is possible to truly have an objective environment, and seeking understanding is still fraught with bias and philosophical concerns (Howe, 2009). However, Positivism still remains popular today for social scientists and educational researchers. The appeal of Positivism is eloquently summarized by the following quote from Hassan (2016), which references Positivism’s blossoming in natural science research:
8
experts who used to provide regular advice to governments on difficult matters of technical policy-making, from food safety to building standards and so on. Positivist approaches enable social scientists to present their disciplines as sufficiently and rigorously as the scientific experts, which provide them the platform to make strong claims about the reliability, objectivity and usefulness of the knowledge they have to offer. (p. 320)
While Hassan was referring specifically to social scientists, it is apparent that the same desires exist for educational research to be held as sufficient and rigorous as well.
Further evidence in the justification for using Positivism as a grand theory for this study is found in the following:
As Brennan (2008) points out, “For future higher education research this indicates a need to analyze the operational dimensions of this interaction between external demands and internal goal setting. What is happening in the processes of identifying needs and goals and of coping with them in the daily life of higher education
institutions” (p.384)? Examining the literature also seems to suggest that community colleges need to better identify the internal versus external demands of having an athletic program (Hagedorn & Horton, Jr., 2009; Lawrence, Mullin, & Horton, Jr., 2009).
This paragraph perfectly matches the assumptions of Positivism as defined by Bess and Dee on the previous page and thus seemed like a natural fit for the study.
Contingency Theory
9
examines the differences between athletes and non-athletes over academic and demographic characteristics, which could impact how decisions are made concerning community college athletics at the administrative level. The essence of Contingency Theory is there is not just one best way to make leadership decisions (Foster, 2006). The organizational applications of Contingency Theory, again from Bess and Dee, are:
The basic premise of contingency theory is that organizational effectiveness is contingent on a judicious, rational matching of organizational variables to environmental conditions. Contingency theorists attempt to identify both the environmental variables and organizational elements that can best predict which organizational designs and leadership approaches are likely to be most effective. Leaders can then restructure organizations based on which design is the best fit for their environment (p. 145).
10
Using Positivism as a grand theory with Contingency Theory as a supporting middle range theory effectively guided this study and helped generate future research ideas based on the resulting data. Since the study only examined a single community college with no
Inputs Organizational and Environmental Conditions Outcomes
Figure 1. Contingency Theory mapping of potential organizational and environmental variables in relationship to the covariates and outcomes being studied.
Covariates Age Ethnicity Gender Educational Goals Financial Aid Status Organizational
• Funding – Creating Budget Stability, Day to Day Operations, Title IX, College Presidential Oversight
• Student Support Success – Tutoring Support, Retention Rates, Graduation Rates, Faculty/Student Interactions • Support of Mission Statement –
Justification of Athletic Programs, Increased Minority Enrollment, Increased Involvement in Local Community
• Title IX/Gender Issues – Proper Funding of Female Teams, Unique Needs of Female Athletes, Lack of Female Leadership
Environmental
• Academic Performance – Being a Full
Time Student, Maintaining Minimum 2.0 GPA, Study Time Obligations • Commitments – Family, Job, Practice
• Health/Well Being – Getting Enough
Sleep, Getting Enough to Eat, Having Secure Place to Live
• Obligations – Finances, Transportation,
Team Activities Outcomes College Hours Attempted Developmental Courses Attempted Developmental English Attempted Developmental Math Attempted Developmental Reading Attempted Grade Point Average
11
identifying data, it was not problematic in addressing the philosophical objections to Positivistic research.
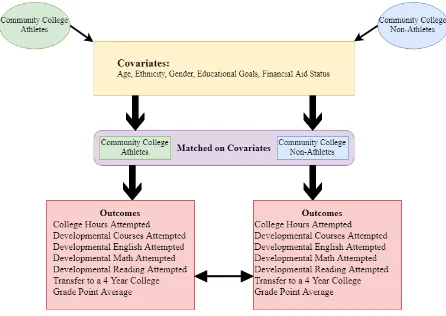
Conceptual Framework
The conceptual framework for this study provides a map for utilizing propensity score matching to demonstrate the impacts of being a community college student athlete on various academic outcomes. This mapping includes the population of community college students studied, the treatment variable (those who are athletes), the control variable (those who are non-athletes), demographic covariates, the process of propensity score matching, and the academic outcome variables.
12
Figure 2. Map of conceptual framework showing the population, covariates, propensity score matching, and outcomes being studied.
Research Questions
This study was conducted using five research questions. These five questions guided the study and ensured the purpose of the study was met:
1. What are the demographic and academic characteristics of the study population? 2. What are the demographic and academic characteristics of the athletes and
non-athletes in the study?
13
Hypothesis 1
Ho: There is no difference between athletes and non-athletes.
Ha: There is a statistically significant difference between athletes and non-athletes.
4. Is there a difference in demographics and academic characteristics of athletes and non-athletes after propensity score matching?
Hypothesis 2
Ho: After propensity score matching, there is a statistically significant difference between athletes and non-athletes.
Ha: There is no difference between athletes and non-athletes. 5. Is there a difference between the athletes and non-athletes in terms of academic
success as measured by hours attempted, grade point average, and successful transfer rate as well as developmental course participation after propensity score matching?
Research Methods
The research method implemented for this study is propensity score matching. A propensity score estimation is found by using a logistic regression model to compute a conditional probability of a person from the control group being in the treatment group given a composite profile of covariates (characteristics) of a person in the sample (Rojewski, Lee, & Gemici, 2010). This conditional probability is calculated by using the observed
14
and determine if there is an academic impact of being a student athlete at the studied community colleges.
Significance of Study
There was virtually no quantitative analysis found in the literature on community college athletics. A few articles and two dissertations used descriptive statistics in conducting their research, and none used any inferential statistical methods (Byrd, 2007; Byrd, &
Williams, 2007; Castaneda, 2004; Castaneda, Katsinas, & Hardy, 2006; Williams, Byrd, & Pennington, 2008). The Castaneda dissertation is the only resource that includes any demographic characteristics of community colleges that sponsored athletic programs. This lack of inferential statistical analysis in the research on community college athletics indicated a clear need for a study using advanced statistical methods.
This type of study will benefit community college administrators who are thinking of starting or ending athletics at their college or are trying to make data-driven decisions about how to allocate their internal resources for their athletic programs. For example, if there is a statistical difference in grade point averages between athletes and non-athletes, community colleges with athletic programs could allocate additional student support or tutoring services for the athletic community.
15
examine all of the community colleges in a state with a large number of community college athletic programs, like California, Mississippi, or Kansas.
Limitations
There were five recognized limitations within this research. First, there was no control over which students are student athletes at the respective community colleges. Thus, certain demographics are more prevalent in the data used. However, propensity score matching allows for dividing athletes and non-athletes into statistically comparable groups which alleviates this concern.
Second, participation in community college athletics varies from college to college. Some community colleges offer varying amounts of athletic aid and others do not. This could be a factor in retention. Also, some community colleges have significantly longer distances to travel to participate in athletic events than others. For those community colleges with extra travel time, this could take away from an athlete’s ability to maintain good study habits, thus negatively affecting their grades compared to athletes with shorter travel distances.
Third, it is not uncommon for a student athlete at the community college level to enroll as a student for one year and then become a student athlete the next, or vice-versa. This limitation was not a problem for this study as athletic rosters were examined for the two-year cohort. If a student was an athlete in one of the two years and not the other, they were labeled accordingly and sorted by the propensity score matching.
16
number of variables to be considered, selection bias could have been a problem since community college athletes generally have different academic and retention backgrounds than non-athletes (Mendoza, Horton, & Mendez, 2012) as well as potentially having different impacts on student support services at a community college (Storch & Ohlson, 2009).
Propensity score matching reduces the problem of selection bias and non-random
assignments and is often used with “after the fact” data (Titus, 2007). This could explain why propensity score analysis has skyrocketed in educational research in the last decade (Frye, 2014).
The final limitation identified for this study was the chosen research method. Propensity score matching reduces the problem of selection bias and non-random
assignments (Titus, 2007). In doing so, however, propensity score matching eliminates a large number of students from the data analysis. For example, only full-time students were matched since athletes must be full time to be eligible. Thus, all part-time students were eliminated. Making sure non-athletes are represented in the study is vital. This concern is mitigated by propensity score analysis’ ability to represent the untreated group as part of the analysis (Titus, 2007).
Delimitations
This study is limited to a single community college during the academic years 2013-2015. The researcher worked with the Institutional Research department at that institution to gather the data on the student population being studied. There is no suggestion that this community college is representative of all community colleges in the United States.
17
controlled through the research and include overall GPA, total number of developmental courses attempted, total number of developmental math courses attempted, total number of developmental reading courses attempted, total number of developmental English courses attempted, hours attempted, and transfer rates.
The final delimitation of this study is the definition of a community college student athlete. This is someone who participates in any sport sanctioned by either the National Junior College Athletic Association (NJCAA), the California Community College Athletic Association (CCCAA), or the Northwest Athletic Association of Community Colleges (NWAACC). This definition does not include any community college student who participates in club sports at their respective schools. The community college used in this study is a member of the NJCAA.
Definition of Terms
Athletic Program. An athletic program is the collection of sanctioned sports that a college offers. Athletic programs can vary in size depending on the college.
Athletic Scholarship Aid. Community college athletic programs are classified into three levels concerning athletic scholarships: Division I are schools that offer scholarship awards covering the full cost of tuition, Division II are schools that offer partial scholarships, and Division III are schools that offer no scholarship assistance.
18
Completion Rates. The percentage of a school’s students who complete their program within the published time for the program.
Credits – Attempted. The total number of credits that a student is enrolled in at the 10% census date.
Credits – Completed. The total number of credits that a student is enrolled in at the end of the semester.
Developmental English. A remedial course designed to prepare community college students for a beginning course in college English by strengthening foundational English skills.
Developmental Math. A remedial course designed to prepare community college students for a beginning course in college math by strengthening foundational math skills.
Developmental Reading. A remedial course designed to prepare community college students for a beginning course in college reading by strengthening foundational reading comprehension skills.
Load Hours. The number of hours a student is enrolled in during a semester. For example, 12 hours is generally considered a full-time load.
Logistic Regression. Logistic regression measures the relationship between the categorical dependent variable and one or more independent variables by estimating probabilities using a logistic function.
19
and assigning the treatment indicator as the dependent variable with those receiving treatment being coded as 1 and those not receiving the treatment as 0.
Propensity Score Matching. Propensity score matching is a technique used to simulate an experimental study. This is achieved by using matched sampling to choose the controls for further study so that the control groups are similar to the treated subjects with respect to background variables measured on all subjects. Propensity score matching mimics the characteristics of randomized controlled trials, thus reducing selection bias (Beal & Kupzyk, 2014).
Retention Rates. The percentage of a school’s students who continue at that school the next academic year excluding those that graduate.
Transfer Rates. The percentage of community college students who transfer to a four-year college.
Summary
20
research in community college athletics and will serve as a model for conducting further empirical research.
This chapter began with an overview of community college athletics, including how community college athletics shares governance, how athletic scholarships work at the
community college level, the campus setting for athletic programs, and how gender equity is applied. This chapter also discussed the theoretical and conceptual frameworks that guided this study. The research questions, methodology, limitations and delimitations that guided the study were also presented. Finally, important terms applicable to the study were defined. Chapter 2 presents a review of the literature for community college athletics. Chapter 3 explores propensity score matching and the research design used for this study. The
21
CHAPTER TWO: LITERATURE REVIEW
Included in this review are the areas of research, the seminal works, and theoretical frameworks found in the literature on community college athletics. The theoretical
frameworks chosen for this study are then provided. Lastly, some context for propensity score matching in educational research is given. The chapter ends in a summary.
Context of Community College Athletics Literature
The literature on community college athletics does not reveal many common areas or foci of research. This lack of focused research agendas is problematic to anyone trying to gather information on community college athletics. Additionally, there is no current research base that demonstrates the theoretical frameworks for studying community college athletics. Gaining a theoretical foundation prior to conducting the study was important to ensure that a proper framework was utilized. Thus, a comprehensive examination of all the literature relating to community college athletics was undertaken to gather insight into the body of knowledge on this topic. This integrative literature review sought answers to two basic questions: “What are the areas of research in community college athletics?” and “What theoretical frameworks are used in writing this research?” For this review, 54 articles and 50 dissertations were examined.
Integrative Literature Review
22
articles appeared in the late 1970’s, and most of the literature has been published in the last 15 years. Thus, this is an emerging topic.
Emerging Topic
Torraco (2005) suggests the benefit in taking a holistic approach to emerging topics is identifying preliminary frameworks to build upon. A review of the literature was conducted that looked for prominent research areas as well as areas of deficiency that may indicate the need for future research. Additionally, any theoretical frameworks used in the literature were examined with the intention of finding a prevailing framework.
Observations
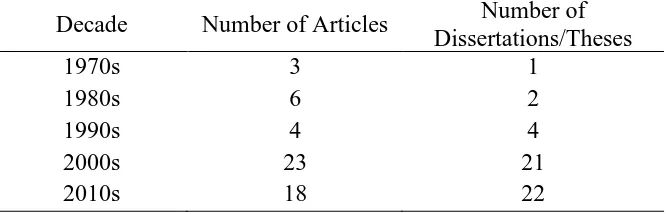
Published research on community college athletics dates back to the late 1970s. The oldest publication date that this search yielded was an overview of a community college athletic program from 1976. Two other articles also appeared in this decade. A total of six articles were published in the 1980s, and four articles were from the 1990s.
However, as community colleges dramatically started to add athletic programs after the year 2000, there was an explosion of research conducted on this area. In fact, 23 articles were published between 2001 and 2010, which almost doubled the number from the previous two decades. There were 18 additional articles published between 2011 and 2016.
23
Table 1
Publication Dates of Articles, Dissertations, and Theses Decade Number of Articles Number of
Dissertations/Theses
1970s 3 1
1980s 6 2
1990s 4 4
2000s 23 21
2010s 18 22
Inspecting the article, dissertation, and thesis references revealed that most of the cited works were not about community college athletics. The cited works mostly dealt with research about university athletics. The goal in some cases was to show parallels between community college athletic concepts and those of established athletic programs at the university level. It is natural to use available research for this endeavor, but there is also an inherent associative risk with this strategy. For instance, many athletic programs at the university level have access to resources that community colleges cannot hope to provide. Therefore, generalized results gleaned from the study of athletics at the university level are most likely not applicable at the community college level due to the vast difference in athletic funding and the disparity in other physical resources.
24
Table 2
Breakdown of States Represented in Dissertations/Theses State Number of Dissertations/Theses
California 8
Mississippi 2
North Carolina 2
Florida 1
Tennessee 1
Texas 1
Research Areas
25
Table 3
Coding Method and Occurrences
Research Areas Occurrences in Dissertations/Theses
Occurrences in
Articles Totals
Funding issues 17 24 41
Student support and success issues 24 13 37
Gender issues 12 9 21
Support of college mission
statement 8 13 21
Academic performance/integrity
issues 1 12 13
Leadership/ management issues 6 7 13
Minority issues 7 5 12
College choice
(recruitment, increase in enrollment)
3 5 8
Increased pride/visibility of college 2 5 7
Health/well-being of student athlete 2 5 7
Athlete/athletics demographics 3 3 6
Ethical considerations 0 1 1
Totals 85 102 187
Examining the table indicates that the top six areas account for roughly 78% of the occurrences in the literature. These six areas will now be examined further.
26
economies (Mumford, 2006; Chen, 2008; Williams, Byrd, & Pennington, 2008; Bush et al., 2009; Fanelli, 2010). Many of the articles paint a grim picture of funding as inherently unstable, and some articles imply that community college presidents may not be fully aware of how the funding structure for athletics truly works—even though regional accreditation requires that a college president maintain direct oversight and control of athletics programs.
Student Support/Student Success. This research area focuses on the support services and counseling offered to athletes at the community college level and addresses if and how athletics improves retention, graduation, and transfer rates for the athletes. These two ideas were so intertwined in the research, it made sense to link them together as a research area. The 37 (35.6%) results that included student support/student success covered the following areas: how athletics can help motivate the student athletes to achieve academic success, how athletics helps improve retention and graduation, how athletics affects and effects student support services, how the unique needs of athletes are being addressed in the counseling provided by student support services, how colleges are addressing counseling and gender issues, athletics and student success in minority athletes, and how student support staff perceive the importance of athletics. (Knapp & Raney, 1988; Berson, 1996; Kissinger & Miller, 2007; Horton, Jr., 2009; Horton, Jr., 2011; Kissinger, Newman, Miller, & Nadler, 2011; Mendoza, Horton, & Mendez, 2012; Wood & Ireland, 2014; Horton, Jr., 2015). If community college athletics continue to grow, further research will be needed to show the benefits that support services can have for athletes (Storch & Ohlson, 2009).
27
some other research areas include the unique needs of female student athletes in student support and retention, the lack of women in positions of leadership in community college athletics, and the ongoing battle of women’s programs’ achieving full equity to men’s even though Title IX was passed over 40 years ago (Castaneda et al., 2005; Jenkins, 2006; Williams & Pennington, 2006; Krug, 2007; Hagedorn & Horton, Jr., 2009; Lawrence et al., 2009; Steinbach, 2010; Mendoza, Horton, Jr., & Mendez, 2012). The pressing funding issues mentioned earlier will continue to be a difficulty for those attempting to achieve gender equity in community college athletics (Staurowsky, 2009).
Athletics as Support of Mission of College. Generally, the mission of a community college is to provide educational opportunities to members of the community that they serve. Athletics as they relate to supporting the mission of the community college accounted for 21 (20.2%) of the results. The purpose and underlying need of this research has been to examine the bottom-line criticism of why community colleges should even decide to offer athletics. Some of these articles attempt to answer directly or indirectly the questions that provide evidence that community college athletic programs help to fulfill the general mission of community colleges (Hagerty, 1976; Fink, & Kirk, 1979; Greene, 1982; Berson, 1996; Williams & Pennington, 2006; Krug, 2007; Hagedorn & Horton, Jr., 2009; Fanelli, 2010). This research provides some empirical evidence that more than just simple expenditures must be considered. However, this line of research lacks any information on the pecuniary
28
Academic Performance/Integrity Issues. The academic performance of student athletes includes aspects of eligibility, GPA requirements, transcript analysis of student athletes that transfer to four-year institutions, and academic accountability of student athletes. Many of the 13 (12.5%) results examining these issues also mention that athletics can have a negative impact on the general perception of academic integrity of a community college. These perceptions arise from worries that athletics will increase developmental instruction due to the athletes’ not being academically prepared for college or that athletes will be steered into fraudulent courses to maintain eligibility (Hagedorn & Horton, Jr. 2009). Some articles attempt to combat this perception by favorably comparing graduation rates of student athletes with those of students in general (McAninch, et al., 1987; Knap & Raney, 1988; Kanter & Lewis, 1991; Bennion, 1992; Horton, Jr., 2009).
Leadership/Management Issues. The difficulties in the leadership and management of a community college athletic program for college presidents and athletic directors
29
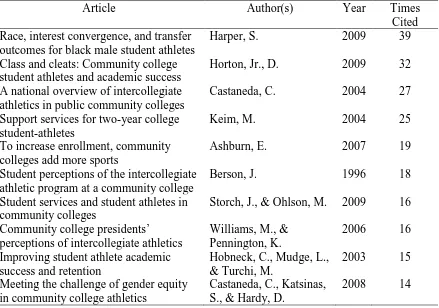
Seminal Works
Based on the description of the literature examining community college athletics, it would be tempting to say there are not any seminal works to identify as a beginning point for gaining knowledge in this field. There are, however, several works that are cited frequently in other research. Using Google Scholar, a list of the top ten most-frequently cited works was created from the 104 articles and dissertations examined. Table 4 reproduces this list with the authors of each work and the year of publication. The number of citations is based on a Google Scholar search conducted in February of 2016.
Table 4
Top Cited Resources on Community College Athletics
Article Author(s) Year Times
Cited Race, interest convergence, and transfer
outcomes for black male student athletes
Harper, S. 2009 39
Class and cleats: Community college student athletes and academic success
Horton, Jr., D. 2009 32 A national overview of intercollegiate
athletics in public community colleges
Castaneda, C. 2004 27
Support services for two-year college student-athletes
Keim, M. 2004 25
To increase enrollment, community colleges add more sports
Ashburn, E. 2007 19
Student perceptions of the intercollegiate athletic program at a community college
Berson, J. 1996 18
Student services and student athletes in community colleges
Storch, J., & Ohlson, M. 2009 16 Community college presidents’
perceptions of intercollegiate athletics
Williams, M., & Pennington, K.
2006 16
Improving student athlete academic success and retention
Hobneck, C., Mudge, L., & Turchi, M.
2003 15
Meeting the challenge of gender equity in community college athletics
Castaneda, C., Katsinas, S., & Hardy, D.
2008 14
30
came in third on this list is a descriptive statistical overview from 2004. The Williams and Pennington piece uses some basic t-tests on a small sample size. The other eight use little to no data in supporting their research. This further supports the assertion that a data-driven study is needed.
Theoretical Frameworks
According to Camp (2000), a theoretical framework is defined as “a set of theoretical assumptions that explain the relationships among a set of phenomena” (p. 12). This idea is an extension of Creswell (1994), who posited that there are three levels of theories: grand, middle range, and substantive. Camp delineates each type:
Grand theories are used to explain major categories of phenomena and are more common in the natural sciences. Middle range theories fall somewhere between the working hypotheses of everyday life and grand theories. Substantive theories offer explanations in a restricted setting and are limited in scope, often being expressed as propositions or hypotheses (Camp, 2000, p. 3).
The integrative literature review was examined to find which level of theory was used in the community college athletics articles and dissertations.
31
phenomenological framework was used in interviewing student athletes about academic success (Horton, 2009).
The absence of higher-level theoretical frameworks in the articles seems to be a glaring omission from this research area. It may be unnecessary that some grand theory be forced to act as a lens through which to study community college athletics, but surely some middle range frameworks would help researchers guide their efforts in writing articles. Fortunately, there are several mid-range theories found in the dissertation frameworks section.
Camp further delineates between the levels of theory as follows: “If a study cannot trace its roots to a grand theory or to a middle level theory published in a reputable source, but it has a legitimate, clean, rational framework then it is based on a substantive theory” (p. 13). Thus, 21 (38.9%) articles fit Camp’s broad range definition of substantive theories.
The broad range of substantive theory topics include community college presidents’ perceptions of athletics, student athletes’ perceptions of athletics, the effects of GPA on athletics, an analysis of transcripts and credit hours of student athletes, participation of
32
The remaining 33 (61.1%) articles did not appear to have any sort of theoretical framework. That is not to say these articles did not add value or provide questions for potential future research. These articles add value in offering guidelines, future
considerations, suggestions, and implications of current behavior. Still, the fact that over half of the selected articles suggested nothing in the way of a theoretical framework clearly suggests that this is a weakness that needs to be addressed in order to advance this topic.
Dissertation and Thesis Theoretical Frameworks. No grand theories or middle range theories were used in the three theses selected for this study. However, grand theories and middle range theories were more prevalent in dissertations than in the articles on this topic. Seventeen (34%) dissertations had a grand or middle range theory as a foundation for the research. Of those 17 dissertations, two grand theories and 27 middle range frameworks were utilized.
Functionalism and Post-positivism were the two grand theories that were found in the dissertations. Functionalism was used in analyzing the community college experience as it relates to athletics (Thies, 2009). A Post-positivism lens was used in exploring the
opportunity to compete in athletics as influencing the choice of going to college (Rinke, 2011).
The 27 middle range theories found in the dissertations covered a wide variety of subject areas. Each middle range theory only occurred once with the exception of
33
Table 5
Middle Range Theories Used in Dissertations
Academic Capitalism Academic Motivation Attribution Theory Applied Action Research Behavioral Approach Contemporary Approach Contingency Approach Feminist Legal Theory Grounded Theory
Human Capital Theory Institutional Theory Intrinsic Motivation Managerial Professionals
Theory
Process Evaluation Theory Reference Group Theory Resource Dependency
Theory
Self-Determination Theory Social Equity Theory Situational Approach Stratification Theory Student Choice Theory Student Engagement
Theory
Student Involvement Theory Theory of Challenge and Support
Theory of Involvement Transactional Leadership Style
Transformational Leadership Style
There were 30 (66%) the dissertations that used no grand or middle range theories. Most of these 30 dissertations were quantitative studies of a particular aspect of community college athletics. All of the dissertations and theses were considered to have at least a substantive theory since they all answered at least one question based on created research.
Theoretical Frameworks Used in Study
The integrative literature review performed for this study showed only two grand theoretical frameworks guiding dissertation research on community college athletics:
34
differentiate Positivism and Post-positivism were not worth examining here. Contingency Theory was selected as the middle range theory for this study.
Positivism
Defining Positivism can be a bit tricky as there is not a “one size fits all” explanation and Positivism continues to be employed in different ways across different fields of research (Hassan, 2016). Since a community college was examined for this study, looking at
Positivism in terms of organizational theory seemed appropriate. According to Bess and Dee (2008) “Positivism assumes that an objective environment exists outside the boundaries of an organization. Organizational analysts seek to understand as completely and accurately as possible the internal conditions, the external environment, and the interaction between them” (p. 134). There is much literature challenging the assertion that it is possible to truly have an objective environment and seeking understanding is still fraught with bias and philosophical concerns (Howe, 2009). However, Positivism remains popular today for social scientists and educational researchers. The appeal of Positivism is eloquently summarized by the following quote from Hassan (2016) which references the emergence of Positivism in natural science research:
35
claims about the reliability, objectivity and usefulness of the knowledge they have to offer. (p. 320)
While Hassan was referring specifically to social scientists, it is apparent that the same desires exist for educational research to be held as sufficient and rigorous as well.
Further evidence in the justification for using Positivism as a grand theory for this study is found in the following:
As Brennan (2008) points out, “For future higher education research this indicates a need to analyze the operational dimensions of this interaction between external demands and internal goal setting. What is happening in the processes of identifying needs and goals and of coping with them in the daily life of higher education
institutions” (p.384)? Examining the literature also seems to suggest that community colleges need to better identify the internal versus external demands of having an athletic program (Hagedorn & Horton, Jr., 2009; Lawrence et al., 2009).
This paragraph perfectly matches the assumptions of Positivism as defined by Bess and Dee on the previous page and thus seemed like a natural fit for the study.
Contingency Theory
36
The basic premise of Contingency Theory is that organizational effectiveness is contingent on a judicious, rational matching of organizational variables to environmental conditions. Contingency theorists attempt to identify both the environmental variables and organizational elements that can best predict which organizational designs and leadership approaches are likely to be most effective. Leaders can then restructure organizations based on which design is the best fit for their environment (p. 145).
The matching of organizational variables to environmental conditions is the basis for how this study examined the academic and demographic characteristics of athletes and non-athletes.
Using Positivism as a grand theory with Contingency Theory as a supporting middle range theory effectively guided this study and helped generate future research ideas based on the resulting data. Since the study only examined a single community college with no
identifying data, it was not problematic in addressing the philosophical objections to Positivistic research. Additionally, Contingency Theory will help guide those in leadership roles as they make decisions on how to manage their organizations as they implement or maintain community college athletic programs.
Propensity Score Matching in Educational Research
37
showed that athletics had a small negative impact on grade point averages. Anderson (2015) examined the effect that athletic success in college football has on attracting students and raising donations. One hundred and twenty NCAA Division I schools were examined, and not surprisingly, schools with higher win totals had lower acceptance rates and higher donation rates.
This study of literature also includes research that examined community college issues using propensity score matching. Frye (2014) looked at retention rates of community college students who took developmental math. Her research included a paragraph listing several studies that used propensity score matching:
Recent higher education studies have used propensity score methods to examine the following: the financial return on completing a graduate degree (Titus, 2007); the effect of initial enrollment on degree completion (Reynolds & DesJardins, 2009); the effectiveness of career academies on influencing career choices (Rojewski, Lee, & Gemici, 2010); and the propensity being placed into remedial coursework when comparing two-year to four-year college students. The association between
institutional type, remedial status, and degree completion was also investigated using the propensity matching technique (Attewell,Domina, Lavin, & Levey, 2006) (p. 17 - 18).
38
2016); and the impact of service learning at a community college on academic outcomes
(Marts, 2016) just to name a few.
Summary
Based on a review of literature, there are six areas accounting for most of the research being conducted in community college athletics: 1) funding issues, 2) student support/
student success issues, 3) gender issues, 4) support of college mission statement, 5) academic performance/integrity issues, and 6) leadership/management issues. These areas are each unique, but often the focus of the articles and dissertations overlap into each other.
39
CHAPTER THREE: METHODS Propensity Score Analysis Overview
In 1983, Rosenbaum and Rubin published an article that would influence research in the social, behavioral, and health sciences for the upcoming decades and is now considered a seminal work (Lane, To, Shelley, & Henson, 2012). The focus of the article was on
propensity score matching, a technique which is used to simulate an experimental study. Rosenbaum and Rubin noted that in many medical observational studies, a small group of subjects is exposed to a treatment while a much larger group of control subjects is not exposed to this treatment. This disparity in the sizes of the two groups could lead to complications in analyzing group comparisons. The gold standard of conducting research within medical studies utilizes randomized controlled trials, but the costs associated with conducting these trials are high which often leads to researchers using samplings of the control group for comparisons to the treatment group (Rosenbaum & Rubin, 1983). Sampling in a study can lead to selection bias which threatens validity (Pan, 2015). Rosenbaum and Rubin introduced the idea of using matched sampling to choose the controls for further study so that the control groups are similar to the treated subjects with respect to background variables measured on all subjects. Propensity score matching in essence mimics the
characteristics of randomized controlled trials, thus reducing selection bias (Beal & Kupzyk, 2014).
40
observed characteristics and assigning the treatment indicator as the dependent variable. Propensity scores range from 0.0 to 1.0, and these scores are used to make matches from each group. Utilizing propensity score matching allowed the researcher to meet the purpose of this study and determine if there is an academic impact of being a student athlete at the studied community colleges.
Once a propensity score has been calculated, different propensity score matching methods can be used to match units (Pan, 2015). Examples of these methods include nearest neighbor matching (which matches a person from each group with the closest propensity score match), caliper matching (which matches a person from each group with the closest propensity score as long as that score is very close), Mahalanobis metric matching (which matches a person from each group using the idea of Mahalanobis distance based on the proximities of the variances), and optimal matching (which uses Mahalanobis distance and a weighted distance metric). (Pan, 2015). Once a method is chosen, the matches proceed across both groups, and if no match is found, the case is discarded and the sample size is reduced (Frye, 2014).
After a matching method is utilized, the researcher must then evaluate the quality of the balance between the covariate variables. This evaluation is done by evaluating each of the following: selection bias using a significance test, standardized bias, and percent bias
reduction (Pan, 2015). Graphical representations can also be utilized in addition to these statistical methods in the evaluation process to help visualize the quality.
41
As with any research method, there are issues with propensity score analysis. Some of these issues include how one assesses the robustness of propensity score analysis, under what conditions propensity score matching is efficient, and how to effectively implement
propensity score analysis on complex data (Pen, 2015). Additionally, the consequences of matching with or without replacement must be incorporated into any research design using propensity score matching. Matching with replacement means each unit in the control group can be matched more than once while matching without replacement means that each unit in the control group is matched only once. Matching with or without replacement gives very different matching groups and thus different accuracies in the results (Pan, 2015). Finally, consideration of the sample size ratio is an issue to be considered as some researchers suggest that the control group sample size should be three times larger than the treatment group for better accuracy (Pan, 2015).
Application to Research Topic
Selection bias is not just limited to the social sciences. Research in the field of education also struggles with this concern. Education studies often lack funding to conduct randomized trails and for this reason often employ “after the fact” data for analysis. (Titus, 2007). When looking at past data, it is hard to account for selection bias or even know why a person selected to be in a particular group. Propensity score analysis is an excellent tool in examining “after the fact” data for the reasons mentioned in the overview. This could explain why propensity score analysis has skyrocketed in educational research in the last decade (Frye, 2014).
42
treatment group for the study were the athletes at the community college that participated in the study. The control group were the remaining students at this community college. Due to the large number of variables considered, selection bias could have been a problem since community college athletes generally have different academic and retention backgrounds than non-athletes (Mendoza, Horton, & Mendez, 2012) as well as potentially having different impacts on student support services at a community college (Storch & Ohlson, 2009).
Propensity score matching techniques reduced selection bias as a concern and thus was the main reason this method was chosen.
There were over ten times more students in the control group than the treatment group, easily satisfying the three-to-one requirement. Due to the relatively small number of athletes in the control group, the nearest neighbor method was utilized along with selection without replacement. A propensity match tolerance of .005 was utilized rather than the .05 match tolerance that some studies using propensity score matching employ. These more stringent choices were employed to account for the limitations of the small number of students in the treatment group (Pan, 2015).
Population in the Study
43
The athletes in this study were typical students at this community college. The athletes received no athletic scholarship, no special accommodations for tutoring or other student support services that was not available to all students at this community college. The athletes received no special advising or were allowed to register for courses before their other cohort members.
Construction of the Data Set
The data requested from the participating community college is typical annual data used in institutional planning and research to satisfy federal and state reporting requirements as well as grant applications and program reviews. Both that community college and North Carolina State University participated in the Institutional Research Board (IRB) process.
The institutional data was collected by the participating community college, and the athletes were identified for coding purposes. The software tool SPSS was used for all coding and statistical and data analysis. Dr. Bobbie Frye, a member of this dissertation committee, helped guide the study during the data collection and analysis phase.
Recoding Variables
44
Table 6
Covariate Variable Types and Coding Schemes
Variable Name Type Coding
Athlete Categorical 1 = Yes 0 = No
American Indian/Alaska Native Dummy 1 = Yes
African American Dummy 2 = Yes
Asian American Dummy 3 = Yes
Hispanic Dummy 4 = Yes
Hawaiian Dummy 5 = Yes
Multiple Races Dummy 6 = Yes
Unknown Race Dummy 7 = Yes
White Dummy 0 = Yes
Age Continuous
Gender Dummy 1 = Male 0 = Female
Take Courses for Enrichment Dummy 1 = Yes Take Courses for Transfer Dummy 2 = Yes
Unknown Goal Dummy 3 = Yes
Enhance Employment Skills Dummy 4 = Yes
Enhance Job Skills Dummy 5 = Yes
Obtain an Associate Degree Dummy 0 = Yes
Pell Recipient Dummy 1 = Yes 0 = No
Table 7
Outcome Variable Types and Coding Schemes
Variable Name Type
College Credits Attempted Continuous Developmental Credits Attempted Continuous Developmental Math Credits Attempted Continuous Developmental English Credits Attempted Continuous Developmental English Credits Attempted Continuous Transfer to 4 Year College Categorical
Grade Point Average Continuous
Data Analysis
45
Pre-Screening Data
All data was screened for missing values and examined for normality as well as outliers and errors.
Reporting Pre-Matched Differences on Demographic and Academic Variables. Once the data was screened, the demographic and academic variables were examined for differences. The mean, standard deviation, frequency, and percent were established to describe the athlete and non-athlete groups. Chi-square and t-tests were conducted to examine differences between the two groups.
Reporting Pre-Matched Differences on Outcome Variables. Likewise, the
outcome variables were examined for differences. The mean, standard deviation, frequency, and percent were established to describe the athlete and non-athlete groups. Chi-square and t -tests were conducted to examine differences between the two groups.
Covariate Identification
The covariates were selected based on the available data. Most of the covariates listed in Table 7 were found in other dissertations using propensity score matching that examined community colleges.
Propensity Score Estimation
46
Propensity Score Match and Selecting
Nearest neighbor matching was utilized. This matched a person from each group with the closest propensity score match. The propensity score distributions were assessed to ensure they were similar across the two groups. Propensity score outliers were discarded.
Common Support. Common support examines the individual characteristics of both the control and treatment groups and then removes those characteristics not in common to both groups (Rojewski, Lee, & Gemici, 2010). The standard way to ensure common support is to use the propensity scores and remove the scores not in common to both groups. The results indicated that there were no characteristics that needed removal.
Assessing the Quality of the Match
Calculation of the Covariate Effects. The demographic and academic variables were examined for differences after the propensity score match. The mean, standard deviation, frequency, and percent were established to describe the athlete and non-athlete groups. Chi-square and t-tests were conducted to examine differences between the two groups.
Calculation of the Outcome Effects. The outcome variables were examined for differences after the propensity score match. The mean, standard deviation, frequency, and percent were established to describe the athlete and non-athlete groups. Chi-square and t-tests were conducted to examine differences between the two groups.
Sensitivity Analysis. According to Rojewski et al., (2010), “Sensitivity analysis is used to evaluate how analysis of treatment effects might be altered by unmeasured variables”
(p.17). Rojewski recommends using the Mantel-Haenszel test which compares the successful
number of individuals in the treatment group with an expected number and follows the chi-square
47
Summary
Data was collected, with the aid of an institutional research department at a medium-sized rural community college located in the southeastern United States that had an athletic program. Athletes and non-athletes from that community college were included in the data set. The athletes in the data set were identified with help from the participating athletic department.