International Journal of Innovative Computing 7(2) 6-12
International Journal
of
Innovative Computing
Journal Homepage: http://se.fsksm.utm.my/ijic/index.php/ijic
Mobile Analytics Database Summarization Using
Rough Set
Merlinda Wibowo
1,2, Sarina Sulaiman
1,2, Siti Mariyam
Shamsuddin
1,2, Haslina Hashim
21UTM Big Data Centre, Ibnu Sina Institute for Scientific
and Industrial Research,
2Faculty of Computing, Universiti Teknologi Malaysia,
81310 Johor Bahru, Johor, Malaysia [email protected], [email protected],
[email protected], [email protected]
Dayang Hanani Abang Ibrahim
33Department of Information System, Faculty of Computer
Science and Information Technology, University Malaysia Sarawak, Kota Samarahan,
94300 Sarawak, Malaysia [email protected]
Abstract— The mobile device is a device that supports the
mobility activities and more portable. However, mobile devices have the limited resources and storage capacity. This deficiency should be considered in order to maximize the functionality of this mobile device. Hence, this study provides a formulation in data management to support a process of storing data with large scale by using Rough Set approach to select the data with relevant and useful information. Additionally, the features are combining analytics method to complete analysis of the data storage processing, making users more easily understand how to read the analysis results. Testing is done by utilizing data from the Malaysia’s Open Government Data about Air Pollutant Index (API) to determine the condition of the air pollution level to the health and safety of the population. The testing has successfully created a summary of the API data with the Rough Set approach to select significant data from the main database based on generated rule. The analysis results of the selected API data are stored as a mobile database and presented in the chart intended to make the data meaningful and easier to understand the analysis results of API conditions using the mobile device.
Keywords — Mobile Analytics, Mobile Database Summarization, Rough Set, Air Pollutant Index
I. INTRODUCTION
Mobile analytics is part of the feedback that involves measuring and analyzing data that has been generated by the mobile platform and has the nature of mobile sites and mobile applications [1]. Nowadays, mobile analytics technology is growing so quickly. These developments occurred as the
development of mobile technology has many advantages that are easy to use and can be used wherever and whenever the user is located. The mobile device itself is designed to be more portable and supports mobility activities. Mobile devices have limitations in storage capacity and processing power. Therefore, these devices need a mechanism to select meaningful data without changing the contents of the database. It will synchronize a process between the main database and the mobile database.
Several studies have produced database summarization with various methods but cannot handle data on a large scale, only focus on transactional data, image data and still can be refined to get more meaningful, accurate, and efficient result [2][3][4][5]. This research is to develop a new framework which produces mobile database summarization with the Rough Set approach and will be combined with analytics method in the mobile device. Mobile analytics method supported by dashboard function to show the result of data processing in the form of the chart [6]. It can help to understand and optimize the report of data processing result [7].
definition of mobile database summarization, mobile analytics, and Rough Set Theory. Next part will give the explanation about the purpose framework. Evaluation and comparison of the results of this study are described and followed by the conclusion of the study at the end of this paper.
II.MOBILE DATABASE
The Mobile Database System (MDS) is a ubiquitous database system where unlike conventional systems the processing unit could also reach data location for processing. Thus, it can process debit or credit transactions, pay utility bills, make airline reservations and other transactions without being subject to any geographical constraints [8]. The mobile database does not necessarily mean the mobile database but everything that can provide information in mobile user is a mobile database. If a connection to the main database cannot be established than a mobile database, it is in a disconnection state [9]. Every activity in mobile application will be supported only by mobile database during this state. A database synchronization is the only way the mobile database and centralizes database connects to each other. The synchronization process consists of two main activities; there are data pulling and data pushing. This research will deal with issues regarding pulling data activity.
Database management systems on mobile devices certainly provide to address the limitations from the device [10][11]. It has the objective to minimize the amount of the large data that sent from the server to mobile client by using the wireless network depends on the provided features by the device itself in terms of power limitations to communicate and the difference in screen size [12][13][10]. There are some researches discussed the use of mobile database to overcome the constraints on mobile devices that different from each other with soft computing approach, research methods, and other research techniques [10][14][15][16][17].
A. Mobile Database Summarization
Summarization technique has become an important and popular technique in the analysis of big data [18][19][20]. In recent years, researchers have employed this technique as a solution in data management process. Especially for structured or semi-structured data [21][22][23][24][25][26][27].
The characteristics of summarization are [5]:
1) Responsiveness. For a technique to be considered acceptable, it must provide an acceptable response to the user. However, the tolerance of waiting for a response may differ between different users and applications. The responsiveness of a summarization technique can be an important characteristic if the process makes it difficult to scale the process or is time-consuming to invoke.
2) Accuracy. Accuracy in the context of database describes the correctness and completeness of the database in response to a query. Significantly, depending on the type
of user and the requirements that a user may have, it is possible to provide different levels of accuracy for queries. A good summarization policy should be able to identify the needs of the user and provide at least the minimum level of accuracy. In some cases, over complete (generalized) answers may suffice.
3) Adaptability and Graceful Degradation. Adaptability is perhaps one of the more important, but difficult aspects that defines a good summarization technique. Regardless of the types of user or the environments the summary database will be used in, it should be capable of adapting to changes in its usage and operating environment. This includes the ability for a technique to degrade sensibly as storage becomes more limited.
This technique can also provide the facilities to present the management database in mobile devices [22][23].
B. Mobile Analytics
Figures, tables, charts and diagram should be kept to a mobile analytics that can improve cross-channel marketing initiatives, optimize the mobile experience for customers and the growth of the mobile user engagement and retention. The importance and role of mobile analytics into play is how the analysis of mobile analytics capability to affect the organization [6][28]. So that mobile analytics will has the advantage to enhance the end user experience and real-time data collection and provide custom content. Mobile analytics is largely a feedback involves measuring and analyzing the data generated by mobile platforms and properties, such as mobile sites and mobile applications [1][29]. The results of the data analysis will be in the form of tables and diagrams to facilitate the users in the reading of the analysis results. Hence, mobile analytics can help maximize mobile performance that can be seen from the results of the survey related research papers.
The mobile analytics era is growing day by day and it will make its significant position in the near future. Mobile analytics are establishing its existence in business by providing different analytic services to vendors as well as business people. We have also noticed that most users carry their web paradigms from PC to mobile, firms’ measure mobile websites more than applications, large enterprises extend their existing analytics investments, mobile analytics vendors are moving faster than potential buyers. Thus, through this paper, we review the need of mobile analytics with its benefits as well as industrial challenges.
III.ROUGH SET
to be modeled mathematically. Rough Set defined as a theory which has attracted a lot of attention from researchers and practitioners who contribute to the development of applications [31]. According to some studies suggest that Rough Set contrasts with other studies because the selection of attributes is based on Rough Set Theory attributes that can detect dependencies using decision tables [32][33]. The core part of this technique can identify with a minimum of conditional attributes that have properties similar to the complete attribute accuracy. Rough Set has been successfully applied in various fields that require in decision making, learning, processing parallel, and introduction of the machine [34].
Rule extraction (rule) is based on the value the support of each rule. The goal is to reduce the number of rules so we get fewer number rules. For example, DS = (U, C ∪D) which is a table of decision ∀x∈ U, then c1(x)..., ck(x), d(x) can be defined, where {c1..., ck} = C and {d} = D. Decision rule obtained from, c1(x)..., c2(x) → d(x). C is a reducts of attribute reduction condition is the result of the decision table. Rule selection of Rough Set (RS) is done because the rule acquired is still too many and long. To simplify the number of rules can be done through methods RS. If R = {Rule1,
Rule2,...,Rulej} is a subset of the rule obtained from Rough Set as new decision tables, where the rule applies as a subset of attributes. Rule 1 of the attribute value if the object xb at a decision (d) have the same value as a decision table and is 0 if no value. The value in the column (attribute) j+1 equal to the value of decision, with a = 1..., j and b = 1..., i.
This technique will be used for the mobile database summarization to further maximize the results of the processing of data from existing databases. It is due to Rough Set will provide efficient algorithm to find hidden patterns in data, find minimal dataset, evaluate data significance, and generate set decision rule of data. The results of this processing will be presented back to the form which makes it easier for the reading of the data analysis. Presentation of the results of the data analysis is presented in tables and charts described next section.
IV.RESEARCH FRAMEWORK
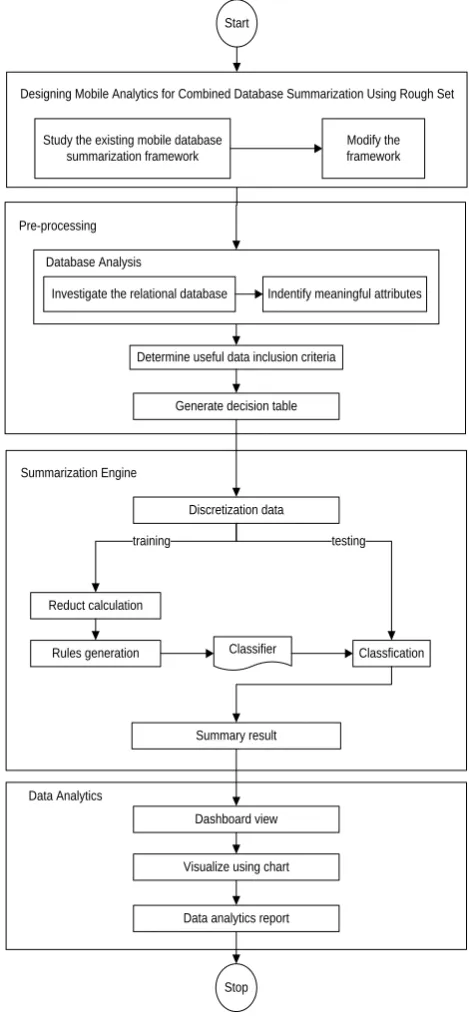
Stages of this research can be seen in Figure 1. From Figure 1 it can be seen that the study was conducted from a mobile development framework summarization database using Rough Sets and has been combined with the analytics to display the results more clearly to users. The results of the data analysis will be displayed in the form of dashboards, tables, and diagrams. These different representations to ensure the analysis results are clearly presented to the user.
Start
Investigate the relational database Indentify meaningful attributes
Determine useful data inclusion criteria
Generate decision table Pre-processing
Database Analysis
Summarization Engine
Discretization data
Reduct calculation
Rules generation Classfication
Summary result
training testing
Classifier
Data Analytics
Dashboard view
Visualize using chart
Data analytics report
Stop Study the existing mobile database
summarization framework
Modify the framework Designing Mobile Analytics for Combined Database Summarization Using Rough Set
Figure 1: Mobile Analytics Database Summarization using Rough Set Framework
V.EXPERIMENT AND RESULT
The experiment was performed as part of the research framework step explained in Figure 1.
A. Data Pre-processing
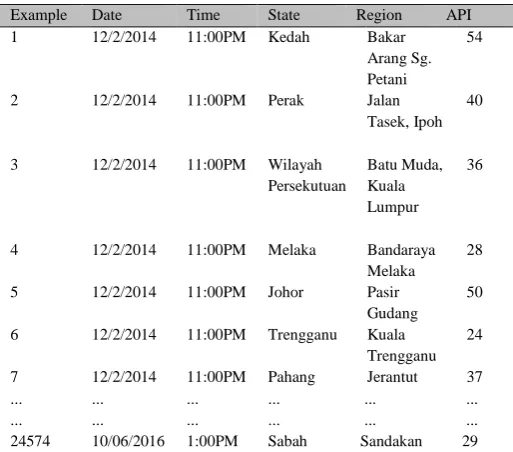
Table 1
Data Sample of Malaysian API Dataset
Example Date Time State Region API
1 12/2/2014 11:00PM Kedah Bakar
Arang Sg. Petani
54
2 12/2/2014 11:00PM Perak Jalan
Tasek, Ipoh 40
3 12/2/2014 11:00PM Wilayah
Persekutuan
Batu Muda, Kuala Lumpur
36
4 12/2/2014 11:00PM Melaka Bandaraya
Melaka
28
5 12/2/2014 11:00PM Johor Pasir
Gudang 50
6 12/2/2014 11:00PM Trengganu Kuala
Trengganu 24
7 12/2/2014 11:00PM Pahang Jerantut 37
... ... ... ... ... ...
... ... ... ... ... ...
24574 10/06/2016 1:00PM Sabah Sandakan 29
Rough Set is represented in the two elements of the Information System (IS) and Decision System (DS). Information System (IS) is a pair IS = {U, A}, where U = {e1, e2, ..., em} and A = {a1, a2, ..., an} is a set of examples and attribute conditions sequentially. The definition above shows that an IS consists of a set of examples, such as {e1, e2, ..., em} and attribute conditions, such as {a1, a2, ..., an}. In the IS, each row represents an object while each column represents the attribute of m objects.
U = {e1, e2, ..., em}: Sample 1,2,3....
A = {a1, a2, ..., an}: Date, Time, State, Region, API.
In many applications, an outcome which is represented by a Decision Attribute, C = {C1, C2, ..., Cp}. IS then be IS = (U, {A, C}). Decision System (DS) of data sample can be shown in table 2.
Table 2
Decision System of Malaysia API Dataset
Ex am ple
Date Time State Region API Decision
1 12/2/
2014 11:00 PM
Kedah Bakar
Arang Sg. Petani
54 Moderate
2 12/2/
2014 11:00 PM
Perak Jalan
Tasek, Ipoh
40 Good
3 12/2/
2014 11:00 PM Wilayah Persekutua n Batu Muda, Kuala Lumpur
36 Good
4 12/2/
2014 11:00 PM
Melaka Bandaraya
Melaka
28 Good
5 12/2/
2014 11:00 PM
Johor Pasir
Gudang
50 Good
6 12/2/
2014 11:00 PM
Trengganu Kuala Trengganu
24 Good
7 12/2/
2014 11:00 PM
Pahang Jerantut 37 Good
... ... ... ... ... ... ... ... ... ... ... ... ... ... 24 57 4 10/6/ 2016
1:00 PM Sabah Sandakan 29 Good
B. Summarization Engine
Rough Set has five main steps, which are data preparation, discretization, reducts computation, rules generation, and classification. The main steps manage an information system and this will lead towards the final goal of generating rules from information’s system. In this research, the result will be presented in Rosetta. The data sample in Table 2 needs to be discretized in certain interval prior to classification using Rough Set. The discretization technique that has been chosen is Boolean Reasoning.
The reducer selected is Genetic Algorithm. The data has been split into training and testing set where the splitting factor is 80:20. This splitting has been chosen since the technique tends to generate very large rules. From the data training set, Rough Set generates reducts and rules for the classifier. Table 3 shows several reducts that have been generated. The rules length are between one until three.
Table 3
Sample Reducts for Malaysia API Dataset
No. Reducts Support Length
1 {Region} 100 1
2 {API} 100 1
3 {Date, Time} 100 2
4 {Date, State} 100 2
5 {Time, Region} 100 2
6 {Date, Time, Region} 100 3
7 {Date, Time, State} 100 3
Table 4 presents several rules from 7063 generated rules. The rule supports are in the range 1 to 21754. The sample explanations for rule that given in table 4 as follows:
Rule 1: API([*, 51)) => Decision(good)
Based on the value given in the rule condition, the rule can be interpreted as:
Table 4
Sample Rules for Malaysia API Dataset
No. Reducts LHS Support RHS
Support LHS Coverage RHS Coverage
Rule
Length
1 API([*, 51)) => Decision(good) 21754 21754 0.885245 1.0 1
2 API([51, 100)) => Decision(moderate) 2811 2811 0.114389 1.0 1
3 Date(2014-11-26 00:00:00) AND State(Sarawak) =>
Decision(good)
240 240 0.009766 0.011032 2
4 Time(7:00PM) AND State(Perak) => Decision(good) 100 100 0.004069 0.004597 2
5 Time(10:00AM) AND Region(Indera Mahkota,
Kuantan) => Decision(good)
20 20 0.000814 0.000919 2
6 Date(2014-12-07 00:00:00) AND Time(6:00AM) AND
State(Sarawak) => Decision(good)
10 10 0.000407 0.00046 3
The description of the rule statistics are as follows:
1) The rule support is 21754, represents 21754 objects in the training data set that are matched with the rule condition.
2) The rule accuracy is 1, represents the number of Right Hand Support (RHS) divided by the number of Left Hand Support (LHS):
21754/21754 = 1.
3) The conditional coverage is 0.885245; it represents the fraction of the records that satisfied the IF condition of the rule. It is obtained by dividing the support of the rule by the total number of records in the training data set.
4) The decision coverage is 1.0, and it is the fraction if the training records that satisfied the THEN conditions. It is obtained by dividing the support of the rule by the number of records in the training data set that satisfied the THEN condition.
5) The rule length is defined as the number of conditional elements in the IF part. In Rule 1 there is one attribute being used as conditional elements; API.
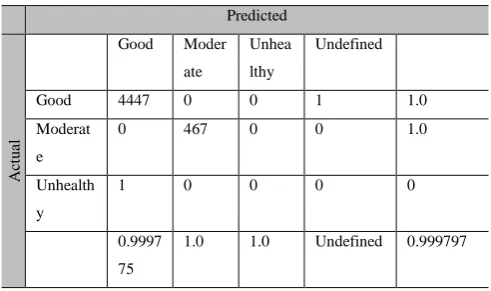
Table 5 shows the confusion matrix for the testing result of classifying based on testing dataset. The testing accuracy for classifying is 99.99% of the dataset.
Table 5
Confusion Matrix for Malaysia API Dataset
Predicted
A
ct
u
al
Good Moder
ate
Unhea
lthy
Undefined
Good 4447 0 0 1 1.0
Moderat
e
0 467 0 0 1.0
Unhealth
y
1 0 0 0 0
0.9997
75
1.0 1.0 Undefined 0.999797
the rule generated. The dataset which selected will be shown to chart. This dataset is intended to make easier to present the result of the analysis in the mobile device.
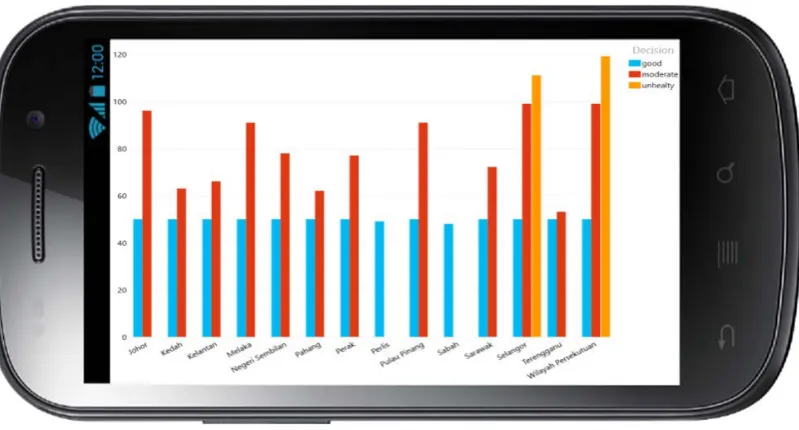
In Malaysia, there are Malaysian Air Quality Guidelines (MAAGs) that has been adapted to the recommendations of the World Health Organization [35]. Figure 2 displays the API in each state in Malaysia with their API’s conditions with map chart. This result also can send an alert to the state where the air quality that is measured to be dangerous for the public because could damage the epidermis, affects the immune reaction, and by mixing pollen, can increase the likelihood of allergic diseases such as asthma, allergic rhinitis and allergic conjunctivitis [36]. Figure 3 shows the dataset with another chart, bar chart. From this chart, the highest or lowest API from each state in Malaysia can be seen. It is also possible to give a warning in dangerous areas that has the highest API and the government can also to be aware of this condition.
VI. CONCLUSION
Figure 2: Map Chart from Selected Data
Figure 3: Bar Chart from Selected Data
ACKNOWLEDGMENT
This work is supported by Ministry of Higher Education Malaysia (MOHE), Ministry of Science, Technology and Innovation Malaysia (MOSTI) and Universiti Teknologi Malaysia (UTM). This paper is financially supported by E-Science Fund, R.J130000.7928.4S117, PRGS Grant, R.J130000.7828.4L680, GUP Tier 1 UTM, Q.J130000.2528.13H48, FRGS Grant, R.J130000.7828.4F634 and IDG Grant, R.J130000.7728.4J170. The Authors would like to express their deepest gratitude to the Research Management Centre (RMC), UTM for the support in research and development, Malaysian Administrative Modernisation and Planning Unit (MAMPU) for the shared Malaysia’s open government data and Soft Computing Research Group (SCRG) for the inspiration and make this study success. Authors would also like to thank the anonymous reviewers who have
contributed enormously to this work.
REFERENCES
[1] Tabuenca, B., Kalz, M., Drachsler, H., & Specht, M, “Time Will Tell: The role of mobile learning analytics in self-regulated learning”, Computers & Education, 89, 53–74, 2015.
[2] Iqbal, A., Wang, H., & Gao, Q.,“A histogram method for summarizing multi-dimensional probabilistic data,” Procedia Comput. Sci., vol. 19, pp. 971–976, 2013.
[3] Xiang, Y., Jin, R., Fuhry, D., & Dragan, F. F. “Summarizing transactional databases with overlapped hyperrectangles,” pp. 215– 251, 2011.
[4] Bouguila, N., & Ziou, D. “Unsupervised learning of a finite discrete mixture: Applications to texture modeling and image databases summarization,” J. Vis. Commun. Image Represent., vol. 18, no. 4, pp. 295–309, 2007.
[5] Nurulhawa, S., “Thesis: Mobile Database Summarization Using Rough Set”, Universiti Teknologi Malaysia, 2005.
[7] Siemens, G., & Long, P, “Penetrating the fog: analytics in learning and education”, Edu cause Review, 46(5), 30, 2011.
[8] Kumar, V, “Mobile Database Systems", Wiley, 2006.
[9] Kottursamy, K., Raja, G., Padmanabhan, J., & Srinivasan, V., "An improved database synchronization mechanism for mobile data using software-defined networking control", Computers & Electrical Engineering, 0, 1–11, 2016.
[10] Moldovan A-N, Weibelzahl S, & Muntean CH., "Energy-aware mobile learning: opportunities and challenges", IEEE Commun Surv Tutor;16(1):234–65, 2014.
[11] IbikunleF, A. & Adegbenjo, A., "Management Issues and Challenges in Mobile Database System", 5(1), 1–6, 2013.
[12] Barbara, D., "Mobile computing and databases–a survey", IEEE Trans Knowl Data Eng;11(1):108–17,1999.
[13] Derhab A, & Badache N., "Data replication protocols for mobile ad-hoc networks", A Surv Taxono IEEE Commun Surv Tutor;11(2):33– 51, 2009.
[14] Shen B, Wang Z, & Liu X., "Sampled-data synchronization control of dynamical networks with stochastic sampling", IEEE Trans Autom Control ;57(10):2644–50, 2012.
[15] Lee, S., Suh, J., & Park, H. D., "BoreholeAR: A mobile tablet application for effective borehole database visualization using an augmented reality technology", Computers and Geosciences, 76, 41– 49, 2015.
[16] HammarBerg E, & Gustaffson T., "A partial database synchronization scheme between a centralized server and mobile units (Dissertation)", University of Gothenburg, 2011.
[17] Artail, H., Shihab, M., & Safa, H., "A distributed mobile database implementation on Pocket PC mobile devices communicating over Bluetooth", Journal of Network and Computer Applications, 32(1), 96–115, 2009.
[18] Jeong, H., Ko, Y., & Seo, J, “How to Improve Text Summarization and Classification by Mutual Cooperation on an Integrated Framework”, Expert Systems With Applications, 60, 222–233, 2016. [19] Radev, D. R., Hovy, E., & McKeown, K., "Introduction to the special
issue on summarization," Computational Linguistics, vol. 28, pp.399-408, 2002.
[20] Mani, I., “Automatic summarization” (pp. 1–2). John Benjamins Publishing Com- pany, 2001.
[21] Gerani, S., Carenini, G., & Ng, R. T., “Modeling content and structure for abstractive review summarization”, Computer Speech and Language, 2016.
[22] Emre, F., Akay, D., & Yager, R. R., “An overview of methods for linguistic summarization with fuzzy sets”, Expert Systems With Applications, 61, 356–377, 2016.
[23] Han, J., & Kamber, M., “Data Mining: Concepts and Techniques”, Morgan Kaufmann Publishers Inc., San Francisco, CA, USA, 2000. [24] Yager, R. R.,& Reformat, M. Z., “Looking for like-minded
individuals in social networks using tagging and e fuzzy sets”, IEEE Transactions on Fuzzy Systems, 21 (4), 672–687, 2013.
[25] Svore, K. , Vanderwende, L. , & Burges, C., “Enhancing single-document sum- marization by combining ranknet and third-party sources”, In Proceedings of the 2007 international conference on empirical methods in natural language processing and computational natural language learning (pp. 448–457), 2007.
[26] Ko, Y. , & Seo, J., “An effective sentence-extraction technique using contextual information and statistical approaches for text summarization”, Pattern Recognition Letters, 29, 1366–1371, 2008. [27] Li, L. , Wang, D. , Shen, C. , & Li, T., “Ontology enriched multi
document summarization in disaster management”, In Proceedings of the 33rd international ACM-SIGIR conference on research and development in information retrieval (pp. 819–820), 2010.
[28] Astonkar, M., & Buchade, A., “Exploring Mobile Analytics for Business Intelligence”, International Journal of Computer Science and Mobile Computing, 3(12), 603–611, 2014.
[29] Jayaram, D., Manrai, A. K., & Manrai, L. A. “Effective use of marketing technology in Eastern Europe: Web analytics, social media, customer analytics, digital campaigns and mobile applications”, Journal of Economics, Finance and Administrative Science, 20(39), 118–132, 2015.
[30] Pawlak, Z., “Rough Sets”, International Journal of Computer and Information Science, 11(5), 341–356, 1982.
[31] Rissino, S., & Lambert-Torres, G, “Rough Set Theory–Fundamental Concepts, Principals, Data Extraction, and Applications”, Data Mining and Knowledge Discovery in Real Life Applications, J. Ponce
based attribute subset selection for intrusion detection using parallel genetic algorithm in MapReduce,” Simul. Model. Pract. Theory, vol. 0, pp. 1–12, 2016
[34] Fang, B. W., & Hu, B. Q., “Probabilistic graded rough set and double relative quantitative decision-theoretic rough set,” Int. J. Approx. Reason., vol. 74, pp. 1–12, 2016
[35] Kim, H., Park, Y., Park, K., & Yoo, B.: Association between Pollen Risk Indexes, Air Pollutants, and Allergic Diseases in Korea. Osong Public Heal. Res. Perspect. 7, 172–179, 2016.