WALKER, AARON L. Behavioral Modeling and Characterization of Nonlinear Operation in RF and Microwave Systems. (Under the direction of Professor Michael B. Steer).
by
Aaron L. Walker
A dissertation submitted to the Graduate Faculty of North Carolina State University
in partial satisfaction of the requirements for the Degree of
Doctor of Philosophy
Electrical Engineering
Raleigh
2005
Approved By:
Dr. Kevin G. Gard Dr. W. Rhett Davis
Biography
Acknowledgements
I would like to express my appreciation for the support and guidance provided by my advisor Dr. Michael Steer during my PhD research. His considerable knowledge of all things microwave aided greatly in the completion of my work. I am also grateful for the access to Dr. Steer’s professional contacts that resulted in funding for my research by ARO and the NAVSEA EODTECHDIV. I would also like to thank the members of my committee Dr. Kevin Gard, Dr. Gianluca Lazzi, and Dr. Rhett Davis as well as Dr. Doug Barlage for their comments and discussions on my research.
Contents
List of Figures ix
List of Tables xii
List of Symbols xiii
1 Introduction 1
1.1 Motivations and Objectives of This Study . . . 1
1.2 Behavioral Modeling of Nonlinear Systems . . . 2
1.3 Metrology for Nonlinear Behavior . . . 3
1.4 Overview of RF Manufacturing Test Challenges . . . 4
1.5 Original Contributions . . . 4
1.6 Thesis Overview . . . 6
1.7 Published Works . . . 7
1.7.1 Journals . . . 7
1.7.2 Conferences . . . 7
1.8 Unpublished Works . . . 8
2 Review of Nonlinear Analysis, Behavioral Modeling, and Measurement Techniques 9 2.1 Introduction . . . 9
2.2 Description of Nonlinear Behavior . . . 10
2.3 Review of Analysis Techniques . . . 12
2.3.1 Small-signal Analysis . . . 12
2.3.2 Large-signal Analysis . . . 12
2.4 Review of Behavioral Modeling Techniques . . . 16
2.4.1 Common Nonlinear Behavioral Models . . . 17
2.4.2 RF Behavioral Modeling Techniques . . . 21
2.5 Review of Measurement Techniques . . . 26
2.5.1 Small-signal Measurements . . . 27
2.5.2 Large-signal Measurements . . . 27
2.6 Summary . . . 32
3 Nonlinear Metrology 33 3.1 Review of Two-Tone Measurements . . . 34
3.1.1 Stimulus Sources . . . 34
3.1.2 Stimuli Combination Devices . . . 35
3.1.3 Isolators . . . 37
3.1.4 Stimulus Amplification . . . 37
3.1.5 Passive Intermodulation . . . 38
3.2 Wireless Two-Tone Measurement . . . 39
3.2.1 Nonlinear Reflection . . . 39
3.2.2 Wireless Characterization Apparatus . . . 41
3.3 Multi-Channel Feed-Forward Cancellation System to Improve Dynamic Range 42 3.3.1 Feed-Forward Justification . . . 44
3.3.2 Cancellation Mechanisms . . . 45
3.3.3 Cancellation System Architecture . . . 46
3.3.4 Limitations of the Cancellation System . . . 50
3.3.5 Quantization Noise Limit on Cancellation . . . 50
3.4 Intermodulation Relative Phase Measurement . . . 55
3.4.1 Intermodulation Phase Measurement Background . . . 57
3.4.2 Vector Intermodulation Analyzer for Measuring Relative Intermodu-lation Phase Versus Input Power . . . 59
3.4.3 Vector Signal Analyzer-Based Vector InterModulation Analyzer . . . 63
3.5 Summary of Metrology System Development . . . 69
4 The Multi-Slice Behavioral Model 71 4.1 Behavioral Modeling Justification . . . 72
4.2 Description of Multi-Slice Model . . . 72
4.3 Features of the Multi-Slice Model . . . 73
4.3.1 Modularity . . . 73
4.3.2 Applicability to Multiple Simulation Types . . . 74
4.3.3 Capture of Memory Effects . . . 74
4.4 Multi-Slice Model Extraction . . . 80
4.5 Summary . . . 82
5 Remote Characterization of RF Devices 84 5.1 Introduction . . . 84
5.2 Two-Way Radio Characterization . . . 85
5.3 AMPS Cellular Phone Characterization . . . 88
5.4 Characterization of Various Electronic Products . . . 88
5.5 Development of a Single-Slice Model for the Two-Way Radio Response . . . 92
5.5.1 Power Off Third-Order Model Extraction . . . 94
5.5.2 Power Off Fifth-Order Model Extraction . . . 98
5.5.3 Power On Model Extraction . . . 98
5.5.5 Power On Fifth-Order Model Extraction . . . 101
5.6 Conclusion . . . 101
6 A Low-Noise Amplifier Modeled with a Multi-Slice Behavioral Model 104 6.1 Introduction . . . 104
6.2 Amplifier Multi-Slice Behavioral Model Extraction . . . 105
6.2.1 Linear Networks . . . 105
6.2.2 Nonlinear Blocks . . . 107
6.3 Application of the Magnitude-Only Model . . . 109
6.4 Conclusion . . . 116
7 Multi-Slice Behavioral Models of Nonlinear Amplifiers with Memory Em-ploying Vector Intermodulation Measurements 119 7.1 Introduction . . . 119
7.2 Development of the Multi-Slice Model Incorporating IMD Phase Information 120 7.2.1 Model Parameter Extraction . . . 120
7.3 Comparison of Power Amplifiers . . . 121
7.3.1 MESFET Amplifier . . . 121
7.3.2 MOSFET Instrumentation Amplifier . . . 123
7.3.3 Darlington HBT Amplifier . . . 124
7.4 Summary of Results . . . 126
8 In-Circuit Filter Tuning Using a Nonlinear Distortion Response from a One-Port Measurement 137 8.1 Introduction . . . 137
8.2 Overview of Filter Tuning in RF Systems . . . 138
8.3 Overview of Filter Tuning Using an Intermodulation Distortion Response . 139 8.4 Filter Transmission Extraction via Intermodulation Distortion . . . 140
8.5 Filter Tuning Example . . . 143
8.6 Conclusion . . . 146
9 Conclusions and Future Work 152 9.1 Summary of Research and Original Contributions . . . 152
9.2 Future Research . . . 154
A Intermodulation Phase Measurement System Calibration 155 A.1 Effect of Source Phase Shift on Measurements . . . 156
B Algorithm Details for the Multi-Tone Cancellation System 159 B.1 Algorithm Equations . . . 160
B.1.1 Miscellaneous Implementation Details . . . 164
B.1.2 Matlab Code for Computation of the Exponent Term Table . . . 164
B.2 C Code for Algorithm Execution on a Freescale 56F8323 DSP . . . 165
B.2.1 Main Function . . . 165
B.2.2 Macro Definitions . . . 175
B.2.4 Power Difference Exponent Search . . . 178
B.2.5 Multiplication Routine for Mixed Unsigned Fractional and Integer Values . . . 181
B.2.6 Multiplication Routine for an Unsigned Fractional and Signed Integer Values . . . 182
B.2.7 Peripheral Initialization Function . . . 182
B.2.8 Quadrature Magnitude Update Function . . . 184
B.2.9 Quadrant Search Function for Quadrature Phase Adjustment . . . . 186
B.2.10 Quadrature Phase Update Function . . . 187
B.2.11 Interrupt Service Routines . . . 189
C Matlab Code for Magnitude-Only Multi-Slice Model Extraction 194 C.1 Main Script . . . 194
C.2 Correction of Measured IM3 Magnitude for Source Flatness . . . 200
C.3 Extraction Script for Linear Networks of First Slice . . . 201
C.4 Pre-Linear Network Extraction Function . . . 203
C.5 Post-Linear Network Extraction Function . . . 204
C.6 Third-Order Coefficient Extraction from Measured Two-Tone Response . . 205
C.7 Modified Polynomial Fit Function . . . 206
C.8 Memoryless Polynomial Coefficient Extraction Function . . . 207
C.9 Baseband Contribution Extraction Function . . . 208
C.10 Model Output Generation Function . . . 209
D Matlab Code for Complex Multi-Slice Model Extraction 213 D.1 Scripts for GaAs MESFET Amplifier . . . 213
D.1.1 RF Source Correction Script . . . 213
D.1.2 Model Parameter Extraction and Output Generation Script . . . 221
D.2 Scripts for MOSFET Amplifier . . . 234
D.2.1 RF Source Correction Script . . . 234
D.2.2 Model Parameter Extraction and Output Generation Script . . . 242
D.3 Scripts for Darlington HBT Amplifier . . . 255
D.3.1 RF Source Correction Script . . . 255
D.3.2 Model Parameter Extraction and Output Generation Script for Man-ual Selection of Third and Fifth-Order Coefficients . . . 265
D.3.3 Model Parameter Extraction and Output Generation Script for Ge-netic Algorithm Fitting Procedure . . . 274
D.3.4 Model Parameter Extraction and Output Generation Script for Levenberg-Marquadt Fitting Procedure . . . 287
E Post-Processing Details for Raw Vector Measurements in the In-Circuit Filter Tuning Application 300 E.1 Matlab Code for Execution of Post-Processing . . . 301
List of Figures
2.1 Response of a nonlinear system to discrete tone stimulus. . . 11 2.2 Depiction of Volterra-series. . . 14 2.3 AM-AM, AM-PM model representation with the amplitude and phase
mod-ulation components considered separately (after [30]). . . 19 2.4 Diagrams of Wiener, Hammerstein, and Wiener-Hammerstein block model
representations of nonlinear systems with memory. . . 20 2.5 PA model for a system with memory using the parallel Wiener model (after
[39]). . . 23 2.6 PA model for a system with memory using a memory polynomial model with
unit delay taps (after [9]). . . 24 2.7 PA model using a memory polynomial model with sparse delay taps (after [9]). 25 2.8 Simple general circuit for IMD asymmetry analysis, (after [43]). . . 26 2.9 Basic two-tone measurement apparatus. . . 29 3.1 Basic configuration for two-tone measurement apparatus employing
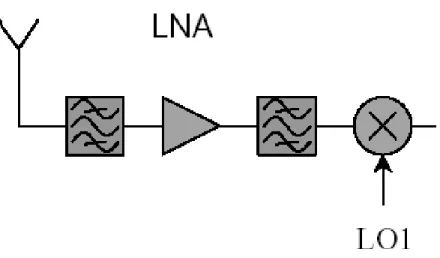
indepen-dent signal sources. . . 34 3.2 High power two-tone measurement system with independent stimulus paths. 38 3.3 Typical RF receiver frontend with bandpass filter, LNA, image reject filter
and RF mixer. . . 40 3.4 Diagram of RF frontend considering nonlinear reflection as generating a
non-linear response (f()) that travels through the frontend linear network and re-radiates. . . 41 3.5 Wireless two-tone characterization apparatus designed to minimize system
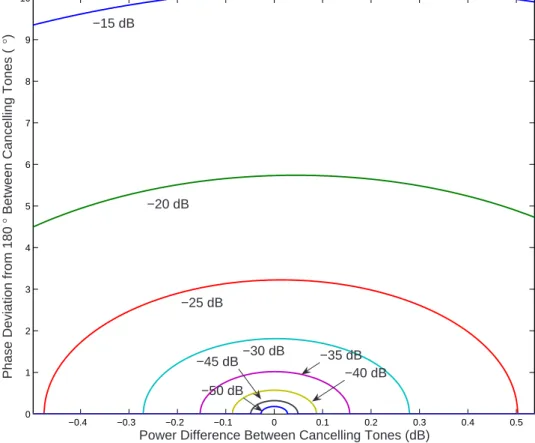
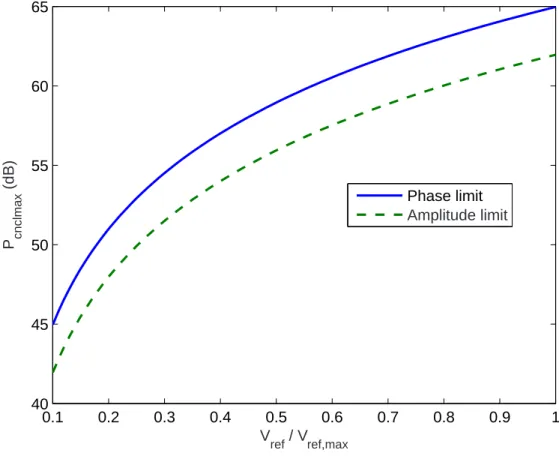
generated IMD. . . 43 3.6 Cancellation contours depicting the amount of phase and amplitude errors
allowable for a given cancellation level. . . 47 3.7 Schematic of active interference cancellation system. . . 49 3.8 Quantization noise limit on cancellation for pure phase and amplitude errors. 56 3.9 Measurement system block diagram incorporating phase-locked signal sources. 60 3.10 Test setup for measuring phase calibration data for RF sources. . . 61 3.11 Measured phase insertion of RF source and step attenuator corrected phase
3.12 Corrected phase insertion of RF source vs. carrier frequency and output power demonstrating linear phase shift with output power and weak depen-dence on carrier frequency. . . 63 3.13 Block diagram of the VSA-based intermodulation phase measurement setup. 67 3.14 Block diagram of the hardware and software components of the quadrature
phase measurement system. . . 68 3.15 Flowchart depicting nonlinear distortion phase measurement utilizing
inde-pendent source and a vector signal analyzer. . . 70 4.1 Two-slice architecture of multi-slice model. . . 73 4.2 Phasor addition of first and second slice components depicting phase reference
of baseband components producing asymmetries in IM3 phase and magni-tude. Components of the IM3 response are (a) odd-ordered output from first slice, (b) upper (lower) baseband IM contribution from second slice, (c) lower (upper) baseband IM contribution from second slice, (d) total upper (lower) IM3 response from sum of slice outputs, (e) total lower (upper) IM3 response from sum of slice outputs. . . 81 5.1 Narrow band IM3L response of a powered two-way radio to RF illumination
under swept frequency and power. . . 86 5.2 Narrow band IM3L response of an un-powered two-way radio to RF
illumi-nation under swept frequency and power. . . 87 5.3 Frequency response of IM3L in the handset transmit band for RF illumination
of un-powered AMPS cellular phone. . . 89 5.4 Frequency response of IM3L in the handset receive band for RF illumination
of un-powered AMPS cellular phone. . . 90 5.5 Frequency response of IM3L product from PCI video card under wide-band
RF illumination. . . 91 5.6 Two-way radio normalized linear system estimation. . . 96 5.7 Third-order model extraction results for a two-way radio in the power off state 97 5.8 Estimate of the fifth-order intermodulation response for a two-way radio in
the power off state based on a fifth-order model extraction . . . 99 5.9 Estimate of the third-order intermodulation response for a two-way radio in
the power off state based on a fifth-order model extraction . . . 100 5.10 Estimate of the third-order intermodulation response for a two-way radio in
the power on state based on a third-order extraction . . . 102 6.1 A two slice nonlinear system behavioral model with passband modeling. . . 106 6.2 Extracted pre-filter and post-filter frequency responses. . . 111 6.3 Measured output power of (a) IM3H and (b) IM3L at −15 dBm input tone
power. . . 112 6.4 Measured (+) and modelled (line) fundamental output power at (a)−1 dBm,
6.7 IM3 modelled and measured response at 3 GHz,Pout vs. Pin. . . 116
6.8 IM3 modelled and measured response at 3 GHz,Vout vs. Vin. . . 117
7.1 Measured magnitude and phase of the IM3 products for the Mini-Circuits 5 W amplifier. . . 123
7.2 Measured and estimated magnitude and phase of Mini-Circuits amplifier IM3 products using a single-slice model. . . 128
7.3 Measured and estimated magnitude and phase of Mini-Circuits amplifier IM3 products using a two-slice model. . . 129
7.4 Polar form of the fit to the Mini-Circuits amplifier IM3 data with the mag-nitude in dB, (magmag-nitudes offset such that they are non-negative). . . 130
7.5 Measured AM-AM, AM-PM of the 10 W AR amplifier. . . 131
7.6 Measured magnitude and phase of the IM3 products for the AR amplifier. . 132
7.7 Measured and estimated magnitude and phase of AR amplifier IM3 products using a two-slice model. . . 133
7.8 Measured AM-AM, AM-PM of the Hittite Darlington amplifier. . . 134
7.9 Measured magnitude and phase of the IM3 products for the Hittite amplifier.135 7.10 Measured and estimated magnitude and phase of Hittite amplifier IM3 prod-ucts using various fitting techniques to extract the one-slice model, (∗- IM3L measured, ×- IM3H measured, 2 - two-tone fit toa3 and a5, + - nonlinear optimization fit to both data sets, ¦ - GA fit to both data sets.) . . . 136
8.1 Typical two-port frequency response of a bandpass filter with a high-side transmission zero. . . 140
8.2 Model of nonlinearly loaded filter. . . 141
8.3 VSA-based VIMA reflection measurement setup. . . 143
8.4 Schematic of nonlinearly loaded bandpass filter. . . 144
8.5 Desired and extractedS21 magnitude response for de-tuned filter. . . 146
8.6 Desired and extractedS21 phase response for de-tuned filter. . . 147
8.7 Desired and extractedS21 magnitude response for properly tuned filter. . . 148
8.8 Desired and extractedS21 phase response for properly tuned filter. . . 149
8.9 Comparison of extracted de-tuned filterS21 magnitude errors and the mea-sured S11 response of the filter. . . 150
8.10 Simulated IM3L power output of the diode used as the nonlinear load for the filter under test. . . 151
List of Tables
List of Symbols
ρ Waveform quality factor
ACPR Adjacent Channel Power Ratio
AM-AM Amplitude modulation of a DUT output resulting from the magnitude of the input signal
AM-PM Phase modulation of a DUT output resulting from the magnitude of the input signal
ANN Artificial Neural Network ATE Automatic Test Equipment AWGN Additive White Gaussian Noise BER Bit Error Rate
CCDF Complementary Cumulative Distribution Function DAC Digital to Analog Converter
HBT Hetero-junction Bipolar Transistor
IIP3 Input third-order intermodulation intercept point IIR Infinite Impulse Response
IM Intermodulation
IM3 Third-order intermodulation distortion IMD Intermodulation Distortion
IMR Intermodulation Ratio LNA Low Noise Amplifier LSB Least Significant Bit MER Memory Effect Ratio
NVNA Nonlinear Vector Network Analyzer PA Power amplifier
PIM Passive InterModulation
RFIC Radio Frequency Integrated Circuit SFDR Spurious Free Dynamic Range SNR Signal to Noise Ratio
Chapter 1
Introduction
1.1
Motivations and Objectives of This Study
The inherent nonlinear behavior of semiconductor electronic devices is a major concern in the design of wireless products. Mitigation and management of nonlinear behav-ior is a focus of the microwave community as modulation formats with increasing informa-tion capacity require higher linearity in the transmit and receive circuitry to maintain signal fidelity. One of the difficulties in working with nonlinear behavior is the lack of full informa-tion about the distorinforma-tion it causes using tradiinforma-tional characterizainforma-tion techniques. Therefore, one of the main objectives of this work was the development of metrology and modeling techniques for providing information about nonlinear behavior in the frequency-domain that is difficult or impossible to obtain with existing measurement techniques, particularly the measurement and modeling of nonlinear distortion product phase. The development of a behavioral modeling architecture and extraction procedure was associated with this work which led to a model capable of estimating distortion phase and magnitude asymmetries as a function of input signal level of an amplifier for the first time.
impact on manufacturing test. The challenges in manufacturing test will arise both in the need for more complete understanding of the nonlinear behavior of the Device Under Test (DUT) and the ability to characterize internal components in the RF front-end circuitry that lack external probe points. Thus, the other major objective of this work has been the development of a remote, non-contact characterization technique for testing an integrated communications product. The development of this novel process also enabled another key component of manufacturing metrology that of extracting the two-port transmission para-meters of an integrated bandpass filter and using this information to tune the filter to the desired response.
1.2
Behavioral Modeling of Nonlinear Systems
In general, working with nonlinear behavior forces one to use tools that complicate the process of obtaining the desired solution. These include the analysis methods used to predict nonlinear operation. Ranging from simple “linearized” models to complex Volterra series analysis, these methods have limitations in either over-simplifying the problem at hand such that observed operation cannot be described, or by making the analysis so dif-ficult that few designers care to employ the analysis technique regardless of its accuracy. Numerical models suffer from the same problems as the analysis types, either too simple or so complicated that not only is the extraction problem difficult, but it is very difficult to build intuition about the system from its model. Thus, a straight-forward, modular modeling approach based on capturing known phenomena within the system would pro-vide intuition without overly complicating the process. A modular approach to the model construction problem would enable creation of a model with sufficient complexity to cover observed behavior in a directed manner. The behavioral modeling development in this work follows this approach.
design at an early stage. This type of simulation would not be possible with traditional model representations due to the simulation time required. In the testing environment, behavioral model speed allows the rapid generation of accurate test vectors that are essential to reducing test times. To be effective in these two areas, the models used must reproduce actual device and system performance, thus the models must capture all significant behavior including complex nonlinear operation.
1.3
Metrology for Nonlinear Behavior
Increased reliance on measurement-based models has generated a need for more sophisticated metrology techniques in nonlinear characterization. Traditional techniques measure implied nonlinear behavior as in AM-AM, AM-PM measurements or a simple magnitude response for multi-tone intermodulation testing. These techniques worked well for predicting device performance for constant envelope communications signals such as FM, but the lack of correlation between these measurements and the performance of components exposed to the high peak-to-average ratio of digitally-modulated signals has demonstrated the need for more advanced measurement techniques.
1.4
Overview of RF Manufacturing Test Challenges
The development of manufacturing metrology techniques should be focused on speed of the measurements and the implementation cost. Since time is proportional to cost, the speed of measurements in the laboratory needs to improve since current RF factory tests consume 60–80% of the total test time for RFICs [1]. Increasing measurement speed is not only about creating techniques that can rapidly measure device parameters, it can also include reducing the number of measurements necessary for a given device. Here a behav-ioral model-based approach to testing that utilizes a minimum number of measurements can decrease test time by comparing the specified model response and the same model response from the extracted parameters of the DUT [2].
The cost of test is a serious concern for all segments of the electronics industry including the microwave community. It is estimated by Akbay that the cost of test for RF and mixed-signal components approaches 40% of the total manufacturing cost [3]. In general the cost of test continues to increase such that the Semiconductor Industry Association (SIA) predicts by 2010 that it will cost more to test a transistor than to manufacture it [4]. The cost of attempts to utilize the test techniques of BIST and test pins from the analog and digital worlds is prohibitively high. RF BIST functionality can increase the die size by as much as 100% and is therefore discarded after the first release, [1]. In addition, the increased circuitry in a BIST solution will decrease the performance of the main circuit and additional pins for testing purposes increases the cost of the package and the test time since more RF pins need to be tested. A final consideration of the cost of RF metrology is the cost of the test equipment itself. In an ATE environment, RF equipment is very expensive, on the scale of two orders of magnitude more expensive than non-RF equipment [3]. The multi-million dollar cost of this test equipment translates to dollars-per-minute on the factory floor so techniques that utilize flexible instrumentation to perform multiple measurements is highly desirable.
1.5
Original Contributions
ease of implementation in mind, the research presented here sought to study and enhance traditional nonlinear system analysis and measurement practices used throughout the mi-crowave industry. Considerable effort was placed on performing laboratory measurements to establish the behavior of the components within a modern wireless device. Chapter 5 of this work presents for the first time a study of the phenomenology of measuring character-istics of a communications device through remote means. Sections 3.4.2 and 3.4.3 present two novel measurement techniques for determining the relative phase of the intermodulation (IM) products arising from multi-tone stimulus. These techniques have a higher dynamic range than previously published works which results in lower phase uncertainty and the ability to characterize devices with weak nonlinear behavior.
Other significant work performed in the laboratory included development of high power stimulus and response apparatus for performing remote, non-contact RF system characterization and an automatic stimulus cancellation system suitable for high-power passive intermodulation (PIM) measurements or for active co-site interference suppression. In parallel with the laboratory techniques, measurement-based model development sought to capture the complex nonlinear behavior of the systems under study. Methods to determine model architecture and parameter extraction strategies led to the development of the multi-slice behavioral model (Chapter 4). This model provides a convenient architecture for reproducing nonlinear behavior not possible with existing models. Several observed phenomena including intermodulation magnitude and phase asymmetry as a function of stimulus power can be captured easily with this model and its associated measurements, which is not possible with current models used by industry. In addition, the modeling and extraction technique enables separation of distortion into odd-ordered and baseband distortion contributions (Chapters 6 and 7). This allows characterization of the sources of nonlinear behavior that could enable design practices to mitigate the effect of these sources. A final contribution of this work was the development of a metrology process for characterizing the two-port transmission parameters of an embedded filter using only one-port measurements. This enables in-circuit tuning of an embedded filter. This technique (Chapter 8) marks the first time that this type of characterization has been performed and represents a foundation for the development of this process into a potentially valuable tool in an RF communication product manufacturing environment.
• The development of two novel, high-dynamic range measurement apparati and tech-niques for measuring the phase of IM products (Sections 3.4.2 and 3.4.3).
• Development of the multi-slice behavioral model architecture and extraction proce-dures (Chapter 4).
• Demonstration of the ability to remotely characterize RF and microwave systems (Chapter 5).
• Application of the multi-slice model extraction procedure using intermodulation phase measurements to characterize multiple contributors to nonlinear behavior in multiple RF amplifiers (Chapters 6 and 7).
• Development of a metrology technique for two-port parameter extraction (both mag-nitude and phase) of an embedded filter and demonstration of the ability to tune a filter with this process (Chapter 8).
1.6
Thesis Overview
1.7
Published Works
1.7.1 Journals
1. W. Jang, A. Walker, K. Gard, and M. B. Steer, “Capturing Asymmetrical Spec-tral Regrowth in RF Systems Using a Multi-Slice Behavioral Model and Enhanced Envelope Transient Analysis,” Int. Journal of RF and Microwave Computer-aided Engineering, In Press.
1.7.2 Conferences
1. A. Walker, M. Steer, and K. Gard, “Simple, Broadband Relative Phase Measurement of Intermodulation Products,” 65th Automated RF Techniques Group Conf. Digest,
June 2005.
2. A. Walker, M. Steer, K. Gard, K. Gharaibeh, “Multi-slice Behavioral Model of RF Systems and devices,”IEEE Radio and Wireless Conference (RAWCON), pp. 71–74, Sept. 2004.
3. A. Walker, P. M. Buff and M. B. Steer, “Remote detection of RF Systems via multi-tone sinusoidal excitation,” Government Microcircuit Applications Conf., March 2004. 4. P. M. Buff, M. B. Steer, and A. Walker, “Experimental investigation of scanning elec-tronic devices with microwave and millimeter wave signals,” Government Microcircuit Applications Conf., March 2004.
5. J. H. Shaver, J. H. Shen, and A. L. Walker “A low-cost optical pachymeter for the diagnosis of glaucoma and ocular hypertension,” Proc. 26th Annual Int’l Conf. of the
IEEE EMBS, pp. 2330–2333, Sept. 2004.
6. J. A. Janet, W. J. Wiseman, R.D. Michelli, A. L. Walker, S. M. Scoggins, “Using con-trol networks for distributed robotic systems,” 1999 IEEE International Conference on Robotics and Automation, pp. 1138–1143, May 1999.
IEEE International Conference on Systems, Man, and Cybernetics, pp. 3365–3370, Oct. 1998.
1.8
Unpublished Works
1. A. Walker, M. Steer, and K. G. Gard, “Capturing asymmetry in distortion of an RF system using a multi-slice behavioral model,” Microwave and Component Letters, in review.
Chapter 2
Review of Nonlinear Analysis,
Behavioral Modeling, and
Measurement Techniques
2.1
Introduction
The difficulty in studying nonlinear, electronic systems arises from several sources. First among these is the challenging mathematics of nonlinear behavior of circuits and systems. Compared to the rigorous and intuitively obvious nature of linear systems theory, nonlinear analysis has not been reduced to a few simple techniques and algorithms for solving analytic expressions for system behavior. Several analysis techniques have been put forth including Volterra analysis, neural networks, and combined linear analysis with simplified nonlinear models. These analysis methods can be used on a wide range of nonlinear systems, however they have weaknesses in their ability to completely predict the operation of realistic devices and systems.
pre-dict system performance. Once again this is not a trivial solution to the analysis of nonlinear behavior as the iterative numerical methods used for circuit analysis have their own limi-tations. These arise due to numerical noise and convergence of the discretized versions of the underlying differential equations. The simulation techniques used include traditional transient analysis, harmonic balance, and complex envelope, each with their areas of ap-plicability. Although design by simulator can consume considerable compute resources, designer setup time, and interpretation time, with sufficient model and analysis accuracy, valuable results can be obtained that greatly aid the implementation of the desired system. The success of a simulation however, depends not only on the algorithms and numerical solutions used, but also on the validity of the model of the system or device being simulated. Almost all modern nonlinear models are based on measurements of an actual device to de-termine its behavior. Therefore conducting successful simulations relies on a foundation of measurement techniques and model parameter extraction.
This chapter will cover a brief description of nonlinear effects and the state-of-the-art in nonlinear system analysis, behavioral modeling, and measurement techniques. These concepts are all inter-related, so no technique employed in one can ignore the implications on the other tools used in the design of circuits and systems. In particular, this review will cover the current state-of-the-art in understanding and modeling techniques for capturing the frequency-domain complexity of nonlinear operation in RF and microwave circuits and systems.
2.2
Description of Nonlinear Behavior
Nonlinear behavior in analog and RF circuits results in system output not seen in linear systems. When viewed in the time domain, nonlinear effects may appear as clipping or distortion in the reproduction of an input signal. When analyzed in the frequency domain however, the impact of nonlinear effects becomes much more clear and quantifiable.
DUT
Figure 2.1: Response of a nonlinear system to discrete tone stimulus.
the harmonics of the input signals. This frequency content in the form of ω =m1·ω1± m2·ω2±. . . mN ·ωN forN input signals to the DUT, (where the mi are integers), results
in distortion of the original signals. The IM products that arise near the original input signal (separated by the difference frequency between the interacting stimulus ωi and ωj)
are particularly troublesome as they cannot be filtered out. The harmonics and higher frequency IM products generated are of less interest in a narrowband system, except in the case of a spurious emissions or a multi-functional system where these spectral products may corrupt signals of interest in a different frequency band than the one from which they were created.
Saturation and threshold effects are also commonly observed in nonlinear devices. These effects limit the ability of the circuit to faithfully reproduce the system input, typically occurring in amplifier circuits where amplitude modulation at the input does not translate linearly to modulation at the output. These effects have become quite important as modern digital communications systems rely on modulation formats that vary both in amplitude and phase and therefore require high linearity in their transmit stages.
contributing to nonlinear behavior. Research efforts have recently been focused in this area as there are a several publications dealing with the subject of memory effects, [5–10]. Memory effects add complexity to the generation of IM products as they result in phase rotation of the multiple contributors to individual output spectral products that results in sizeable discrepancies in the predicted intermodulation performance through the classical nonlinear analyses.
2.3
Review of Analysis Techniques
2.3.1 Small-signal Analysis
Small-signal analysis is the simplest of the techniques for dealing with nonlinear circuits. The accepted definition of the small-signal region is the condition where the stimu-lus level does not result in a change in the bias conditions of the circuit. In this method, the nonlinear equations describing a system are solved for the quiescent or DC bias point. The equations are then linearized about this point under the assumption that the signal levels within the circuit are so small that they will not result in any deviation away from this operating point. With this approach, a closed-form solution to the circuit operation can be computed without iteration, thus making this method appropriate for hand-calculating a system response. The limitations of this approach are obvious as a linearized system cannot possibly predict nonlinear behavior and thus the utilization of this method is restricted to initial linear analysis to start a design, but does not offer a mechanism to predict actual circuit operation under large-signal stimulus.
2.3.2 Large-signal Analysis
about the device. The techniques of Volterra-series and power-series analysis are two of the most popular methods for performing nonlinear analysis.
Volterra Analysis
Volterra analysis is based on the concept of describing a nonlinear system through nonlinear transfer functions. These transfer functions are analogous to those in linear systems theory. Nonlinear transfer functions differ in that they are an extension of the single order linear system transfer functions to transfer functions of higher order. These transfer functions of higher order are multi-dimensional Fourier transforms of the Volterra kernels. The classical form of the Volterra-series approach is shown in Fig. 2.2, which shows the contributions to the system output via each of the kernels. The kernels themselves are
nth order impulse responses of the form h
n(t−ν1, t−ν2, ..., t−νn) that are used to find
the response of the individual orders using annth order convolution integral with the input
signalx(νi). A Volterra-series analysis defines the output as
y(t) = ∞ X
n=1
yn(t) (2.1)
whereyn(t) is given by the convolutional integral,
yn(t) =
Z t
0
Z t
0
· · ·
Z t
0
hn(t−ν1, t−ν2, ..., t−νn)x(ν1)x(ν2)· · ·x(νn)∂ν1∂ν2· · ·∂νn. (2.2) Herehn is the kernel andx(νi) is the input to the system with an order-dependent delayνi.
A useful feature of the Volterra method is that it automatically captures the memory effects of a nonlinear system, encapsulating these within the kernels regardless of the form of the input signal x(νi). This suggests that Volterra analysis can be used to fully describe any system under study. Unfortunately, the difficulties in practical application of this analysis technique precludes its widespread use.
The difficulty in employing this analysis is determining the kernels hn for all but
h
1( )
h
2( )
h
n( )
•
•
•
Σ
x(t)
y(t)
Figure 2.2: Depiction of Volterra-series.
presented the results of extracting up to the fifth-order kernel for a PHEMT amplifier. In practice, only kernels up to the third-order can easily be extracted which limits the use of Volterra analysis to weakly nonlinear systems [13]. While there is no rigid definition of weak nonlinear behavior, it is traditionally defined as systems that do not experience significant saturation, dead-zone, or hysteresis effects.
Power-series Analysis
The power-series approach uses a model with the output of the system given by,
y(t) =
N
X
n=1
yn(t) =
N
X
n=1
anxn(t). (2.3)
In the classical approach, the series coefficients an are real-valued and determined either
through a Taylor series expansion of the underling nonlinear IV equations, [15], or by per-forming a fit to observed device performance either through experimentation or simulation. A power-series analysis predicts many of the characteristics of nonlinear systems including InterModulation Distortion (IMD), harmonic production and weak saturation effects, in addition to providing an intuitive description of nonlinear operation. With the power series analysis, output products of a particular order, (e.g. third-order intermodulation (IM3), second harmonic, etc.), can be associated with a particular order of the series expansion thus providing intuition about the source of distortion within the system. Although the use of power-series analysis is common and widespread in the RF and microwave community, the classical application of the analysis does fail to capture important nonlinear behavior including memory and saturation effects.
By only using real-valued coefficients, the power-series approach can produce vec-tor sums of contribuvec-tors to spectral content with phases of either zero or 180◦. This limi-tation means that this method cannot track changes in phase of contributors as a function of input power or frequency, which are commonly observed in real devices and systems. When nonlinear memory effects occur, the use of real coefficients will not accurately pre-dict the system performance, thus limiting the effectiveness of this technique. In addition, the power-series model is a non-physical model that cannot reproduce hard saturation and threshold effects. The series in (2.3) is an unbounded equation in the input signal x(t). Even though the series must be terminated at some finite order N, the output is still un-bounded without a limit onx(t). This results in an inability of the power-series model to generalize about the behavior of the system at input power levels greater than those used for extraction of the series coefficients. Polynomials quickly diverge from the function they approximate outside of the range of inputs used to estimate the coefficients, so this requires that power-series analysis must compensate for the dynamics of the polynomial fit by pro-viding supplementary information to ensure accuracy over the desired operating range of the system being analyzed.
accu-racy of the analysis is to employ complex coefficients, [7], [16], and [17]. Since the phase of the output spectral products are vector sums of the individual contributors produced by the proper order, the use of complex coefficients allows the analysis to track phase changes as a function of input power as the contributors change magnitude with input power. Sev-eral authors have used this vector addition concept to explain memory effects in amplifiers that cannot be captured using real-valued coefficients, [8], [18], and [19]. In order to use a complex power series analysis it is necessary to measure both the phase and the magnitude of the system output. While this is a standard procedure in single-tone AM-AM, AM-PM testing, the same is not true for multi-tone analysis or complex modulation analysis since measurement of the phase of the new spectral products is quite difficult. Even with complex coefficients, power-series analysis cannot capture all possible memory effects since a com-plex coefficient can only produce individual order spectral components with a fixed phase. Thus, all output spectra produced by a particular order will have the same phase. For a two-tone analysis, this implies that the IM products for a particular order will have the same magnitudes and the same phase (ignoring an arbitrary phase constant associated with the initial phase of the stimulus), although these will not be limited to the 0◦ or 180◦ values imposed by a real-valued power series analysis.
2.4
Review of Behavioral Modeling Techniques
sim-ulation allows analysis of complicated systems and circuits to aid the designer at an early stage.
Behavioral modeling is always based on measurements or device-level simulations of system operation. Hence measurement techniques for extracting the model parameters are very important and cannot be overlooked when designing a new model architecture. Since behavioral modeling is a technique for producing an approximation of real system operation, there are an infinite number of possible model formulations. The limitless flexi-bility in model design opens the door to designs that accurately reproduce system behavior, but do not increase the intuition of the designer that should be the goal of all good mod-eling approaches. This section will cover the commonly used model architectures and the state-of-the-art in the behavioral modeling community.
2.4.1 Common Nonlinear Behavioral Models
Measurement-based behavioral models have existed for some time in the RF and microwave community as well as other scientific disciplines, most notably in biology. Several approaches have been used to capture nonlinear operation both with and without memory effects. The power-series and Volterra-series analysis approaches in the previous section have also been used as the basis of many modeling efforts. Hybrid approaches using memoryless nonlinear functions and linear networks to capture memory effects have also been used extensively.
Volterra Series Modeling
The Volterra-series formality has been used by numerous groups to produce be-havioral models, [11], [12], [14], and [20–28]. The difficulty with using the Volterra method for measurement-based models is at least as difficult as formulating the analytical repre-sentation of this model. While Chua and Boyd, [11], have written several papers on the procedure of measuring the Volterra kernels directly in the frequency domain, their efforts were limited to weak nonlinearities with only third-order and lower-order kernels consid-ered. The complexity of measuring the kernels with the limited applicability to strong nonlinearities has limited this approach to very few real applications.
has focused on developing analyses to predict third-order IMD and magnitude asymme-tries in nonlinear circuits, primarily power amplifiers. This work uses circuit-level models built with circuit primitives consisting of linear and nonlinear passive components and cur-rent sources. Maas developed the method of nonlinear curcur-rents which is a modification of Volterra series analysis in order to predict nonlinear behavior using these circuit models. The nonlinear currents method simplifies Volterra analysis by only requiring the computa-tion of the frequency components of interest for each order of the Volterra kernels instead of the entire frequency response of the kernel. The computation of the kernels proceeds serially from first order to the highest order of interest where the output from each lower order comprise the current source(s) responsible for the next higher order. While this tech-nique was used by both groups to predict intermodulation performance of real amplifier circuits [23] and [26], the use of a Volterra basis limits this technique to third-order models since computation of higher-order current sources becomes intractable. Thus it cannot han-dle large signal nonlinear behavior where the response can no longer be considered weakly nonlinear.
Another group utilizing a modification to the Volterra series formalism is that of Verbeyst and Bossche. Their development of the VIOMAP, (Volterra Input Output Map), also sought to produce a model based on a subset of the Volterra kernel’s ability to cover any frequency. In this work the VIOMAP is extracted using standard active load-pull type measurements with the map consisting of kernels at specific frequency points of interest for the response of the DUT [27]. By restricting the measurements to a subset of the possible load impedances usually measured in a load-pull analysis, the VIOMAP results in faster DUT characterization. The extracted VIOMAP does a good job of predicting the gain of a weakly nonlinear system to varying load impedance and has been suggested as being the S-parameter equivalent for nonlinear devices. The VIOMAP is not restricted to load-pull prediction and has been used by this group to generate pre-distortion techniques that can improve the ACPR of an amplifier compared to pre-distortion computed from single-tone nonlinear characterization [28].
Power-series Modeling
Figure 2.3: AM-AM, AM-PM model representation with the amplitude and phase modu-lation components considered separately (after [30]).
of a microwave circuit or system including power amplifiers, low-noise amplifiers, and mix-ers, [29]. The traditional usage of this model involves measuring the single-tone AM-AM behavior of a nonlinear DUT and then fitting a real-valued polynomial to the resulting output as a function of input voltage. This measurement is performed in the frequency do-main so it redo-mains to translate the RMS values measured to those useful for a time-dodo-main, instantaneous model of the form in (2.3) that can be used in any type of simulation envi-ronment, [31]. Extension to the complex-valued coefficients covered previously uses both AM-AM and AM-PM measurements that are obtainable with modern microwave vector network analyzers (VNA). One form of an AM-AM, AM-PM model is shown in Fig. 2.3 where it is assumed that the amplitude modulation and phase modulation effects are in-dependent. Here the phase component is computed first since the amplitude modulation effect modifies the amplitude of the input signal. Another implementation of this type of model uses the complex coefficients directly, computing the output of the model as
y(t) =
N
X
n=1
Re(anxn(t)). (2.4)
f( )
K(s)
H(s)
f( )
H(s)
f( )
K(s)
x(t)
x(t)
x(t)
y(t)
y(t)
y(t)
Figure 2.4: Diagrams of Wiener, Hammerstein, and Wiener-Hammerstein block model rep-resentations of nonlinear systems with memory.
of circuits with any type of memory effects. While this is expected since the power-series approach assumes a memoryless nonlinearity, the technique is valuable as an idealization of a nonlinear component and can be augmented with additional model constructs to increase modeling accuracy.
Hybrid Models
In the following, the definition of hybrid corresponds to models that use a memo-ryless polynomial or power-series representation for the nonlinearity combined with linear networks in a cascade network. These networks, also referred to as block models, are classified according to the order of the linear and nonlinear components as Wiener, Ham-merstein, and Wiener-Hammerstein models, (Fig. 2.4). These models are widely used in the study of biological systems for simulating the complex behavior of the nervous system, vision, and numerous other processes [32–37]. They have also been applied to nonlinear circuits, [5, 7, 14]. The usefulness of the hybrid technique is that the analysis and parame-ter extraction for a single cascade model with a single nonlinear process is much simpler than that of the Volterra-series approach, while still allowing for the model to capture some memory effects.
Although a graphical description of the Volterra-series approach, e.g. Fig. 2.2, appears to be composed of multiple parallel block structures, in the use of hybrid structures a single nonlinear block represents the entire nonlinearity whether described by a Volterra-series or a polynomial. The field of system identification employs multiple variations of block architectures to create parallel linear-nonlinear-linear (PLNL), single-input multiple-output (SIMO), and multiple-input multiple-multiple-output (MIMO) structures [32], however this field deals with rather abstract applications of the modeling theory which do not readily translate to nonlinear circuits.
2.4.2 RF Behavioral Modeling Techniques
As the complexity of modern RF/microwave systems grows, the need for accurate models that allow simulation of the entire system has grown considerably. In addition to complexity, the push for better spectral efficiency, lower power consumption, and lower noise require that models must capture behavior that has long been ignored. Simulation at the system level also requires models to accurately predict the metrics of modern com-munications systems including Adjacent Channel Power Ration (ACPR), Bit Error Rate (BER), and Error Vector Magnitude (EVM). These requirements have resulted in signifi-cant developments in behavioral modeling of microwave systems and components by several groups.
AM-AM measurements. In [7] the authors further developed the statistical modeling work to predict distortion in a multi-channel WCDMA amplifier. A recent focus of this group has been the separation of correlated and uncorrelated in-band distortion for digitally modulated signals [10] and [40]. In [10], the authors presented an extension of the concept of distortion that results in gain expansion and compression of the desired output of an amplifier and that of uncorrelated distortion that contributed a noise component similar to AWGN. The result of this work showed that by measuring the uncorrelated distortion term using a feed-forward cancellation technique to separate the uncorrelated and correlated components, the measured uncorrelated distortion could be used to accurately model the measured SNR, EVM, andρ of a CDMA signal.
Figure 2.5: PA model for a system with memory using the parallel Wiener model (after [39]).
circuit design of the amplifiers.
Figure 2.6: PA model for a system with memory using a memory polynomial model with unit delay taps (after [9]).
words the phase shift of the IM products, particularly those resulting from fundamental interaction with the baseband components due to even-order distortion. The description of parallel processes can accommodate multiple nonlinear effects such as odd-order transcon-ductance distortion and the mixing of the input signal with even-order distortion (generated in the input nonlinear resistance) at the output transconductance of BJT devices.
Figure 2.8: Simple general circuit for IMD asymmetry analysis, (after [43]).
Volterra kernels are given by the weighting of the filter coefficients. The use of Artificial Neural Networks (ANN) for model architectures was also shown to be similar to an FIR structure. However, the arbitrary nature of the fitting procedure for the synaptic weights in ANN models limits the intuition that can be gained from these types of models. However, ANN models do exhibit a better ability to generalize system output than polynomial-based models that rapidly deviate from observed behavior outside of the range of data used to extract the model.
2.5
Review of Measurement Techniques
system does not distort the measured nonlinear parameters. Metrics for quantifying the effects of nonlinear components under realistic stimulus signals have introduced new con-cepts in measurement, but these metrics are several layers of abstraction above the low-level phenomena making interpretation of the results difficult to decipher. Since time-domain instrumentation does not typically possess the dynamic range required to fully characterize RF/microwave components and systems, the measurements described here are conducted in the frequency-domain.
2.5.1 Small-signal Measurements
Compared to the time-domain methods used in analog and digital testing, the majority of measurements in the RF and microwave domain are done with frequency domain instruments. The most common instrument for measuring linear performance of multi-port devices in the frequency domain is the vector network analyzer. By relying on the linear assumption that no additional spectral content is produced by the device under test, this instrument can characterize all of the parameters necessary to define the network equations describing the current and voltage behavior at the DUT ports through the scattering or S-parameters. The linear nature of these measurements allow sophisticated error models to remove all of the systematic error sources within the measurement apparatus, both phase and magnitude errors due to impedance mismatch, dispersion, and loss. Many microwave components, (including cables, connectors, passive devices, and antennas), remain linear over a wide dynamic range of power levels so these measurements are sufficient for fully defining system operation. However, for devices with nonlinear behavior, the small-signal analysis techniques do not apply since these cannot capture the effects of this behavior.
2.5.2 Large-signal Measurements
AM-AM, AM-PM Measurements
The simplest measurement procedure for quantifying nonlinear behavior are the AM-AM, AM-PM measurements. These measurements are taken by driving a DUT with a single-tone, constant frequency stimulus and varying the tone power. The AM-AM compo-nent, relates the effect of sweeping the DUT input amplitude to the amplitude of the DUT output. This is done strictly on a magnitude basis for a single tone, thus representing an RMS or peak magnitude. An AM-PM measurement tracks the change in phase of the DUT output compared to the input phase as a function of the input power. Both of these char-acterizations essentially measure the deviation of the device operation from the linear case and are not an explicit measure of the nonlinear behavior. In addition, this technique only characterizes the device operation at a single frequency, thus multiple measurements must be performed in order to capture the carrier frequency dependency of the nonlinear effects. Since the stimulus used in this measurement is a single frequency, it cannot capture any of the memory effects that correspond to baseband impedance or even-order distortion. Ad-ditional difficulty in relying on these measurements to describe device functionality comes from the poor correlation in single-tone performance to operation under realistic stimulus scenarios such as digital modulation [13] and [45].
Two-tone Measurements
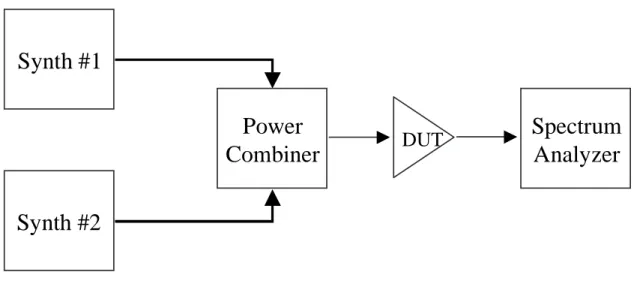
The use of a stimulus comprised of multiple non-commensurate sinusoidal tones is the most widely used technique for measuring nonlinear behavior. As described previ-ously, nonlinear operation results in the generation of additional spectral content and it is this content that is used to provide metrics on the linearity or lack thereof of a DUT. The well-known metrics of third-order Input Intermodulation Intercept Point (IIP3) and InterModulation Ratio (IMR) are used heavily in the microwave industry for assessing the performance of devices and systems. This measurement however, only quantifies the magni-tude of the nonlinear spectral products and cannot provide any information on the phase of the nonlinear response. Even though the two-tone measurement technique is conceptually simple, there are multiple pitfalls that must be avoided or managed when making these measurements and these difficulties vary with power and frequency of the stimulus used.
Synth #1
Power
Combiner
Synth #2
DUT
Spectrum
Analyzer
Figure 2.9: Basic two-tone measurement apparatus.
sums the signals for injection into the DUT and a spectrum analyzer is used to measure the DUT output power spectrum. In considering the potential sources of measurement corruption, the underlying theme is that nonlinear effects are numerous in origin and can occur anywhere within the device and the measurement apparatus [46].
Of almost equal importance to making good measurements is the receiver dynamic range. The front-end of the spectrum analyzer can also exhibit nonlinear behavior when exposed to large input signals. When conducting two-tone testing with high-levels of stim-ulus at the DUT output, the nonlinear operation of the spectrum analyzer receiver can contribute spectral products at the same frequency as the DUT. In the case of weakly non-linear devices, this is of particular concern since simply attenuating the stimulus tones prior to the spectrum analyzer will also attenuate any weak nonlinear response thus limiting the ability to detect these signals. Since the nonlinear distortion products of interest are close in frequency to the stimulus tones, filtering cannot be used as this would also attenuate the nonlinear products as well.
One scenario which requires careful attention to dynamic range is that of measuring Passive InterModulation, (PIM). The study of PIM has been ongoing since its discovery in 1947 in terrestrial antennas, and in satellite communications antennas in the 1970’s [48–51, 57]. Since then the phenomena has been observed on naval ships (the “rusty bolt” effect) [53], cellular base station tower components [54–56], and more recently mobile radio antennas, [59] and PCB traces [60,61]. A general description of the cause of PIM stems from the breakdown of the linear behavior of passive components such as cables, attenuators, and combiners usually at high input powers (∼50 W). Since these components are only weakly nonlinear, the high-power stimulus elicits only a very small nonlinear response so detection of this response requires considerable dynamic range, in excess of 120 dB. The physical cause of PIM is hard to characterize due to the difficulty in measuring the behavior directly and in the wide and varied range of material properties that can cause PIM. The most readily explainable sources of PIM are hysteresis effects in ferrous materials and dissimilar metal contacts, both well-known to exhibit nonlinear I-V responses. In addition many other processes can contribute to PIM such as: poor contacts at mating surfaces, thermal effects from point contacts, vibration, tunnelling in thin dielectric films, and dielectric breakdown to name a few, see [62, 63]. About the best that can be done to mitigate or manage the generation of PIM results from good manufacturing practices in component design including using multi-layer plating of connectors with non-ferrous materials and using high-purity electro-plating and current path metals to eliminate dissimilar metal effects resulting from impurities [63].
both within the DUT and the measurement system and can result from thermal effects, transmission and reflection signal paths, and signal coupling from antennas or signal traces. Since these sources will add vectorially with desired products, great care must be taken to ensure that these sources do not distort the desired measurement.
Nonlinear Vector Network Analyzer
A relatively new instrument for characterizing the nonlinear properties of active microwave devices is the Nonlinear Vector Network Analyzer (NVNA). This instrument has undergone several implementations since its introduction in 1992 by Van den Broeck and Verspecht [68–79]. The current version of this system digitizes downconverted frequency bands around the fundamental and its harmonics with an 8 MHz bandwidth. Unlike the traditional two-tone measurement system, this instrument can measure the phase of the resulting nonlinear response after extensive calibration to determine the phase of discrete frequency responses in the instrument. Until recently however, this system only measured the phase of the harmonics produced by a nonlinear DUT, but has been used in [79] to measure the phase of intermodulation products in two-tone excitation experiments. The primary limitation of using this instrument is its high cost, much more than that of a traditional network analyzer.
2.5.3 Communications-Based Metrics
compliant. ACPR testing provides a functional test for spectral-regrowth limited radios, i.e. where spectral regrowth limits the performance of the radio network. Performance limitations arise from the corruption of adjacent transmit channels by the output of other transmitters. Another measure of the distortion within a system is based on the devia-tion of the constelladevia-tion points in the I/Q domain. EVM measures the average magnitude deviation of the system’s constellation points with respect to the ideal constellation point locations, essentially quantifying the modulation quality in the presence of nonlinear distor-tion. Additional tests including BER and functional tests are used to quantify the device performance at a system level. While it is difficult to explicitly link distortion mechanisms to the system level metrics, these measurements allow designers to evaluate performance under realistic conditions and thus provide a useful tool for analysis.
2.6
Summary
Chapter 3
Nonlinear Metrology
The work presented here focuses on providing modeling strategies and techniques for experimental characterization of RF and microwave circuits and systems. Thus, non-linear measurement techniques and instrumentation usage plays a crucial role. In Section 3.1, a critical review of the measurement apparatus necessary for the “routine” two-tone characterization of intermodulation magnitude is presented. This review outlines the po-tential pitfalls of this measurement and the additional considerations for performing the measurement at high power levels (>1 W). Extension of the wired two-tone test is outlined in Section 3.2 that covers the modifications introduced when performing a two-tone test in a non-contact or wireless manner. The wireless characterization approach exploits the nonlinear reflection phenomena (defined in Section 3.2.1) found in electronic devices.
Synth #1
Power
Combiner
Synth #2
DUT
Spectrum
Analyzer
Figure 3.1: Basic configuration for two-tone measurement apparatus employing independent signal sources.
3.1
Review of Two-Tone Measurements
The traditional two-tone measurement of nonlinear behavior is well-known, widely performed, and presents multiple subtle pitfalls. A simplified block diagram of the instru-ments and components used in this measurement are shown in Fig. 3.1. In the following, the components that make up the measurement apparatus are reviewed and potential issues leading to nonlinear distortion generated by the components themselves are discussed. The mitigation of the system generated IM is particularly challenging when the measurement is performed at high power over a wide (greater than one octave) frequency range, therefore good measurement practices for these measurement conditions are also discussed.
3.1.1 Stimulus Sources
arises from one sinusoidal tone presented to the input of a nonlinear device and a tone of different frequency presented at the output. The resulting interaction in the nonlinear com-ponent generates intermodulation products similar to two-tones at the input of the device, in the case of source isolation, the nonlinear component is the output stage of the signal generator. As in an uncalibrated VNA, the effect of poor isolation can be seen in swept frequency measurements of intermodulation product power as ripple in the magnitude as the system IM and DUT IM combine alternately in-phase and out-of-phase. The use of isolators, attenuators, and high-isolation power combiners allows this source of IM products to be minimized.
While it may seem preferable to use a single modulated generator to produce the multi-tone stimulus, the linearity of the modulator in sources with this capability limits the use of these sources to tests of devices with pronounced nonlinearities. In current signal generators of this type, the two-tone InterModulation Ratio (IMR), (defined as the power ratio in dB of the desired sinusoidal signals to the IM products at that power level, has a maximum value of ∼75 dBc [67] which is insufficient for weak nonlinear measurements where the DUT IMR can be greater than 100 dBc at the maximum output power of the source (typically less than 20 dBm). Another issue with multi-tone signals from a single source is that laboratory synthesizers cannot generate high output power levels. Any am-plification required must use an amplifier with high linearity or employ a large backoff to limit the amount of IM generated by the amplifier.
3.1.2 Stimuli Combination Devices
Devices for summing the stimulus signals from multiple signal sources include power combiners. Power combiners used for two-tone tests are overlooked as a limiting factor in the performance of a two-tone measurement system. Proper combiner architecture and termination are essential to minimizing the nonlinear response of this component. Both the Wilkinson combiner architecture and the coupled-line hybrid combiner will be considered here.
seen at each port so long as each port is terminated with equal characteristic impedances. Because matching is achieved at all ports, this device is lossy and dissipates half of the input power of each of the combined tones in the internal resistor that terminates the fourth port. Analysis of the Wilkinson architecture proceeds by assuming the device acts as a combiner and that the input signals are at the same frequency [80]. In the analysis, the current that flows through the resistor between the two output branches is constant, and depends on the phase difference between the two input signals. Thus in this scenario, the combiner operates at steady-state with respect to the current through the internal termination resistor. When the two input signals are not of the same frequency however, the current through the termination resistor varies with the envelope of the combined signal. At high powers, this variation in current flow causes thermal memory effects that result in nonlinear distortion at the combiner output. In addition to this nonlinear process, the Wilkinson has limited isolation between the two input ports when used as a combiner. This requires the use of more components to properly isolate the stimulus sources.
3.1.3 Isolators
Methods to improve the isolation between independent signal sources in a two-tone setup include using attenuators or isolators between the sources and the power combiner. The use of attenuators decreases the available power that can be supplied to the DUT so it is preferable to employ non-reciprocal isolators instead. The use of isolators must be regarded with caution as the very nature of the ferrite materials used in their construction exhibits nonlinear behavior. The nonlinearity arises from the magnetic hysteresis in the ferrite material that means that the electromagnetic fields in the device are a function of the history of the fields and the magnitude of the fields thereby violating a condition for linear operation. Because of this nonlinear behavior, ferrite isolators (or circulators configured as isolators) should never be used in a circuit path within the measurement system where both stimulus tones are present. These devices will contribute large levels of IM products and can easily overwhelm the response of even a strongly nonlinear active component. Isolators also have a strong nonlinear reflection similar to the reverse intermodulation performance of the signal generators. Thus it is imperative that when using isolators at the output of the generators, a high-isolation combiner must be employed to limit the exposure of the isolator output port to both stimulus tones in the DUT.
The impedance matching of the ferrite materials (within isolators) to that of a 50 Ω system impedance is quite difficult and limits the frequency range of isolators to an octave or less [104]. This constrains the ability to build a broadband measurement setup considerably. A benefit of this narrow passband comes from the elimination of bandpass filters to attenuate harmonics of the stimulus signal produced by the sources. Harmonics of each source can interact with even-order nonlinear processes and the fundamental of the other tone to produce odd-ordered distortion products that occur at the expected IM frequencies of odd-order distortion arising from the interaction of the two fundamental stimulus tones.
3.1.4 Stimulus Amplification
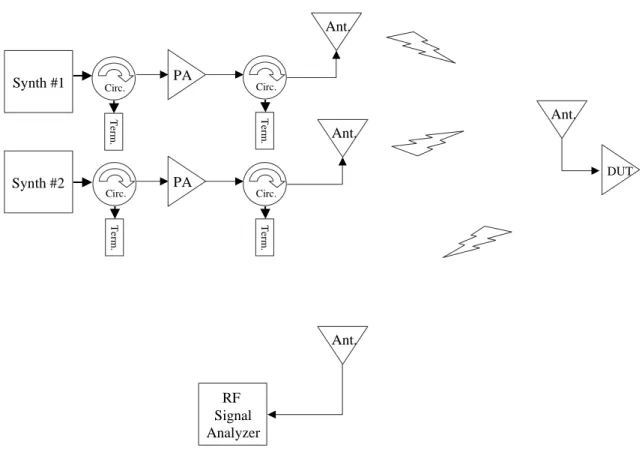
Synth #1 Power Combiner Synth #2 Circ. T e rm . PA PA Circ. T e rm . Circ. T e rm . Circ. T e rm . DUT
Figure 3.2: High power two-tone measurement system with independent stimulus paths.
that produce less than +20 dBm (100 mW) of output power. Amplifiers are also inher-ently nonlinear thus producing IM products when exposed to a two-tone input signal. For example, an Amplifier Research 10W1000C instrumentation grade, linear amplifier has an output third-order intercept (OIP3) specification of +50 dBm [105]. This means that if the amplifier is producing 10 W of power in each tone of a two-tone signal, the resulting IM products will only be 30 dB lower than the primary output (−30 dBc). This represents a large level of IM generation that would easily overwhelm the response of a weak nonlinearity under test. An example of a weak nonlinearity testing is that of PIM measurements where the IM products can be as low as −140 dBc at stimulus powers of 20 W for each tone. In terms of absolute power, this dBc ratio for the 20 W tone power (+43 dBm) would result in the power of the IM products being −97 dBm. Clearly the use of a single amplifier to increase the signal generator power would not be suitable for this type of measurement. Separate amplifiers in the stimulus signal paths as in Fig. 3.2 should be employed when greater DUT input powers are required. Again isolators need to be employed to limit reverse intermodulation at the output of the amplifiers.
3.1.5 Passive Intermodulation
![Figure 2.3: AM-AM, AM-PM model representation with the amplitude and phase modu- modu-lation components considered separately (after [30]).](https://thumb-us.123doks.com/thumbv2/123dok_us/1243882.1157026/34.892.160.808.163.349/figure-model-representation-amplitude-lation-components-considered-separately.webp)

![Figure 2.6: PA model for a system with memory using a memory polynomial model with unit delay taps (after [9]).](https://thumb-us.123doks.com/thumbv2/123dok_us/1243882.1157026/39.892.167.801.146.469/figure-model-memory-using-memory-polynomial-model-delay.webp)