UNIVERSITY OF TARTU
FACULTY OF MATHEMATICS AND COMPUTER SCIENCE
Institute of Computer Science
Computer Science Curriculum
Tõnis Tasa
Re-using public RNA-Seq data
Master’s Thesis (30 EAP)
Supervisor: Priit Adler, MSc
Re-using public RNA-Seq data
Abstract:
Next Generation Sequencing (NGS) methods are rapidly becoming the most popular paradigm for exploring genomic data. RNA-Seq is a NGS method that enables gene expression analyses. Raw sequencing data generated by researchers is actively submitted to public databases as part of the requirements for publishing in academic journals. Raw sequencing data is quite large in size and analysis of each experiment is time consum-ing. Therefore published raw files are currently not re-used much. Repetitive analysis of uploaded data is also complicated by negligent experiment set-up write-ups and lack of clear standards for the analysis process. Publicly available analysis results have been obtained using a varying set of tools and parameters. There are biases introduced by al-gorithmic differences of tools which greatly decreases the comparability of results between experiments. This is due because of lack of golden analysis standards.
Comprehensive collections of expression data have to account for computational ex-penses and time limits. Therefore collection set-up needs an effective pipeline imple-mentation with automatic parameter estimation, a defined subset of tools and a robust handling mechanism to ensure minimal required user input. Aggregating expression data from individual experiments with varying experimental conditions creates many new op-portunities for data aggregation and mining. Pattern discovery over larger collections generalises local tendencies. One such analysis sub-field is assessing gene co-expression over a broader set of experiments.
In this thesis, we have designed and implemented a framework for performing large scale analysis of publicly available RNA-Seq experiments. No separate configuration file for analysis is required, instead a pre-built database is employed. User intervention is minimal and the process is self-guiding. All parameters within the analysis process are determined automatically. This enables unsupervised sequential analysis of numerous experiments. Analysed datasets can be used as an input for co-expression analysis tool
MEM which was developed by BIIT research group and was originally designed for public microarray data. RNA-Seq data adds a new application field for the tool. Other than co-expression analysis withMEM, the data can also be used in other downstream analysis applications.
Keywords:
Avalike RNA-Seq andmete taaskasutamine
Lühikokkuvõte:
"Järgmise põlvkonna sekveneerimismeetodid"(NGS) on geeniandmete analüüsil kii-resti populaarsust kogumas. RNA-Seq on NGS tehnika, mis võimaldab geeniekspressioo-ni tasemete hindamist. Eksperimentidest kogutuid andmeid arhiveeritakse jõudsalt ava-likesse andmebaasidesse, kuna toorandmete neisse edastamine on üheks eeltingimuseks akadeemilistes ajakirjades avaldamiseks. RNA-Seq toorandmed on mahult üsna suured ja üksikute eksperimentide analüüs üsnagi aeganõudev. Sekveneerimise toorandmeid taas-kasutatakse praegu veel üsna vähe. Andmebaasidesse leiduvate andmete taaskasutamisele avaldavad pärssivat mõju ebatäpsed katseplaneerimise kirjeldused ja kindlate standardite puudumine analüüsimeetodites. Tööriistade vahelised algoritmilised eripärad tähendavad erinevatel meetoditel teostatud analüüside vähest võrreldavust. Lihtne kollektsioonide agregeerimine ei tööta, kuna analüüsitud andmed pole võrreldavad. Seega tuleb analüüs kõikide eksperimentide jaoks teostada alates toorandmetest. Iga eksperimendi analüüs on aga üsna aeganõudev ning nõuab kuldsete standardite puudumisel konkreetseid valikuid. Suuremahuliste analüüsiandmete kollektsiooni nõuab seega efektiivset töövoo imple-mentatsiooni. Toimimise tingimusteks on minimaalne inimsekkumine, fikseeritud tööriis-tade valik ja robustne eksperimentide käsitsemismetoodika. Väga erinevates tingimustes teostatud eksperimentide ekspressiooniandmete agregeerimine loob võimaluse andmekae-ve meetodite rakendamiseks. Lokaalselt ilmnevad mustrid võivad taustsüsteemis osutuda signaaliks. Üheks analüüsivallaks, mis selliseid mustreid uurib on koekspressioonianalüüs. Selles magistritöös arendasime ja implementeerisime raamistiku suuremahuliseks ava-like RNA-Seq andmete analüüsiks. Analüüs ei vaja eksperimentide analüüsimisele eelne-valt konfiguratsioonifaili vaid toetub ühekordselt konstrueeritud andmebaasile. Kasutaja poolne sekkumine on minimaalne, kõik parameetrid määratakse andmetest lähtuvalt. See võimaldab järjestikulist analüüsi üle arvukate eksperimentide. Loodavat RNA-Seq ekspressiooniandmete kollektsiooni kasutatakse sisendina BIIT töörühma poolt arenda-tud koekspressiooni uurimise tööriistas - MEM. Algselt oli see ehitatud üksnes mikro-kiip andmetelt sondide koekspressiooni hindamiseks, kuid RNA-Seq ekspressiooniandmed laiendavad selle rakendusampluaad.
Võtmesõnad:
Contents
Introduction 5
1 Framework 7
1.1 Overview . . . 7
1.1.1 Overview of sequencing methods . . . 7
1.1.2 Overview of RNA-Seq . . . 8
1.1.3 Gene expression analysis . . . 9
1.2 Workflow of RNA-Seq data analysis . . . 9
1.2.1 Quality control . . . 10
1.2.2 Alignment using STAR . . . 13
1.2.3 Quantification usingHTSeq . . . 15
1.3 Public RNA-Seq data . . . 19
1.3.1 Available RNA-Seq experiments(05.2015) . . . 21
1.4 MEM . . . 22
1.5 ExpressView data representation format . . . 23
2 RNA-Seq pipeline solutions 24 3 Automatic library type inferral 26 3.1 Methods . . . 27
3.1.1 Alignment fit to transcriptome . . . 28
3.1.2 Multiple quantification inferral . . . 28
3.1.3 Protocol classifier . . . 29
3.2 Results . . . 29
3.2.1 Transcriptome and alignment correspondence (RSeQC) . . . 29
3.2.2 Classification of raw count quantification results . . . 30
3.2.3 Protocol classifier . . . 31
4 Pipeline 32 4.1 Database development . . . 32
4.2 Design decisions . . . 35
4.3 Runtime analysis . . . 42
4.3.1 Analysis time simulation study . . . 47
4.4 Data integration withinMEM . . . 49
5 Conclusion 51
Introduction
DNA/RNA sequencing determines the ordering of the base level subunits of these or-ganic molecules. Next Generation Sequencing (NGS) platforms perform these operations using massively parallel techniques. RNA-Seq is a NGS technique that profiles the tran-scriptome. Applications of RNA-Seq data analysis contain gene expression studies, phe-notyping, splice- and variant detection. A lot of RNA-Seq data is uploaded to public repositories such as ArrayExpress because of requirements to publishing the results in academic journals [1]. The amount of experiments conducted is continuously growing due to decrease in cost, accessibility and development of analysis techniques. However, data re-usage is still difficult because of computational requirements for processing and ambiguities in experimental set-up descriptions. This means under-usage of information [2].
This master’s thesis gives an overview of the RNA-Seq with special emphasis on data analysis. RNA-Seq data processing work-flow consists of independent discrete steps. Ac-curate processing of the data requires preliminary information about this and of its library preparation methods. Misinterpretations of analysis are expressed in skewed results.
Difficulties are exacerbated in case of processing multiple experiments. Large scale data processing can only be effective when handled automatically via a pipeline due to costs of active human input. Extensive collections of RNA-Seq data are still infrequent with notable exceptions such as ExpressionAtlas [3]. An efficient pipeline combines tools that integrate well with each other by compatible formats and is optimised for perfor-mance and quality. The overview section of this thesis gives special consideration to all data analysis processes and individual tools selected for the work-flow. We also intend to describe other existing pipeline solutions and highlight opportunities and complexities in making public RNA-Seq data more usable.
The practical aim of the thesis is an implementation of a pipeline that automatically processes and handles publicly available RNA-Seq experiments. Tool selection looks for balance between speed and performance quality [4]. Final analysis output is a NetCDF formatted expression matrix combined with metadata from the experiment. Management of analysis is handled through a pre-constructed database that guides the operations. Collections are separated by species. Experiments are analysed in order of increasing raw data file sizes for each such collection. The design of the database containing experimental data and the data processing pipeline are also described in detail.
A separate section in the thesis is dedicated on evaluating automatic library type selection methods. This is an important parameter in quantification step that can not be directly inferred from metadata nor from data that is generated in analysis steps preceding
its usage. We also perform a runtime analysis and profile the implemented pipeline’s actual performance based on collected logs. Also, a simulation study for predicting the future performance of the pipeline is conducted.
Final expression matrices are used within an existing framework initially developed for microarray data - MEM. It is a multi-experiment co-expression discovery tool that was developed by BIIT group in University of Tartu [5]. The aim is to use expression data from different experimental conditions to investigate and quantify co-expression on a gene level.
The pipeline was implemented inPython programming language integrating a number of special purpose bioinformatics tools. The flow charts were designed using an online chart maker Draw.io [6]. All other visualizations and underlying simulations were per-formed using R software [7].
1
Framework
1.1
Overview
1.1.1 Overview of sequencing methods
DNA/RNA sequencing is the process of ordering the atomic subunits of named organic molecules. First major development in the field was the introduction of Sanger sequencing method in the mid-seventies. It is an early-generation DNA sequencing method that uses DNA polymerase enzyme for forming new copies of DNA. DNA is double-stranded, so a complementary strand is synthesized based on a given one using special enzymes. For two and a half decades the algorithm was the most popular method of sequencing and culminated in laying out the structure of full human genome by 2003. Sequencing was performed one base at a time at a very slow rate. This method is still employed for sequencing either very short regions or genomic regions containing many repeated sub-sequences. Such scenarios are still not well handled by automatic and parallelised algorithms.
Subsections of DNA/RNA molecules are known as genomic fragments. A sequenced fragment is called a read. Next Generation Sequencing (NGS) methods perform massively parallel sequencing of millions of fragments which are combined in collections grouped by biological samples. This approach is also known as high-throughput sequencing. NGS technologies can be used for outputs from a variety of sample preparation methods. Sample or library preparation methodologies are selected by genetic material extraction preferences. Material of interest can be RNA, DNA, specific DNA or RNA regions bound by proteins or alike. Therefore sample preparation determines which genomic property is characterised by sequencing.
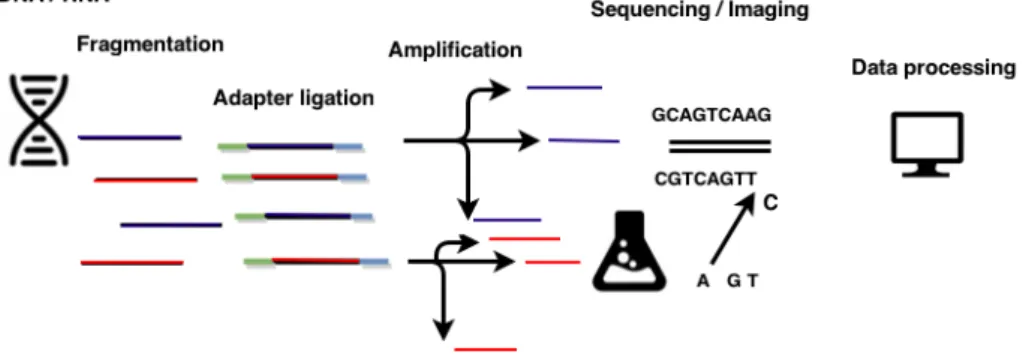
Figure 1: General workflow of NGS experiments
Next Generation Sequencing methodology can be divided into template preparation, imaging, sequencing and data processing as shown in figure 1 [8]. General workflows of
NGS technologies differ by algorithms that are employed by platform providers. Addi-tionally processing methods for outputted sequenced reads were developed for analysing and biologically interpreting obtained large-scale data. Genetic material extraction is performed in template preparation phase. Adapters are synthesized sequences linking the ends of two subsections of genomic molecules. These are connected on both ends of each fragmented sequence. Polymerase chain reaction (PCR) is a widespread technology for amplifying the fragments [9]. These are brought together with a pool of various bases which form a second strand based on complementarity between strands. In imaging, light signalling fluorescent events are recorded from these connecting events. Since single lighting events can not be detected then the fragments need to be amplified. Detected events are digitally recorded as a sequence. A good detailed overview of specific platforms is given by Metzker [10].
1.1.2 Overview of RNA-Seq
Transcriptome is a collection of all different RNA molecules known as transcripts. RNA-Seq uses high-throughput sequencing for quantifying the levels of transcript expression in a tissue at a given time. Main part of this thesis investigates the data analysis process of such sequenced data.
Based on different transcripts RNA-Seq can additionally be divided to mRNA-Seq, small RNA-Seq and Total RNA-Seq . mRNA-Seq profiles coding and non-coding scripts characterised by messenger RNA. Total RNA-Seq does the same for all RNA tran-scripts - mostly rRNA, tRNA and mRNA by proportional abundances. Small RNA-Seq transcript types such as piRNA and miRNA have regulatory purpose and are non-coding. Therefore gene level expression can not be investigated using small RNA-Seq [2].
RNA is originally synthesised from DNA by transcription. It is very unstable and degrades easily. Therefore library preparation for RNA-Seq needs transcripts reverse transcribed to complementary DNA (cDNA). After isolation of RNA, primer sequences from which synthesis begins are hybridized onto RNA templates. Reverse transcriptase enzyme is added which starts the synthesis of the first cDNA strand. The strand of the DNA on which a coding sequence is located is called a sense strand. Therefore the newly synthesised strand of cDNA is complementary to the sense strand and matches the template strand of the original DNA sequence. Before second strand synthesis the RNA transcript is degraded which allows second strand synthesis.
Genes consist of coding areas known as exons and non-coding areas known as introns. RNA transcription excludes intronic areas of genes from its product. Exon usage is variable as well so transcripts from the same gene may appear in a range of different isoforms. RNA-Seq is increasingly popular for performing gene expression analyses.
1.1.3 Gene expression analysis
Gene expression analysis investigates in what capacity are expressed the genomic regions annotated as genes. Measured or computed levels expressed in numeric values are mostly directly comparable only against other quantified values within an experiment and have no direct interpretation outside that context. Gene expression is exhibited as a complex aggregate of the functional and regulatory performance but also in other traits of a specimen. Expression can also be quantified in terms of other annotation groupings besides genes such as transcripts, exons or alike.
DNA microarrays are an older technique for assessing gene expression in standardized experimental conditions. Notably they are constrained by only quantifying the expression levels of probes that are included on a specific microarray. This means no novel region discovery in untested tissues or conditions is possible. It is only able to quantify expression for the genomic sequence that attracts another sequence complementary to itself that it is designed for. This sequence is also known as a hybridization target. In microarrays this target does not allow mismatches or any other alternative forms of the same target sequence.
Other older technologies such as quantitative real-time PCR and northern blotting are very slow and restricted to analysing only a single selected genomic region at a time. Sequencing based expression analysis approaches are increasingly popular but aforemen-tioned technologies still retain a wide user base [11]. In sequencing based applications, more extracted genomic material is positively correlated with the average number of times any base is sequenced. This number is called the sequencing depth. More depth offers added sensitivity for detecting varying expression levels. For many applications such as differential analysis, the gene expression analysis is only a preliminary step. It is an important stepping stone into many other fields which use expression data such as gene fusion detection, homology analysis, transcript and variant detection/calling amongst others. Hypotheses can be constructed on the fly based on analysis results in preceding steps which have prompted its growth into fast developing field of active research [12].
1.2
Workflow of RNA-Seq data analysis
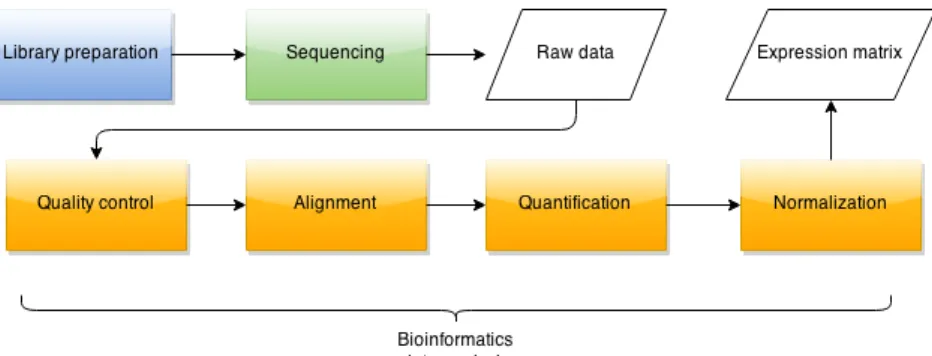
The analysis of RNA-Seq data concludes with output of formatted expression matrix. Figure 2 shows the proceedings of an individual RNA-Seq experiment with elements of data analysis highlighted. Library preparation and sequencing are performed in a labo-ratory setting whereas quality control of the raw reads, genome alignment, quantification and normalization are all part of the data analysis process. Tools for these steps can in most cases be chosen independently from one another depending on the characteristics
of data and aims of the analysis [13].
Raw reads prepared in the laboratory are filtered and trimmed as needed. Prepro-cessed raw reads are then aligned on a reference sequence. Next, quantification is per-formed for estimating levels of aligned reads falling in genomic regions specified on the level of genes, transcripts, exons or alike. Raw expression levels are then normalized for comparability between samples. Next, expression data can used for any other downstream analysis processes. These steps of RNA-Seq data analysis are detailed in the following subsections.
Figure 2: General workflow of RNA-Seq
1.2.1 Quality control
Quality control of RNA-Seq reads is the process of checking for biases that have been induced to reads by library preparation and sequencing. Correction methods aim to im-prove the quality levels of the following analysis outcome. Common problems emerge in forms of low confidence sequencing quality, over-represented sequences, positional biases, PCR artefacts or unremoved ligation adapters. Many software packages have been de-veloped to identify and quantify these problems. Even though some elements can not be directly corrected, biases can nevertheless be accounted for in the interpretation of final analysis results.
FastQC and RSeQC are packages in popular and widespread use for general qual-ity control assessment [14, 15]. Raw reads are often processed using Trimmomatic or
Cutadapt [16, 17].
Successful sequencing process outputs FASTQ files containing millions of individual raw reads. These Reads can either be single or paired end. Paired end reads contain two mates from relative genomic proximity and because of this internal check mechanism, these are considered less prone to misalignments.
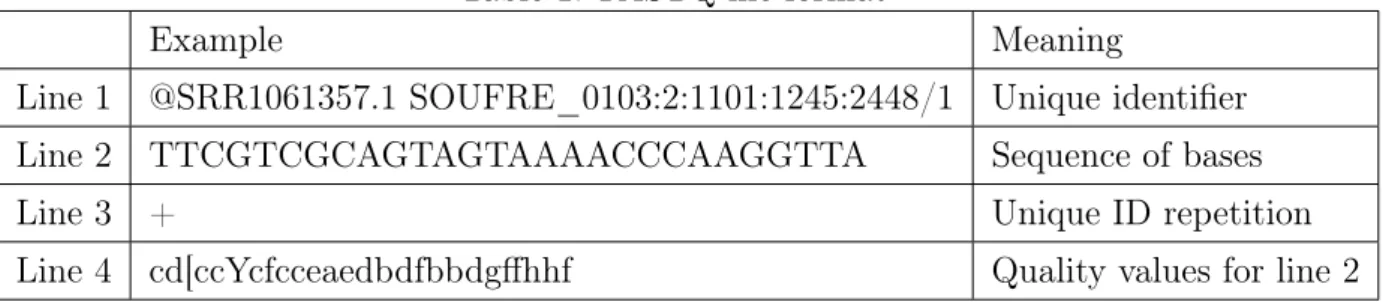
FASTQ format is human readable. Each read is described on four lines as shown in table 1.
Table 1: FASTQ file format
Example Meaning
Line 1 @SRR1061357.1 SOUFRE_0103:2:1101:1245:2448/1 Unique identifier Line 2 TTCGTCGCAGTAGTAAAACCCAAGGTTA Sequence of bases
Line 3 + Unique ID repetition
Line 4 cd[ccYcfcceaedbdfbbdgffhhf Quality values for line 2
information about the sequencing process’ characteristics which ensures uniqueness of reads. The second line contains actual nucleotide sequences and the last line gives a qualitative representation for the original sequence. Probability of correct nucleotide assignment is assigned on each base. Quality value interpretations vary depending on the used encodings. Numerical value of quality is retrieved by subtracting offset 33 or 66 from the ASCII value of the character. These values are calculated from probabilities of incorrect assignment using the Phred scale [18].
Q=−10 log10P,
where P is the probability of incorrectly calling the base and Q is the quality value for a position of a read.
Trimming reads by quality and discarding those smaller than minimum length is most effective for reducing sequencing failures and directly improves alignment rates. Reads in sequencing are laid out in directional manner. Both forward and reverse strand sequences are represented directionally. The leftmost part of the reads is called 5’ and rightmost 3’ end. On most sequencing platforms it is common to see lower quality values towards the 3’ end of the read. Checking mean quality values by every position over all reads implies general quality of sequencing process. If uniform read sizes are required then these values may guide decision making from which position all reads should be cut.
Popular strategies for trimming include sizing the read to a fixed length or cutting a proportion of all bases in a read or bases with quality lower than an arbitrary cut-off level from either ends. Quality value checking towards the 3’ end of the read identifies the first value below the threshold and cuts bases towards 5’ from the identified base. In reverse direction the strategy is more lenient. Approaching from 3’ end the first quality value exceeding the threshold is set as the boundary and everything back towards 3’ direction is cut. A sliding window approach extends this method of identifying arbitrary thresholds over mean values within a range of qualities. This increases insensitivity to sharp local variations.
A different approach used by Cutadapt tool uses cumulative summing of differences with a given threshold. Trimming is performed downstream from the worst position.
Thresholds for both minimal and maximal read length are often set and inappropriate reads are discarded from the sample. This requires careful controlling for paired-end reads. Removing one end of a pair brings about the other’s removal.
Longer reads are less susceptible to being aligned on multiple locations. Also they are better in detecting exon-intron boundaries or splices. Small reads may align to multiple locations on the genome by chance. This motivates filtering for too small reads and for sequences of low-complexity mainly from repetitive regions containing only one to three nucleotides. Generally, low complexity reads are less likely to be uniquely mapped because of originating from regions of low mappability.
Deviations in some quality measures are often difficult to control for even if the bias is clearly identified. Over-representation of bases C and G or any other low complexity sequences regularly means contamination by foreign sequences. Over-representation of longer sequences can derive from clonal over-amplification or from library preparation kits in the form of adapters. However, unless over-represented sequences are clearly identified by contaminant source or adapters, reads should not be directly filtered based on this property. Expression profiling depends on the quantification of transcript levels and directly removing over-represented sequences may flatten true expression signal. It is also very common to have uneven nucleotide content on the first 12 bases over all reads because of non random primer positioning in commonly used Illumina library prep kits [19].
Removing reads that are duplicated more than a 100 times is a common technique to identify PCR amplification artefacts which are expressed as extreme deviations from the Poisson distributed alignment profile. Any duplication removal is prone to errors be-cause of inaccuracies induced by upstream sequencing errors and SNP variations slightly modifying the alignment.
Unremoved adapters lower alignment precision. Used ligation adapters vary greatly between technologies and between their versions. Therefore comprehensive lists for au-tomatic adapter checking are difficult to construct. This phenomenon is emphasized for publicly available data. Information about types of adapters is not directly accessible nor it is known whether these have been removed before data had been upload. Providers of data such as Illumina only provide information about adapters on request. This causes difficulties even if it is known that adapters do exist. In addition, like other sequences adapters suffer from sequencing errors and mismatches which complicates their removal. Identification of whole adapters is easier than partial adapters. Therefore their re-moval has to precede other trimming operations. Rere-moval is facilitated by many tools. Ad-hoc approach looks for matches between over-represented sequences and adapters based on a list of known sequences used as adapters. This feature is provided by some
quality control packages such as FastQC. These however do not say anything about their positions relative to the actual read which complicates choosing appropriate trimming strategy.
Quality requirements and cut-off levels for the reads are dependent both on the down-stream analysis application and of the characteristics of analysed data. Comprehensive analyses on optimal thresholds are largely missing from literature. Sensitivities to quality variation are specific to used tools which affects approaches to data processing. Generally, a very aggressive trimming policy may yield high alignment percentages with the cost of fewer total available reads and coverage. However, no trimming at all causes low quality reads to be unsuccessfully aligned but no information is inadvertently removed.
Practical standards for quality control in RNA-Seq are also largely missing. Quality control assessment tools offer a wide range of measures for quantifying certain parameters based on raw reads but solid references for consequential action are largely missing. This is in part because the field has only started to develop recently and lacks universal cases [20].
1.2.2 Alignment using STAR
Genomic alignment is the process of locating short length nucleotide sequences on species specific genomes. The most common approach matches sequences or reads to an existing reference sequence using some scalable algorithmic technique. In case of a missing refer-ence, it is first constructed from individual reads in a de novo manner. Reads are then located on this new de novo reference. Large alignment data requires compact storage formats. Many have been developed for storing sequences and their qualitative properties. BAM format is the most popular. Human readable format of this is SAM. Properties of alignment formats have been discussed in the author’s bioinformatics research seminar paper linked in appendix 1.
Raw RNA-Seq samples consist of millions 50-100 base long reads. Reference genomes are much longer. Human genome is about 3.5 billion bases and also includes a high number of repeated regions.
Reference genome is built using an aggregated consensus of many ordered sequences. Perfect reference construction however is not feasible. Sequencing errors, single nucleotide polymorphisms (SNPs) and indels all play a role in variability in full genomes. Even though a large proportion of the whole genome is universally shared, local biological vari-ation between individuals is a considerable factor for low mappability of reads. Therefore some naturally occurring misalignment between a read and a reference is anticipated.
The ultimate aim of an alignment tool is to uniquely align and map sequences from non-contiguous regions. Researchers have developed a large number of different alignment
tools. All aim to increase the speed and precision of alignment. Advances are made in indexing schemes for the reference annotation and heuristic approaches for finding the matching regions.
DNA sequences do not contain splices. A major difference between aligners is the ability to detect splicings or exon-intron junctions. However, transcribed RNA sequences do not contain introns and some exons may have been skipped in transcription. This phenomena is known as alternative splicing. A read may consist of multiple separated exons. so aligners suitable for RNA-Seq need to be able to detect exon-intron junctions. That is a much more difficult problem to solve automatically, emphasized by very long spanning intronic areas [21].
Aligners have been subjected to comprehensive comparative studies. There is great variation in speed, resource requirements and accuracy of results [22]. Many aligners with low user numbers are not actively maintained after publication in academic journals. Algorithmic properties running the alignment process cause great variation in tool-specific parametrization requirements. Therefore parameters are often contextually linked to tools and not based on inherent alignment problem characteristics. Practical application of this thesis uses STAR aligner by default. Its speed and high accuracy of dealing with spliced data offers a good balance. TopHat aligner is implemented as a secondary aligner [23, 24]. The alignment algorithm of STAR consists of two discrete steps. A Maximal Map-pable Prefix (MMP) corresponds to the longest sequence in read (Ri, RM M L−1) where
M M L is the maximal mappable length and R is the read aligned. Reference genome for alignment is deconstructed into suffix arrays which are indexed. Binary search on in-dexed suffix arrays identifies the MMP location which can also be multiply aligned. It is assumed that reads can be aligned contiguously. Unmapped fragment of the read is then matched for another MMP. A single read can therefore be constructed in multiple non-overlapping sequences. Binary search in suffix arrays naturally retrieves MMPs. There is no computational add-ons which makes STAR very fast. This search is performed on both forward and reverse strands.
Mismatches are handled by gaps between local MMPs. These are handled naturally when MMP matches from different reads are nested together as a whole. MMP con-struction in aforementioned manner does not require a pre-specified junction database. Minimal intron length specification distinguishes between regions labelled introns and indels. Gaps longer than specified size are considered as introns whereas smaller gaps are labelled as mismatches. MMP alignment has no regard to biological accuracy of underly-ing annotation. This is advantageous for beunderly-ing able to discover multiple alignments with little overhead.
Seeds are first selected by their relative distance to each-other. It is known that reads can not overlap and are ordered sequentially. Each linked group of MMPs allows a single indel per pair of sequences and some number of mismatches. Paired end reads are handled naturally. Inner regions between mates can contain splices.
Combined MMPs are validated with a scoring scheme. The highest scoring com-bination is selected as the final alignment. The score is a comcom-bination of scores from mismatches, insertions, deletions, gaps and matches. STAR gives high quality results very fast and with few assumptions such as known splices [25].
1.2.3 Quantification using HTSeq
Locations of genes and transcripts generally do not vary over individuals of same species. Pre-existing transcriptome is grouped by genes, transcripts or by other annotation groups. Quantification of expression levels is generally performed within these pre-set regions, un-less existence of new transcripts or genes under some experimental condition is hypoth-esized. mRNA transcripts mostly characterise coding or non-coding genes. RNA-Seq reads are expected to produce more regions in genomic areas where expression during library preparation was higher. Therefore quantifying levels of reads found within gene level annotation regions characterises how genes are expressed. Levels of aligned reads falling in these locations can be described by some aggregative function, simplest of these is counting.
A common method for estimating expression is looking at raw counts. Estimating gene expression directly from counts is however not completely trivial. Interpretations need to be made carefully. Expression estimation on transcript level is especially ambiguous due to partially overlapping and differing exon usage. Not all regions are equally mappable because of repeated areas, sequencing- or library preparation errors or for faulty reference annotations in less described species.
Genes with multiple isoforms also may be under-represented in terms of expression. More advanced modelling based approaches of expression estimation that are more ef-fective in combining expression levels from multiple isoforms have been developed to overcome this drawback.
In the practical application of this thesis a raw count method is used because of its speed and since only gene level expressions are estimated. This significantly reduces the downsides of count based methods. Also using gene level annotations derived from specific transcriptome guarantees uniform genomic structure over all samples. This property is integral for comparability [20].
Quantification can be performed in robust conditions of reference data availability. Availability of both the reference genome and transcriptome enables identification of new
transcripts in addition to existing transcriptomic sequences. Missing genome restricts expression estimation to the domain of known annotation regions from known transcrip-tome. However, in case of no trancsriptome and genome a whole new transcriptome needs to be constructed using a de novo assembler.
HTSeq is a framework written in Python which aims to ease writing custom anal-ysis solutions for analysing high-throughput sequencing data [26]. HTSeq also includes stand-alone scripts enabling comparison of aligned reads to transcriptomic regions and outputting counts with chosen annotation level precision. Such quantification is used for expression matrix building and follow-up analyses. Therefore we only count reads that do not overlap multiple genes and are uniquely aligned. Otherwise genes in close proximity to each other may benefit from double counting. Compared to true levels this means over-expression. In worst case, differential expression analysis may be skewed in favour of such regions.
Counting in HTSeq is performed for a read if it uniquely matches any portion of an annotated gene and does not overlap any others. Construction of raw counts in union mode is given by algorithm 1,
Quantification process needs information about library type strandedness. This prop-erty specifies whether reads originate from sense, anti-sense or from both of the two strands relative to the coding strand of the initial transcribed sequence. This property is determined by kits used in laboratory sample preparation. For public data this infor-mation is not directly available. Therefore analytic methods for determining library type are required. A case study for automatic library type assessment based on raw counts is performed in section 3.
Different samples within an experiment need to be normalized for different library sizes and transcript/gene lengths. Normalized expressions have the added quality of comparable values between samples and removed technical artefacts. Further downstream analysis methods such as differential expression analysis take advantage of this property. Trimmed Mean of M-values (TMM) is a normalization method shown to perform well on raw-counts in comparison with other used expression normalization methods [27]. The main motivation of the method is biologically relevant correction for differing library sizes. A factor that is often left under-corrected is the varying proportional distribution of transcript abundances in different samples. This variability affects the differential expression outcome. Simple proportional scaling often disregards underlying biological reasons and just directly transforms data. This may drive under- or oversampling. TMM intends to correct for this phenomena.
TMM also considers the RNA population of origin for the genomic sample. Normal-ization factors are derived from log-fold changes between experimental conditions. One
Algorithm 1: Counting unique genomic IDs for aligned reads Input: aligned_reads.SAM, transcriptome file (gtf)
Output: Alignment counts by genomic IDs Initialize counts
Transcriptome ←Transcriptome.gtf
for all alignments∈ aligned_reads.SAM do if aligned_reads.SAM == paired_end then
Find all left_pair.gene_features∈ transcriptome for left_pair.alignment Initialise counter for gene_id
for all (gene_interval, gene_id) ∈ left_pair.gene_features do gene_ids ← (gene_el ∪gene_ids)
end for
Find all right_pair.gene_features ∈ transcriptome for right_pair.alignment for all (gene_interval, gene_el) ∈ right_pair.gene_features do
gene_id ← (gene_ids ∪gene_el) end for
else {aligned_reads.SAM is single_end }
Find all single_end.gene_features ∈transcriptome for single_end.alignment Initialise counter for gene_ids
for all (gene_interval, gene_id) ∈ single_end.gene_featuresdo gene_ids ← (gene_ids ∪gene_el)
end for end if
if gene_ids.size≥ 1 then counts.ambiguous+ ← 1 else if gene_ids.size==0then
counts.nofeature+←1 else
counts.gene_ids[0]+ ←1 end if
of the samples needs to be selected as a reference. For all non-reference samples this one sample is considered as reference and factor value is calculated for each [28].
Normalization factors are calculated as
fk = P g∈Gw r gkMgkr P g∈Gw r gk ,
where the ratio of log-fold change for sample k on reference r is
Mgkr = log2( Ygk Nk) log2(Ygr Nr) ,
Ygk and Ygr are two different experimental conditions with raw gene counts, Nk and
Nr are respective library sizes and wrgk are weights for gene g on sample k for reference
r. Genes g in geneset G are doubly trimmed separately for all samples. Top 30 % of gene-wise log fold changes and 5% of the extremal absolute expression levels between a library and a reference library are excluded from the calculations.
Counts are assumed to be binomially distributed in a library. Weights are calculated as an inverse of counts’ asymptotic variances. Logarithmic transformation of binomi-ally distributed variable converges to normal distribution. Such variance can be exactly evaluated using Delta method [29].
Lemma 1. Let θn be a sequence of random variables such that
√
n(θn−θ0)
D
−→N(0, σ2)
where θ0 is an asymptotic mean constant of Xn. Let f : R −→ R be a differentiable
function. Then √n(f(θn)−f(θ0))
D
−→N(0, σ2∗ ∂f(θ0)
∂θ ) .
Delta method can be applied to the binomially distributed and logarithmically trans-formed counts. Using Delta method we derive the variance of logarithm. We use the independence between proportions.
V ar(log(p1/p2)) =V ar(log(p1)−log(p2)) =V ar(log(p1))−V ar(log(p2)),
wherep1 = YNrgr and p2 =
Ykg
Nk. Yrg is a binomially distributed variable of samplek for gene
g and Nr is the library size of sample r. Variables in p2 are analogous but for sample k.
Applying the logarithm as the function f(θ) = log(θ) approximates V ar(log(p1)) to
1−p1 p1Nr through p Nr(log( Yrg Nr )−log(p1)) D −→N(0,p1(1−p1) p2 1 ),
V ar(pNr(log( Yrg Nr )) = p1(1−p1) p2 1 NrV ar(log( Yrg Nr )) = p1(1−p1) p2 1 V ar(log(Yrg Nr )) = 1−p1 p1Nr
From this result we can formulate the weights wr gk = 1−p1 p1Nr + 1−p2 p2Nk = (Ngr−Ygr)/Ngr YgrNgr/Ngr + (Ngk−Ygk)/Ngk YgkNgk/Ngk = Ngr−Ygr NgrYgr + Ngk−Ygk NgkYgk .
These sample specific normalization factors are then used to retrieve final TMM counts. Raw counts for every gene g in all samplesk are transformed as
Ykg
Nk∗fk
1.3
Public RNA-Seq data
The number of experiments conducted using NGS techniques and respective submissions to public data repositories are increasing faster than those of older technologies such as microarrays. A lot of journals are MIAME or MINSEQE compliant [30, 31]. Data submitted to compliant journals needs to be publicly available and have specified at least a minimum set of information enabling re-analysis of generated data. Method choices for data analysis on such experiments depend on the application and used tools that have different algorithmic properties and use cases.
Databases originally designed for storing microarray data are now increasingly used for NGS experiments storage. Official MINSEQE requirements are broadly stated and therefore enforcement is tricky. Number of RNA-Seq experiments submitted to primary archives has been increasing about two fold on a year-on-year basis. Most important centers of storage are ArrayExpress at EBI (European Bioinformatics Institute) [1] and GEO in the United States [32]. European centres provide faster connection rates so for our analysis purposes data needs to be made available through EBI servers.
Conventional RNA-Seq data analysis process is mostly performed in collaboration with the lab that prepared the reads. Standard protocol of minimal re-analysis does not cover all use-cases. Data stored in public repositories is therefore difficult to use as a separate entity. Tools used in the analysis pipeline do need to infer specifications of data for parametrization directly from metadata. Public data re-analysis needs to account that data providers are not available and metadata is of unknown value.
Each sequencing experiment contains at least two files of metadata. An example set of SDRF and IDF files can be downloaded from a link given in appendix 1. Sample and data
format (SDRF) file is a tab separated human readable format containing properties of all individual samples in an experiment. Experimental factors and properties are specified for each condition. ArrayExpress handling standard classify sample properties into factors, characteristics, commentary and identification pieces. Type of SDRF field is noted in the header together with the field value. Some of the compulsory header values present in every SDRF file are source name, technology type and term source references. Aim of these fields is to describe each sample uniquely as required by MINSEQE platform but also to give as much information about the investigated samples as possible. Investigation Description Format (IDF) is a human readable format containing general information about the experiment. It contains information that is consistent for all samples and adds comparability in relation to other experiments. Values for these include experiment descriptions, identifications, database submission identifiers etc.
ArrayExpress experiment submissions include both raw and processed data. Prepar-ing a comparable set of expression data needs fresh re-analysis startPrepar-ing from raw reads. Because of its extensive scale the analysis has to use a reference framework to guide its operations. Information for developing such a structure and distinguishing suitable ex-periments for analysis can be found in SDRF and IDF metadata files. Inconsistencies in metadata contents and in the availability of raw data mandate only processing a propor-tion of all available public data. Databases interchangeably store microarray data among NGS experiments. RNA-Seq experiments also need to be distinguished from experiments conducted by other NGS technologies.
Distinguishing RNA-Seq experiments with accessible links and accessions is based on SDRF and IDF files. All metadata files are categorized into sequencing, microarray and hybrid experiments. The aforementioned contains input from both microarrays and NGS. RNA-Seq experiments which profile transcription are filtered from other sequencing assays. Selected experiments are additionally checked for suitable accession codes to Eu-ropean Nucleotide Accession(ENA) database which are parsed for raw data downloading sources. This second ENA metadata page is used for validating available raw data and species-wise selection. Superseries are experiments performed under a different general hypothesis from the original experiment that used the same data. These experiments are excluded from the final eligible set.
Experiments are categorized by species. Compatibility of performed RNA-Sequencing analysis is ensured by using a fixed set of tools, common reference transcriptomes and genomes within a species. A collection of datasets of the same species are grouped to-gether in a platform. Processing within these is performed in order of increasing raw file sizes because downloading is time consuming and analysis is performed on local servers. Larger collections are this way constructed in less time and by using less resources.
Con-struction of a database framework enables analysis in multiple separate processes, status tracking and also maintaining an overview of general progress.
1.3.1 Available RNA-Seq experiments(05.2015)
There are 9553 submissions of NGS experiments metadata on EBI’s FTP server. Of these 4435 experiments contain RNA-Seq sequencing data. For improved accession speeds only experiments with FASTQ files made available through ENA were considered. Raw data files are to be analysed in full and bandwidth is a consideration. Superseries experiments matching previously published data were identified in additional 481 cases. ENA accession codes were missing in 183 experiments with suitable data. This means no accessible download links. After removing Small Seq and Chip-Seq experiments 3645 RNA-Seq experiments were retained in total.
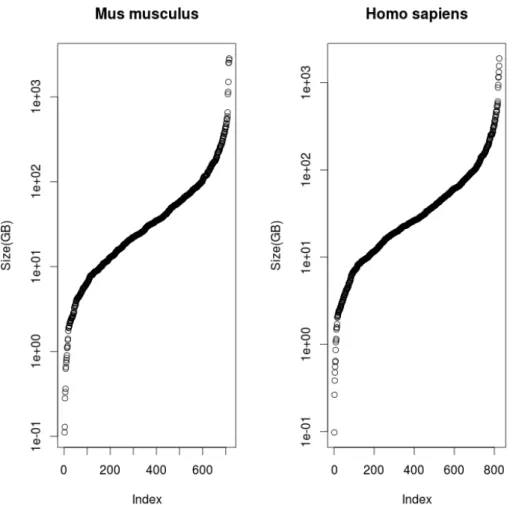
Figure 3: Logarithmically scaled sized of all publicly available RNA-Seq experiments for
Homo sapiens and Mus musculus
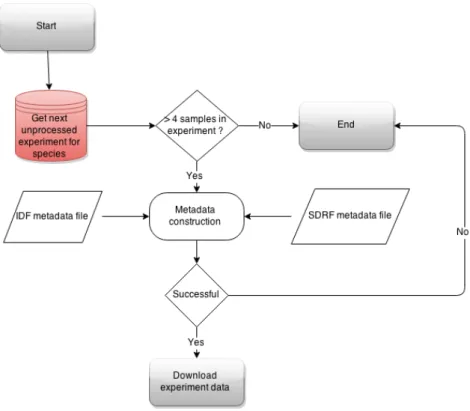
Some experiments include samples from multiple species. Since expression data is gathered into collections partitioned by species such data needs to be analysed separately.
A minimum of 5 samples per experiment are necessary for successful normalization. Alto-gether 2630 experiments contained such number of samples for a minimum of one species. With occasional multiple partitioning, 2847 expression sets were discovered in total as some experiments had enough samples to be analysed for multiple species. This final number of publicly available RNA-Seq experiments suitable for analysis represents the standing by the accocunt of 01.05.2015. These experiments involve 421 different species with highly uneven distribution between platforms. Only 23 species have more than 10 experiments available, seven more than 50 and three more than 100. Mus musculus
(mouse) andHomo sapiens(human) have 824 and 715 experiments containing more than five samples. AmongHomo Sapiens experiments, raw data of 597 experiments is smaller than 100GB in size, whereas 708 out of 715 are smaller than 1TB. For corresponding mouse data analogous numbers are 700 and 819 out of total 824. Figure 3 demonstrates that experiment size distributions are quite similar. Larger experiments do not add much more information to the collection than smaller ones because they often aggregate signal from many different sources.
1.4
MEM
MEM also known as Multi Experiment Matrix is a tool for finding similarly expressed probes over multiple microarray experiments. It was developed by BIIT group in Univer-sity of Tartu [33]. MEM was initially designed to work with microarray data for discov-ering coexpressed features on the level of probes. Microarrays that carry expression data are built by a company called AffyMetrix. These platforms are mostly species specific and many exist for a single species. Information concerning individual platforms and experiments conducted in the framework are available through ArrayExpress database [1].
MEM uses collections of processed public experiment data. Expression levels are calculated for all experiments and these are aggregated into collections grouped by un-derlying AffyMetrix platforms. The software aims to find probesets of greatest similarity to one query probeset by profiling expressions over expandable sets of experimental data.
MEM only allows for querying a single probe/gene of interest. Aggregation of infor-mation from individual experiments is performed over expression value arrays within an experiment. Distance measure values over all arrays are expressed in a single data point and significance value calculations assume equal weights for all experiments. Distance to the query gene is found for each of the probesets on a platform and these values are ranked by order. Numerically closest expression values are given the smallest ranks. This ranking operation is performed separately for all experiments. After ranking operations each probe has a vector of ranks attached to it whose length equals to the number of
experiments. Ranks are then sorted for each probe. Significance p-values for all probesets are calculated using a BetaMEM method based on Rank Aggregation method with prop-erties of beta-distribution. Smaller p-values express lesser probabilities of random rank values on a specific probeset. Probes with smallest p-values are said to be most closely co-expressed with the query probe [5]. Experiments with more coverage or samples from multiple tissues do not therefore necessarily add more value than smaller ones.
Microarray experiment expression values are only meaningful within the context of a given experiment and in comparison with other samples. Probe effects cause incompa-rable expression values between experiments. There are also biases in hybridised probe sequences and from array platforms. MEM disregards these absolute values and only uses similarities from distance measures such as Pearson correlation. This frees the analysis from many constraints. Normalization and missing probe effects make data comparable over and across genes from different experiments.
Methodology of MEM for co-expression discovery requires standardized underlying platforms. Collections used in MEM are organized by microarray platforms which by default contain uniform pre-specified probesets. Similarly, such structure needs to be defined for RNA-Seq expression analysis. In RNA-Seq microarray platforms translate to data from experiments grouped by species and analysed using a fixed transcriptome and reference genome. Based on common structure, RNA-Seq expression matrices can be mined for co-expression patterns using existing MEM framework.
1.5
ExpressView data representation format
NetCDF is a self-describing binary format suitable for storing multidimensional data. The format stores variables across multiple dimensions maintaining a uniform structure for cross-linking and reference between variables. This is achieved by element-wise cor-respondence between different elements of variables at same dimension points. Available suite of tools for manipulating, retrieving and storing that data makes it especially pop-ular for scientific data naturally exhibiting dimensional characteristics.
ExpressView data representation format is a NetCDF file format with fixed architec-ture. Files formatted as such are used as a portable medium meant to work with a variety of in-house tools built by BIIT group. Contents in files are mostly expression matrices with experimental metadata from microarray and next generation sequencing experi-ments. Each file contains a processed data matrix with expression values laid out in two dimensions representing dimensions of the number of genes and samples. Identification values for all of these are set in a separate variable field with one-to-one correspondence to corresponding numerical values.
description and other optional non-track fields also include experiment’s pubmed ID, secondary accession, dataset IDs and links to ArrayExpress webpage. Sample specific metadata is extracted from SDRF files. An example of a SDRF file is given in appendix 1. All fields internally represented as factor values, characteristics and comments are extracted from SDRF files and transformed to accompany expression data. Sample spe-cific metadata is asserted to positionally correspond to expression data matrix values. Individual generated data files are handled as separate entities within a set of all Ex-pressView formatted files on a platform. An example of a dataset in ExEx-pressView data representation format can be downloaded from a link given in appendix 1.
2
RNA-Seq pipeline solutions
All processing pipelines aim to reduce manual workload of the user by combining several sequential steps. A workflow produces final output without intermediate intervention. For RNA-Seq analysis many counterparts have developed their own general purpose pipelines using a selection of available tools and methodologies. In the following we highlight the extent of usage of such solutions. Also limitations that are unilaterally common among work-flows with variable outcomes and application fields.
High heterogeneity between different tools limits the accessibility and usability of pipelines made available for the public. Majority of RNA-Seq pipelines perform sequential analysis of a single experiment. Running each of these often requires a specification of a complex configuration file where parametrizations need to be set separately for all tools part of the analysis process. Scaling the pipeline to multiple experiments makes individual file configuration infeasible. Often a highly hierarchic file layout system is required. Configuration files are time consuming to prepare and require just as many decisions as using individual tools thus not decreasing expected knowledge from the user. This additional file specification removes some of the advantages of employing a pipeline. Choosing suitable parameters for any of the used tools in the process is complicated and mandates acquaintancing with manuals for optimal decisions [35, 36]. Pipelines as well as single-step user-guided analyses need to be able to decrease the number of parametrization decisions for the user. This means that automatic multiple experiment analysis creates the need for on the fly parametrization.
In every pipeline exist intermediate steps for integrating transmission from one process to another. Generally the user has no overview of control on how the data is managed in these steps. This means decreased transparency over result processing [37]. Goals for every pipeline is to increase simplicity of usage and maintain a good overview over processing steps which could attract users with less experience.
RNA-Seq pipelines share only a limited number of similarities beside the name. Differ-ences emerge from the choice of analysis tools, formats of output, methods of maintaining infrastructure, requirements for system prerequisites, modes of running code and most importantly the field of application to which the RNA-Seq pipeline applies. Many tools have completely different requirements for parameters distinguishing them from all oth-ers such as the paired end distribution specification in TopHat [24]. Each alignment and quantification algorithm has its own customizable properties. However, use cases for all different selections has not always been offered sound biological interpretation. Commonly a lot of trust is placed on default values of the algorithm developers. Most developed pipelines that combine various sets of tools have been developed to solve a very specific problem. General release is often a side-effect not a separate goal. This guides potential users with clear analysis goals to building their own that better suits to available computation resources and infrastructure.
iRAP is a pipeline developed in EBI. Its purpose is to prepare collections of analysed data for ExpressionAtlas project [34, 3]. It contains a large number of tools to be selected for data analysis steps making the process highly customizable. It also displays charac-teristics similar to many other pipelines and is optimized for solving a problem of a single type which means troubles generalising to other types of systems. Preliminary usage in-dicated complex installation procedures, a missing mechanism for handling dependencies conflicting with the existing software and signs of very limited parallelization outside a very concrete computational system. Analysing multiple experiments/samples concur-rently requires LSF queue management system which is proprietary. Configuration file requirements include specifications of read pairedness, the distribution of gaps between paired end mates, pre-specified quality encoding and strictly uniform read sizes in sam-ples. Preliminary quality control needs to be performed for obtaining require values so many of the pipeline’s gains are lost for general users.
There are also a number of other inefficiencies. Configuration files are created for every experiment separately. File and sample naming systems are quite complex and indexing of genome files is performed at every run. It is highly probable that these problems on developer’s system locally have been solved with custom scripts and no human intervention is needed in swift processing of ExpressionAtlas data.
However, mentioned drawbacks mean that this solution like many others does not scale outside its very specific domain. By employing existing solutions potential users do not encounter reductions in required user input. Especially if given specifications only apply to a single experiment. For adjusting a solution to a different problem, separate wrapper functions would need to be written which is not suitable to everyone. The number of potential users of RNA-Seq analysis tools/pipelines is quite limited. The time
and monetary effort needed to put into developing a scalable and generalizable automatic pipeline is probably difficult to economically justify. Problem based approaches into building pipelines on local systems are therefore probable to persist in the future as developing one’s own very specific method will probably give better results in faster time. Our aim is to create a collection of analysed expression datasets from maximal num-ber of experiments available through ArrayExpress. Hundreds of experiments analysis requires a different approach on managing the data and processing capacities. This is not offered by any of the existing solutions. Special emphasis is to be set on automatic pa-rameter optimization and real time speed of the analysis. A large number of experiments needs to optimize the performance of analysis on the level of a single experiment and performance, automatic handling and simplicity of usage. It also has to be tuned by the available computation resources in UT servers. Pipeline is supported locally by a database framework that manages data, recollects results and tracks performance. As many others, this pipeline emerges out of specific purpose which is comparative co-expression mining. With this approach this pipeline does not intend to change the paradigm of building pipelines in niche fields. However, it is unique by the nature of its processing task which existing solutions effectively fail to address.
3
Automatic library type inferral
Central part of many RNA-Seq work-flows is expression analysis. Quantifying transcrip-tome expression levels requires knowledge about library preparation protocol which is independent of the used tools. Wide variety of different proprietary kits and ad-hoc methods exist. The value of this parameter depends on the methods used in sample preparation [19]. These kits can be partitioned into three categories. Produced reads in FASTQ files are either unstranded or stranded. Unstranded reads can originate from both sense and anti-sense strands relative to the coding strand of the original transcript. Strand specific directional reads are only sequenced from one of these strands [2].
Annotations for cDNA sequencing from only one of the strands are defined in different contextual terms. cDNA strand synthesis process is described in further detail in section 1.1.1. TopHat and HTSeq both use this information in their processes. Quantification based on exclusive first-strand sequencing of cDNA which is also anti-sense to original transcript is noted asfirst-strand inTopHat andreverse inHTSeq. Here reverse notes the over-turned direction compared to the original transcript strandedness. Second strand cDNA synthesis is analogously second-strand (TopHat) and yes (HTSeq) meaning that reads originate exclusively from the coding strand of the original transcripts. Unstranded protocols preserve no strand information so the sequenced reads can emerge from
synthe-sis of both strands (TopHat -unstranded,HTSeq -no). Inherent drawback of unstranded libraries is the incapability of resolving two overlapping transcripts transcribed on differ-ent strands. This means ambiguous matching of many transcripts.
Strand types of public data are automatically assessed. For this type of data the layout and data formats available in databases such as ArrayExpress which are compliant to the MIMISEQ protocol are assumed.
Transcriptome region comparison with read alignment strands and quantifying the observed results is similar to common ad-hoc method of using BLAT. Only a handful of reads are aligned on the genome to infer the directionality of the reads through visual inspection. Corresponding implementation of this method in RSeQC quality control package samples a portion of total reads and checks the alignments for directionality patterns. This method directly requires the availability of the annotation file, alignment data and additional software (RSeQC) or a new implementation of the same technique on the underlying computational system [14].
Second method uses a count based classifier to establish a comparative method. Count based quantifiers such as HTSeq and most self-made implementations are very common. The method is based on quantification output from using different strand specific proto-cols. New features that enable comparison are constructed and classified. This approach requires no new software and the method generalizes well for further downstream analysis paths.
Thirdly, protocol data available for each experiment is the basis data for a classifier using a simple Naive Bayes approach. Its accuracy is assessed over average of leave-one-out classifiers’ evaluation results. In total 57 protocols/experiments were used. This method requires neither extra data analysis during processing nor any additional soft-ware. Also the accuracy of this classifier exhibits information on how well are researchers describing protocol data. Especially in conditions of inexplicit requirements for library type specifications.
Automatic library type inferring has an important application in pipelines where successful intergrations remove user input requirements to set-up configurations.
3.1
Methods
Aligned reads are compared to the alignment annotation at same chromosomal locations. Strand directionality patterns are reported as ratios. All experiments were available through ENA. Alignment data was generated for 23 experiments totalling 266 samples with true library type information available. Quality control was performed usingFastQC
3.1.1 Alignment fit to transcriptome
All conducted experiments had true labels pre-established. K-nearest neighbour classifier was constructed on the two generated features indicating the ratio of reads aligned to either sense or anti-sense strand. Classification was performed both by individual samples and also by experiments. Ratios were obtained using infer_experiment.py script that is part of RSeQC package. This classifier was trained on data due to its suitability for multi-label classification problems and few assumptions on the distribution of the data. Classifier was validated using a 10-fold cross validation over all samples.
3.1.2 Multiple quantification inferral
Quantification results using two different strand settings are also combined for features to infer true library type. Method is built upon HTSeq, one of the most common raw-count based quantifiers. However, required features can be extracted from any raw-count based quantification tool. HTSeq library type setting is specified as one of the two strand specific parametrization types ("yes"/"reverse"). By specifying one of these all sequenced reads are assumed to originate exclusively from sense or anti-sense strand of the coding region.
Feature generation for both parametrizations requires the number of uniquely aligned reads matching gene or transcript regions and also the number of reads uniquely mapped outside selected annotated regions. It relies on assumption that only a small ratio of overlapping genes on different strands. This is in the region of 5-10% for both human and mouse genomes [38].
The total number of reads aligned to regions annotated by transcriptome using two different strand-specific parametrizations should be similar to the number obtained from quantification using an unstranded library type. Some reads are lost due to ambiguity between strands and in feature construction will be accounted for by scaling. Single descriptive numeric values are obtained from differences of stranded feature values divided by the sum of the same feature counts.
P mstr2−Pmstr1 P mstr1+ P mstr2 ,
where mstr1 marks the feature counts for the first-strand and mstr2 for second-strand
library type. This simple feature transformation can be used for both accounting for uniquely aligned reads and no feature regions. Transformed features are fitted a K-nearest neighbour classifier with a 10-fold cross-validation.
3.1.3 Protocol classifier
ArrayExpress stores a list of protocols used for each stored experiment among other data. We scraped hand-written nucleic acid library construction protocol and nucleic acid extraction protocol protocols for 57 experiments with known labels. Based on these we constructed a Naive Bayes classifier with Laplacian smoothing where the probability of a protocol document Dj belonging to library type Ci is
P(Dj|Ci) = P(Ci|Dj)P(Ci) P(Dj) Also P(Ci|Dj) = Y w∈Vj P(w|Ci) = Y w∈Vj nw+ 1 P w∈Vj (n(w,i)) +|V| ,
where n(w,i) is the number of word w occurrences in class i and and V is the vocabulary
of all protocols and Vj is the vocabulary of protocol j. Also P(Ci) = nDi
nD where nDi is number of protocols D with labeli. From this assigned class for each protocol would be
arg maxi∈niP(Dj|Ci). After classification we performed leave one out cross validation. Classification was carried out in two different cases firstly discriminating only labels between stranded and unstranded library types and secondly also distinguishing the two stranded protocols.
3.2
Results
3.2.1 Transcriptome and alignment correspondence (RSeQC)
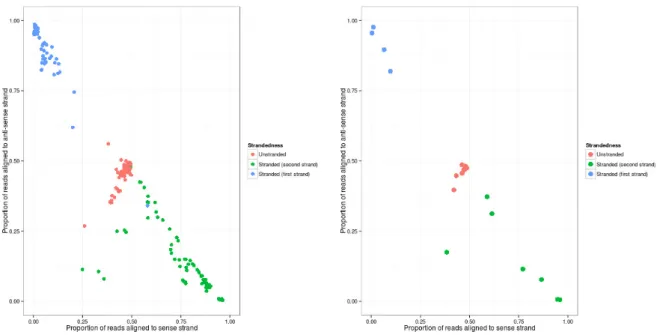
First and second strand alignments also form definitive clusters of three per individual samples of all included experiments as shown in figure 4. KNN-classifier with 10-fold cross validation was fitted and results were averaged for the multi-label classifier. Results are shown in table 2.
Figure 4 indicates discernible patterns for correspondence between strands of align-ments and annotation regions by true library type directionality. Library types are lin-early separable on the measured sample.
Figure 4: Proportions of reads aligned to sense and anti-sense strands for all individual 266 samples (left) and for all samples averaged by grouping into 23 experiments (right) with known true library strandedness types
Table 2: Recall and precision values for sample based KNN-classifier in library type identification
Recall Precision Unstranded 0.97 0.98 First strand 0.98 1 Second strand 0.98 0.97
The classifier gives near perfect results for all labels on multiple binary comparisons.
3.2.2 Classification of raw count quantification results
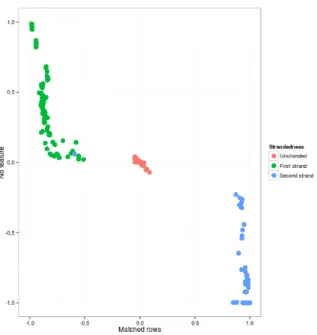
The difference between rows matched to annotated regions and reads with no matches in annotated regions of two library types were used as classification features. Figure 5 shows that likewise three definitive clusters are formed with two variables plotted against each-other. For evaluation 10-fold cross validation was used on all samples as in previous section.
Figure 5: Strand-specific normalized differences of matched and mismatched reads on annotation regions by library types
Table 3 shows that the recall and precision of each library type versus all others are again near perfect. Only a single data-point between strands was misclassified. This corresponds to implications from the visualization on figure 5.
Table 3: Recall and precision of multi-labelled KNN-classification of normalized differ-ences between stranded library types with matched and mismatched reads on annotation data as features Recall Precision Unstranded 1 1 First strand 0.99 1 Second strand 1 0.99 3.2.3 Protocol classifier
In protocol based library type assessment no sample specific discrimination can be made. A Bayesian classifier with leave-one-out cross validation was trained. Protocol sample size was increased from 23 experiments to 57. Naive Bayes classifier for text classifica-tion separated stranded protocols from unstranded protocols with 0.77 accuracy. Table 4 shows that the classifier suggested experiments belonging to stranded library types conservatively misclassifying many such experiments. Experiments classified as stranded were correct in 94% of cases.
Table 4: Naive Bayes text classifier’s recall and precision in separating stranded and unstranded library types
Recall Precision Stranded 0.59 0.94 Unstranded 0.96 0.69
Table 5: Naive Bayes text classifier’s recall and precision in distinguishing library types from one another in a multi-labelling problem
Recall Precision Unstranded 0.96 0.69 First strand 0 0 Second strand 0.39 0.64
protocols does not work as well. Total accuracy fell to 0.63 due to complete inability to distinguish between the two strand specific protocols. These results are shown in table 5.
4
Pipeline
4.1
Database development
Only experiments that have been selected as eligible for analysis are processed by the pipeline. This necessitates a construction of systematic database containing such info. The process for this is demonstrated in the current section.
First, raw metadata files for all experiments are scraped from ArrayExpress FTP databases. Retrieved IDF and SDRF metadata files are downloaded if missing and up-dated when newer versions compared to local file variants are available. This process is tracked in a separated database table and enables fast and effective updates of the system.
Locally downloaded metadata files are the basis for consequential identification of pro-cessing eligible RNA-Seq experiments. SDRF files contain data about individual samples of experiments. Example of a SDRF file is in appendix 1. In the following, all flowcharts describe the retrieval or analysis of a single experiment unless looping over experiments is specifically remarked.
As new data is continuously released databases need to be updated to corroborate the actual status of submissions to ArrayExpress database online.
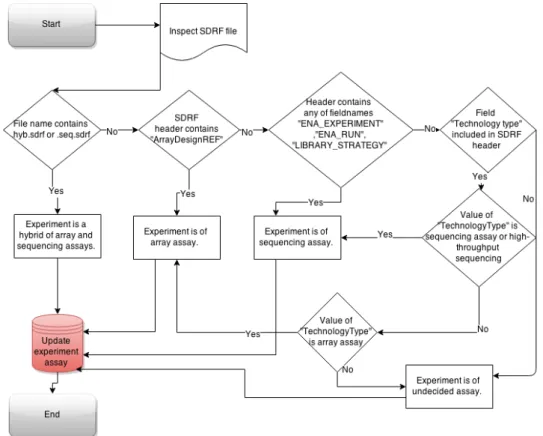
First step in database construction is distinguishing NGS experiments from other experimental settings as shown on figure 6. Separation may be based on metadata fields
only present in a certain assay types or directly inferred from values from within parsed file contents. All experiments available are separated into four broad categories and classified either as array assays(microarrays), hybrid assays, sequencing assays or other experiments which have too little data for accurate separation. Tables for experiments are updated with corresponding decisions.
Figure 6: Flowchart of experiment assay classification in public experiment database construction
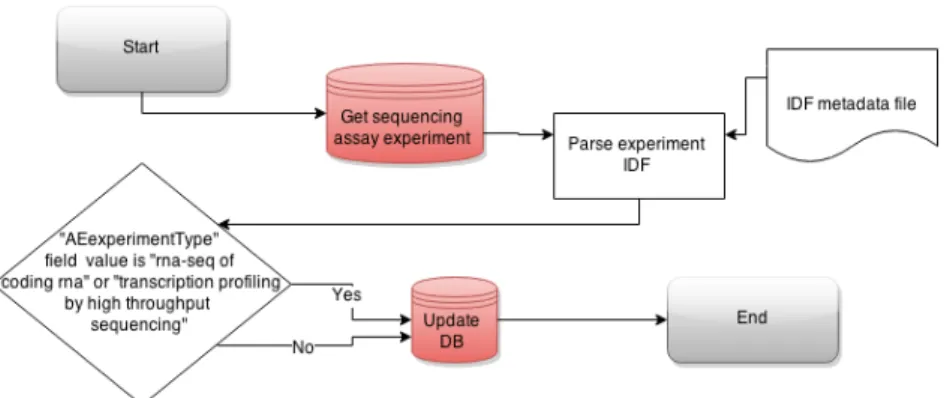
RNA-Seq is one technique out of many NGS based methodologies. Sequencing ex-periments therefore also need to be filtered for exex-periments that were conducted using RNA-Seq library construction techniques. Some NGS methods explore other genomic features besides gene expression. Such information can be inferred from fields specified in IDF metadata describing general overview of the experiment as outlined on figure 7.
Figure 7: Flowchart of RNA-Seq experiment retrieval amongst NGS experiments in public experiment database construction
Experiments are further filtered by the availability of raw data and some other terms for downloading process as outlined on figure 8. For all individual samples, ENA experiment-and individual run accessions have to exist. This is needed to match metadata with the outputted expression matrices. A valid ENA accession code is also a requirement for all experiments. Links for raw data download are parsed from ENA metadata accessions. Metadata constructions and file specifications published by ENA and SDRF/IDF do not always match so practical solutions need early difference detection mechanisms. Pro-cessing superseries experiments would replicate existing results. Duplications need to be eliminated for removing over-representation of some experimental conditions.
Figure 8: Flowchart of data availability classification for RNA-Seq experiments in public experiment database construction
Analysis process for RNA-Seq experiments is time critical and analysed by species in the order of experiment’s raw data sizes. This number is retrieved by counting all
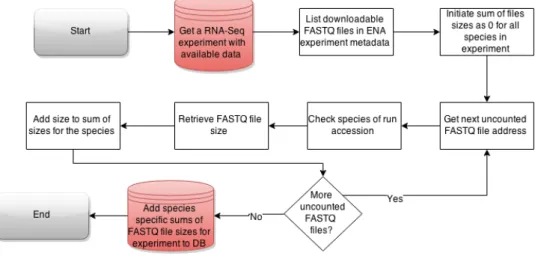
![5 [(2 Methyl 4 nitro 1H imidazol 1 yl)methyl] 1,3,4 thiadiazol 2 amine](data:image/gif;base64,R0lGODlhAQABAIAAAP///wAAACH5BAEAAAAALAAAAAABAAEAAAICRAEAOw==)