Development and Application of Next-Generation Sequencing Methods to Profile Cellular Translational Dynamics
by
Sang Young Chun
A dissertation submitted in partial fulfillment of the requirements for the degree of
Doctor of Philosophy (Bioinformatics) in The University of Michigan
2018
Doctoral Committee:
Assistant Professor Ryan E. Mills, Chair Assistant Professor Jeffrey M. Kidd Professor Mats Ljungman
Professor Alexey I. Nesvizhskii Associate Professor Peter K. Todd
Sang Young Chun [email protected]
ORCID id: 0000-0002-4954-9446
© Sang Young Chun 2018 All Rights Reserved
ii
iii
ACKNOWLEDGEMENTS
Foremost, I would like to thank my advisor Ryan Mills whose guidance, support and mentorship were instrumental to my professional development. Moreover, I am deeply appreciative of his enthusiasm for video games and other esotery that provided needed respite from the stresses of research. I am especially grateful for the advice and insight provided by my committee members, Jeff Kidd, Mats Ljungman, Alexey Nesvizhskii, and Peter Todd. In addition, I would like to express my deepest gratitude to my former graduate advisors, Arul Chinnaiyan and John Kim, whose guidance and advice were critical to my early development as a graduate student. Finally, I am thankful for my past mentors, Hye Sook Kim, Susan Lyons, Duyen Dang, and Long Dang, their advice and support helped spark my interest in bioinformatics.
I am indebted to the many colleagues and collaborators that I have had the privilege to work with over my graduate research career. From the Todd lab, I am grateful for the insight and expertise provided by Caitlin Rodriguez, her collaboration has informed much of my thesis. From the Chinnaiyan lab, I am especially thankful for the guidance provided by Catie Grasso, she helped me understand that efficient programming and lazy programming are often the same. I am also thankful to Mallory Freeberg from the Kim lab for her peer mentorship and support early in my graduate student career; in many ways, she served as a model for what I had aspired to achieve as a bioinformatician and student. I am also grateful for the guidance and support of Kim lab members Amelia Alessi, Allison Billi, Amanda Day, Vishal Khivansara, Arun Manoharan, Natasha Weiser, and Danny Yang. From the Mills lab, I had the distinct privilege to work alongside great
iv
researchers, compatriots, and friends. I would like to thank Gargi Dayama and Arthur Zhou for making clear the importance of learning to plot outside of Excel. I am thankful to Xuefang Zhao for leading the way as the first student to graduate from the lab, and her ever-present humor. I am grateful to Yifan Wang for being an inferior D.va main, and for establishing the tail end of the distribution for Mills lab time-to-doctorate. I would also like to thank Marcus Sherman for his guidance on all things Python, Alex Weber for her good-natured patience at my jokes, and Catherine Barnier for absolutely not being a Fire Noodles challenge cheater. Finally, I am thankful to have worked alongside Akima George, Nan Lin, Chen Sun, Fan Zhang, and Zhenning Zhang.
I am extremely grateful for Brian Athey and his enthusiastic support over the years, as well as Margit Burmeister and Dan Burns; as a longtime student, I was able to experience firsthand how their devotion to the success of their students, like myself, led to the growth of the department to what it is today. In addition, I would like to thank Jeff de Wet for guiding my first steps as a programmer, and Julia Eussen for her tireless advocacy and enthusiasm. I would also like to take a moment to acknowledge the many friends that I made through my time at Michigan. I am especially grateful for the support of my friends Craig Biwer, Mallory Freeberg, Kathryn Iverson, Sunit Jain, Marianne Juarez, Andy Kong, Lisa LaPointe, Datta Mellacheruvu, Bryan Moyers, Arji Mufti, Lee Sam, Conner Sandefur, Avinash Shanmugam, Kraig Stevenson, Brendan Veeneman, Artur Veloso, Amanda Wilkinson, John Wilkinson, and Casey Wright.
Finally, I would like to thank my friends and family, without whose love and support none of this journey would have been possible. My partners in crime, Aash Bhatt, Matthew Jonovich, Jeff Keeler, Rod Rahimi, and Andrew Woodrow. My parents John and Keum Chun, my sister Jamie Chun, and my brother Danny Chun and his wife Brandie. Most importantly, my family Erin Chun, Elijah Chun, and Eleanor Chun: thank you.
v
TABLE OF CONTENTS
DEDICATION ... ii
ACKNOWLEDGEMENTS ... iii
LIST OF FIGURES ... vi
LIST OF TABLES ... viii
LIST OF APPENDICES ... ix
LIST OF ABBREVIATIONS ...x
ABSTRACT ... xiii
CHAPTER 1: INTRODUCTION ...1
CHAPTER 2: SPECTRAL PROFILING OF UORF TRANSLATION IN NON-DIFFERENTIATED AND NON-DIFFERENTIATED NEUROBLASTOMA CELLS ...22
CHAPTER 3: TRANSLATIONAL PROFILING OF UORFS IN A CELLULAR MODEL OF NEURONAL DIFFERENTIATION ...35
CHAPTER 4: INTEGRATED PROFILING OF CHIMERIC JUNCTIONS WITH RIBOSOME ASSOCIATED TRANSLATION IN PROSTATE CANCER ...72
CHAPTER 5: CONCLUDING REMARKS AND FUTURE DIRECTIONS ...95
APPENDICES ...103
vi
LIST OF FIGURES
Figure 1.1 Gene expression and protein synthesis regulation ... 20
Figure 1.2 Adjustment of RPF alignment position ... 21
Figure 2.1 SPECtre pipeline and tri-nucleotide periodicity ... 31
Figure 2.2 Comparative analysis of SPECtre against previously published methods ... 32
Figure 2.3 Examples of SPECtre results and runtime comparison to RiboTaper ... 34
Figure 3.1 Retinoic acid treatment induces neuronal differentiation of SH-SY5Y cells ... 59
Figure 3.2 Differential translation and translational efficiency in SH-SY5Y cells ... 61
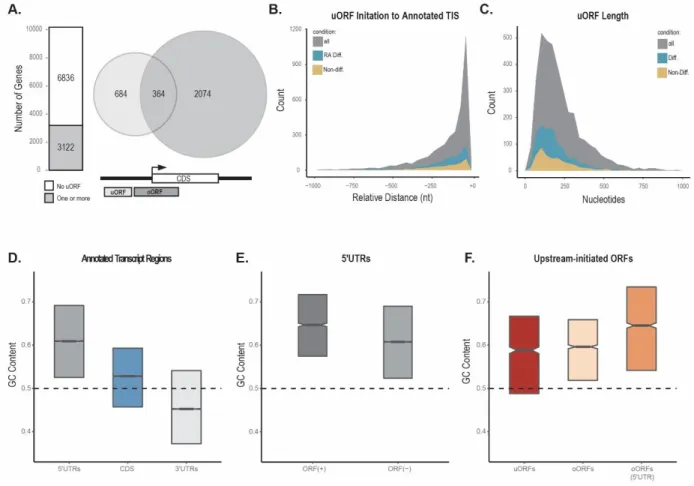
Figure 3.3 Computational prediction and filtering of upstream-initiated ORFs ... 64
Figure 3.4 Characterization of predicted ORFs ... 65
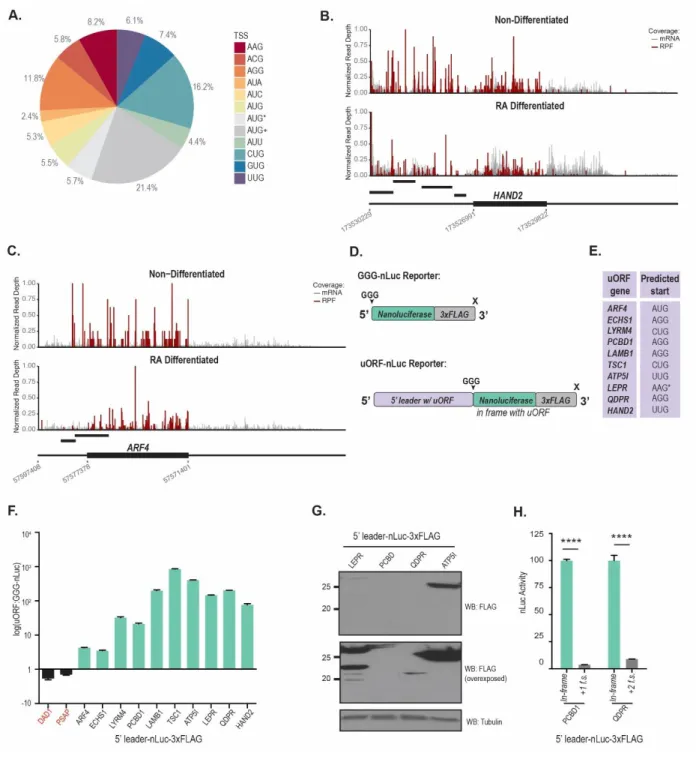
Figure 3.5 Validation of SPECtre scored upstream-initiated ORFs ... 66
Figure 3.6 Translational efficiency of CDS with predicted uORFs ... 68
Figure 3.7 Characterization of predicted ORF regulation and downstream CDS ... 70
Figure 4.1 Schematic of the juncRAT alignment and analytical pipeline. ... 86
Figure 4.2 Integrative chimeric gene fusion breakpoint alignment ... 87
Figure 4.3 Paired-end library support of STAR-FUSION events ... 88
Figure 4.4 Number of spanning reads by breakpoint source and profiling method ... 89
Figure 4.5 Coverage over the ETV1-HNRNPA2B1 breakpoint junction ... 90
Figure 4.6 Coverage over the TXRND1-UTP20 breakpoint junction ... 91
Figure 4.7 Coverage over the ETV1-ACSL3 breakpoint junction ... 92
Figure 4.8 Coverage over the CCT7-DYNC1H1 breakpoint junction ... 93
Figure 4.9 Ribosome profiling validation of junction translation ... 94
Figure A.1. Read length distribution of RPFs aligned to ACTB in mESC... 118
Figure A.2. Distribution of SPECtre scores over ACTB after weighted re-sampling ... 119
Figure B.1 Molecular function gene set enrichment based on mRNA rank-change analysis ... 125
Figure B.2 Cellular component gene set enrichment based on mRNA rank-change analysis ... 126
Figure B.3 Enrichment of up-regulated gene sets based on DE analysis of RPF counts... 127
vii
Figure B.5 Molecular function gene set enrichment based on translational efficiency ... 129
viii
LIST OF TABLES
Table A.1. Number of reads remaining at each stage of pre-processing, alignment and quality filtering of ribosome profiling libraries derived from mESC and zebrafish ... 116
Table A.2. Translational classification accuracy in mESC and zebrafish ... 117
Table B.1 Positive and negative residuals from multiple regression analysis of oORFs in RA differentiated SH-SY5Y cells ... 137
Table C.1 Paired-end and single-end sequencing PC-3 mRNA and ribosome profiling libraries used in this study. ... 140
ix
LIST OF APPENDICES
APPENDIX A: SUPPLEMENTARY MATERIAL FOR CHAPTER 2 ...103 APPENDIX B: SUPPLEMENTARY MATERIAL FOR CHAPTER 3 ...120 APPENDIX C: SUPPLEMENTARY MATERIAL FOR CHAPTER 4 ...138
x
LIST OF ABBREVIATIONS
ACSL3 Acyl-CoA synthetase long chain family member 3
ACTB Beta-actin
ALK Anaplastic lymphoma kinase ALS Amyloid lateral sclerosis
ATP5I Adenosine triphosphate synthase, H+ transporting, mitochondrial F0 complex subunit E
ARF4 Adenosine diphosphate ribosylation factor 4 ATF4 Activating transcription factor 4
AUC Area under the curve
BAM Binary alignment/map format
bp Base pair(s)
BWA Burrows-Wheeler aligner
CANT1 Calcium-activated nucleotidase 1
CC Cellular component
CDF Cumulative distribution function (also, empirical CDF) CDKN1B Cyclin dependent kinase inhibitor 1B
cDNA Complementary deoxyribonucleic acid CDS Coding deoxyribonucleic acid sequence
CHX Cycloheximide
COSMIC Catalog of Somatic Mutations in Cancer CTCF Corrected total cell fluorescence
DE Differential expression
DNA Deoxyribonucleic acid
eIF Eukaryotic initiation factor ENCODE Encyclopedia of DNA Elements
ERG ETS-related gene
ETS Erythroblast transformation-specific
ETV Erythroblast transformation-specific variant
FBS Fetal bovine serum
FDR False discovery rate
FLOSS Fragment length optimization similarity score FMR1 Fragile X mental retardation 1
FMRP Fragile X mental retardation protein
FPKM Fragments per kilobase per million mapped reads FXTAS Fragile X tremor/ataxia syndrome
xi
GADD34 Growth arrest and DNA damage-inducible 34
GEO Gene Expression Omnibus
GFP Green fluorescent protein
GTP Guanosine triphosphate
HAND2 Heart and neural crest derivatives expressed 2
HGVS Human Genome Variation Society
HNRNPA2B1 Heterogeneous nuclear riboprotein A2/B1
HRT Harringtonine
IQR Interquartile range
IRES Internal ribosome entry site
kb Kilobase(s)
LAMB1 Laminin subunit beta 1 LEPR Leptin receptor
MAPQ Mapping quality
mESC Mouse embryonic stem cells
Met Methionine
MF Molecular function
MIEF1 Mitochondrial elongation factor 1 mRNA Messenger ribonucleic acid
mRNA-Seq Messenger ribonucleic acid sequencing
MS Mass spectrometry
NanoLuc Nano luciferase nLuc Nano luciferase
nt Nucleotide(s)
OMIM Online Mendelian Inheritance in Man oORF Overlapping opening reading frame
ORF Open reading frame
PCBD1 Pterin-4 alpha-carbinolamine dehydratase 1 PCR Polymerase chain reaction
PIC Pre-initiation complex
PLXNA2 Plexin A2
PSA Prostate-specific antigen PTM Post-translational modification QDPR Quinoid dihydropteridine reductase
RAM Random access memory
RA Retinoic acid
RCC1-201 Regulator of chromosome condensation 201
RNA Ribonucleic acid
RNA-Seq Ribonucleic acid sequencing ROC Receiver operating characteristic
xii
RPKM Reads per kilobase per million mapped reads rRNA Ribosomal ribonucleic acid
SA Suffix arrays
SAM Sequence alignment/map format
SRA Sequence Read Archive
STAR Spliced Transcripts Alignment to Reference
SV Structural variants
TIS Translation initiation site
TMPRSS2 Transmembrane protease, serine 2 TPM Transcripts per million
TPM4 Tropomyosin 4
tRNA Transfer ribonucleic acid TSC1 Tuberous sclerosis 1 TXNRD1 Thiodoxin reductase 1 TSS Translation start site
UCSC University of California at Santa Cruz uORF Upstream open reading frame
UTP20 Component of the U3 small nucleolar RNA protein complex UTR Untranslated region
xiii
ABSTRACT
The transmission of genetic information from the transcription of DNA to RNA and the subsequent translation of RNA into protein is often abstracted into a linear process. However, as methods and technologies to measure the genomic, transcriptomic, and proteomic content of cells have advanced, so too has our understanding that the transmission of genetic information does not always flow in a lossless manner. For instance, changes observed in messenger RNA (mRNA) abundance are not always retained at the proteomic level. Indeed, a diverse array of mechanisms have been identified that exert regulatory control over this transmission of information. Next-generation short read sequencing has driven many of these insights and provided increasingly nuanced understanding of these regulatory mechanisms. However, the continued development and application of sequencing methodologies and analytics are required to properly contextualize many of these insights on a more global scale. Ribosome profiling is one such recent advancement which enriches for protected fragments of mRNA; sequencing and analysis of these ribosome-protected mRNA fragments enables profiling of the translational content of a sample. The aim of this dissertation is to address the need for the development and application of statistical and analytical algorithms to profile the regulatory factors that contribute to the translational dynamics in cells.
In the first chapter, I survey the development and application of next-generation sequencing methods for the profiling and computational analysis of translation and translational dynamics. In
xiv
the second chapter of this thesis, I present SPECtre, a software package that identifies regions of active translation through measurement of the translational engagement of ribosomes over a transcript. SPECtre achieves high sensitivity and specificity in its classification of regions undergoing translation by leveraging the codon-dependent elongation of peptides; this tri-nucleotide periodicity is evident in the alignment of ribosome profiling sequence reads to a reference transcriptome. SPECtre classifies actively translated transcripts according to their coherence in read coverage over a region to an optimal tri-nucleotide signal.
In the third chapter, I describe the application of SPECtre to identify the translation of upstream-initiated open-reading frames that may regulate differentiation in a neuron-like cell model. uORFs are transcripts that result from the initiation of translation from AUG, and under certain biological constraints, from non-AUG sequences localized in the 5’ untranslated regions of annotated protein-coding genes. Subsets of these uORFs have been implicated in the regulation of their downstream protein-coding genes in yeast, mice and humans. In this chapter, I provide further evidence for this regulation as well as the spatial context for the functional consequences of uORF translation on downstream protein-coding genes in a neuron-like cell line model of differentiation.
Finally, in the fourth chapter, I outline a strategy using our coherence-based translational scoring algorithm to profile ribosomal engagement over chimeric gene fusion breakpoints in prostate cancer. Here, known breakpoints from current annotation databases are integrated with novel junctions nominated by existing whole genome and transcriptomic gene fusion detection algorithms, and the translational profile over these chimeric junctions using SPECtre is measured. This provides an additional layer of translational evidence to known and novel gene fusion
xv
breakpoints in prostate cancer. Ongoing development of a database and visualization platform based on these results will enable integrative insights into the transcriptional and translational topology of these breakpoints.
1
CHAPTER 1 INTRODUCTION
1.1 Translation
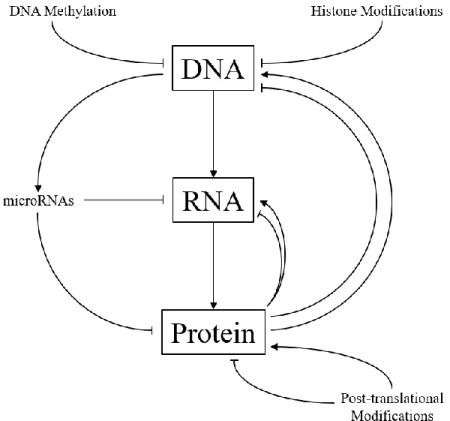
The transmission of genetic information may be conceptualized as a linear process where double-stranded DNA is transcribed into a single-double-stranded mRNA, and the translation of this mRNA into functional protein (Figure 1.1).[1] However, this transmission of encoded information in the genome from DNA into RNA to protein is subject to multiple points of coordinated governance; these include, but are not limited to, changes in DNA conformation, epigenetic regulation, transcription and post-transcriptional control, and translational and post-translational regulation. These regulatory mechanisms and checkpoints can exert profound, often non-linear effects on the ultimate abundance of protein in a cell.[2-10]
Translation is the mechanism by which the information encoded by an mRNA is converted into a protein through the systematic addition of tri-nucleotide sequences, alternatively referenced as codons or amino acids, by ribosomes. Thus, ribosomes and their associated complexes represent the translational machinery of a cell. Translation can be roughly divided into four parts: initiation, elongation, termination, and ribosomal dissociation. In eukaryotes, translation initiation is
2
typically mediated by a pre-initiation complex comprised of eIF2 bound to methionyl-initiator tRNA and a 40S ribosomal subunit. eIF4 facilitates the binding of the PIC to the 5’ end of a 7-methylguanosine (m7G) capped nascent mRNA and scans to the 3’ end until an AUG tri-nucleotide translation initiation sequence is recognized.[11,12] In certain instances, translation may initiate from non-AUG near-cognate codons, and under other biological contexts translation may alternatively initiate from non-AUG non-cognate sites.[11,13] Upon successful initiation, a 60S ribosomal subunit is engaged by the PIC to form a complete 80S ribosomal complex, which mediates the elongation of the emergent peptide through the systematic recruitment and addition of subsequent tri-nucleotide codons. Peptide elongation proceeds until one of three in-frame termination signal moieties are recognized, at which point the 80S ribosomal complex is dissociated and the peptide completes its structural formation into protein.
1.2 Regulation of translation initiation
Although regulatory mechanisms may positively or negatively affect translation during elongation, termination or ribosomal dissociation, translational regulation at the point of initiation has been more comprehensively studied.[14-16] Briefly, regulation of translation initiation has multiple points of control including sequence context, mRNA secondary structure, or translation of alternative upstream open-reading frames.[17]
As mentioned previously, translation is typically initiated at AUG tri-nucleotide start sites. However, favorable flanking sequence context may enrich for initiation at specific AUG sites over
3
others. In bacteria, the Shine-Dalgarno (SD) sequence is a sequence motif that enhances the recruitment of the PIC to AUG initiation sites and promotes protein synthesis.[18] In eukaryotes, context for the site-specific preference of certain AUG sites over others is provided by the flanking Kozak consensus sequence.[12] Due to the 5’ to 3’ directionality of the scanning PIC, the AUG closest to the 5’ end of the m7G-capped mRNA typically dictates translation initiation. However, presumptive AUG initiation sites may be skipped by the PIC, termed leaky scanning, if their flanking sequence context is unfavorable (e.g. lacking a Kozak consensus sequence). Alternatively, near-cognate non-AUG tri-nucleotides, that differ from the canonical AUG initiation sequence by a one base substitution, may be selected by the PIC to initiate translation. Translation initiation from near-cognate sites is typically mediated by the abundance and activity of additional eIFs, such as eIF1 and eIF5.[19,20] eIF1 and eIF5 have cross-regulatory effects on the initiation of translation from near-cognate sites; eIF1 promotes the utilization of non-AUG start codons, whereas eIF5 antagonizes eIF1-mediated non-AUG near-cognate site translation initiation.
Shorter 5’UTRs, generally less than 20 nucleotides in length, may be prone to leaky scanning and have a detrimental effect on the translational efficiency of the encoded mRNA.[21,22] Further, the secondary structure of the 5’ capped mRNA transcript may also modulate the efficiency of translation initiation. Longer 5’UTRs with a stable stem-loop structural conformation may stall the scanning PIC and promote the usage of sub-optimal AUG sites, or in some cases, bias translation initiation from near-cognate non-AUG start codons.[23] In addition, the normal scanning mechanism of the 5’ capped mRNA by the PIC may be circumvented by internal ribosome entry sites; IRES are sequence elements that promote the entry of the PIC into the 5’UTR in a m7
G-4
independent manner.[24] Taken together, specific sequence motifs in the 5’UTR or secondary structural conformation may promote the binding and recruitment of proteins and complexes that regulate the initiation of translation, sometimes from sites upstream of the canonically encoded protein-coding sequence translation initiation start site. Translation initiation and elongation of open-reading frames from these upstream start sites can modulate the translational efficiency of the canonical protein.[25-30] These ORFs may terminate upstream of the annotated protein-coding translation initiation site, or at an in-frame or out-of-frame termination site that overlaps the canonical CDS. The translation of upstream-initiated ORFs, inclusive of those terminated proximally upstream and within the canonical CDS, may hinder the translation of the annotated protein in a resource-dependent or sterically competitive manner.[31]
For instance, translation of one of two experimentally validated ORFs initiated upstream of the transcriptional regulator ATF4 are dependent on the phosphorylation of eIF2 in response to cellular stress.[32] ATF4 mediates the expression of genes that mitigate damage caused by cellular stress.[33,34] The translation of ATF4 is governed by two ORFs: uORF1, which terminates upstream of the ATF4 CDS, and uORF2, which terminates within the annotated CDS of ATF4. The 5’ proximal uORF1 is a positive-acting cis-regulatory element that modulates ribosomal scanning and re-initiation of the downstream ATF4 coding sequence.[35] When eIF2-GTP is abundant under normal, non-stressed conditions, scanning ribosomes downstream of uORF1 re-initiate at uORF2, which inhibits translation of the ATF4 protein. In stressed conditions, eIF2 is phosphorylated and results in a reduction of free eIF2-GTP; reduced levels of eIF2-GTP increases the time required for the scanning ribosomes to re-initiate translation at uORF2. Thus, ribosomes downstream of uORF1 scan through and do not re-initiate translation of uORF2, instead translation
5
is re-initiated at the ATF4 CDS, which in turn promotes the transcription of downstream target genes in response to cellular stress.[35-37]
1.3 Upstream open-reading frames and disease
Translation of upstream-initiated ORFs contributes to the regulatory circuitry of a cell; indeed, their dysregulation has been implicated in the development and progression of various diseases. Sequence variants that introduce, ablate, or otherwise disrupt upstream-initiated ORFs may alter the translational efficiency of the downstream protein-coding sequence and affect phenotypic outcomes.[31] A 4 nucleotide deletion in the 5’UTR of the cyclin-dependent kinase inhibitor CDKN1B results in a frame-shifted termination signal of an upstream-initiated ORF leading to a reduction in the intercistronic space between the normally encoded uORF and the downstream CDS.[36] As a consequence, the efficiency of translation re-initiation at the CDKN1B CDS is decreased and results in down-regulation of the cell cycle inhibitor p27; patients with under-expression of p27 often develop multiple endocrine neoplastic syndrome.[37] Furthermore, translation may alternatively initiate from upstream non-AUG sequences; translation initiation from near-cognate and non-cognate AUG start sites have also been implicated in the etiology of different diseases. Expansion of a CGG tri-nucleotide repeat in the 5’UTR of the fragile X gene FMR1 induces a conformational change in the secondary structure of the nascent mRNA which promotes the recruitment of the 40S PIC to initiate translation in the absence of an AUG or near-AUG start site sequence.[38] Therefore, the translation of upstream-initiated ORFs comprise an
6
additional layer of complexity in the regulatory topology of both normal cellular function and disease-associated phenotypes.
1.4 Other regulatory factors that affect protein abundance
The abundance of mRNA in a cell may by modulated by transcriptional and post-transcriptional regulatory mechanisms, and the ultimate readout as proteomic abundance may be obscured biologically by other post-translational means. Exhaustive and ongoing research efforts have characterized many of these mechanisms, therefore only selected regulatory pathways that moderate mRNA and protein abundance are detailed here.
Similar to translation initiation, sequence-specific moieties and changes in structural conformation can promote, or alternatively, repress the transcription of DNA into RNA. In general, DNA is structurally condensed and organized around histones; and various proteins and transcription factors may act to mediate the accessibility of that DNA to the transcriptional machinery of the cell.[39] Sequence motifs in the 5’UTR, and in particular the 3’UTR may specifically bind small non-coding microRNAs; microRNAs bound to the 3’UTR of protein-coding transcripts may selectively target them for degradation.[3,40,41] In this way, post-transcriptional regulation of protein-coding genes by microRNAs may alter their ultimate abundance in the proteome.[42] Alternatively, termination signals in-frame to the canonical translation termination site in the CDS of protein-coding genes may trigger the nonsense-mediated decay pathway and repress the abundance of certain proteins.[43] Finally, post-translational modifications may alter the stability,
7
activity and, in some cases, the localization of proteins; altogether, these mechanisms contribute to determine the proteomic fate of various mRNA transcripts, or may constrain the accessibility of some proteins to orthogonal detection methods.[44]
1.5 High-throughput sequencing and RNA-Seq
The sequencing and assembly of the human genome ushered in an era of unprecedented discovery, and was made possible only by the inestimable efforts of thousands of researchers, as well as critical methodological and technological innovations.[45,46] Sanger sequencing, whole genome shotgun sequencing, and computational assembly algorithms empowered the completion of the initial draft of the human genome.[47-49] One unexpected result of the sequencing and assembly of the human genome was the paucity of protein-coding genes, especially for an organism considerably higher in complexity relative to mice, flies, or even single-celled organisms like yeast. Where it was once assumed that the human genome would consist of hundreds of thousands of protein-coding genes, scientists and lay people alike were astounded when finalized estimates placed this number around roughly 20,000 genes.[50] Thus, efforts were concentrated to develop experimental and computational methods to interrogate alternative models of gene expression regulation that might provide further insight into the complexity of the human transcriptome and proteome.
Highly reproducible, increasingly sensitive and massively parallel methods were developed to isolate and amplify selected sequences, and then computationally assess their composition at single
8
nucleotide resolution through the marriage of biochemical readouts and imaging technologies. In this way, total RNA-Seq and mRNA-Seq, and high-throughput protein arrays and mass spectrometric methods were developed to interrogate the transcriptomic and proteomic content of a cell, respectively.[51-56] In a typical mRNA-Seq experiment, total RNA is extracted from a single cell, collection of cells, or organism, and then reverse transcribed into cDNA. Following reverse transcription, the cDNA is fragmented into smaller sequences, size-selected, and then ligated to sequencing adapters. The adapter-ligated cDNA sequences are then subjected to several, or up to dozens of cycles of PCR amplification and then sequenced on a high-throughput sequencing machine. Depending on the sequencing technology, an mRNA-Seq experiment can produce anywhere from several million to hundreds of millions of single-ended or paired-end reads. Paired-end reads leverage the size selection step of library preparation to ligate both ends of a cDNA fragment with sequencing adapters; using the expected size distribution between the ends of these paired reads, additional information may be extracted upon sequence alignment that can aid in the identification of splice junctions or structural variants.[57] Single-end and paired-end sequences aligned to a reference transcriptome have been used to infer the relative abundance and structure of various RNA species, including non-coding transcripts, protein-coding genes, and alternatively spliced isoforms.[58]
1.6 Sequence alignment
After reads are collected from a high-throughput sequencing machine, bioinformatics analysis begins with an assessment of sequence content and quality. Artifacts of PCR amplification may be
9
identified and accounted for, if required, in downstream analyses. Prior to alignment, adapter and contaminant removal, followed by quality trimming of the sequence reads may be required; since many alignment algorithms are sensitive to the quality of reads at single nucleotide resolutions, inclusion of low quality nucleotides may affect not only where a read is aligned, but affect the overall confidence of its alignment.[59] Due to the biochemical properties of prolonged polymerase activity during sequencing-by-synthesis methods, the 3’ ends of reads are often of lower quality than those towards the 5’ end of the read.[60] Thus, quality trimming software may be used to survey the length of a sequenced read, and then selectively trim its ends if succeeding sequences of nucleotides fall below a pre-determined threshold for minimum quality.
Once read libraries have been assessed for sequence content and subjected to quality control measures, they are then ready for alignment to a reference genome or transcriptome. Since one-to-one string comparison of potentially hundreds of millions reads against millions or billions of possible reference target locations would be computationally expensive, reference sequences are often condensed and indexed using speedy compression algorithms, such as a Burrows-Wheeler transformation.[61] Compression and indexing of reference sequence target locations increases the speed and efficiency of string alignment search by many orders of magnitude. Representative alignment pipelines based on Burrows-Wheeler transformation include BWA, Bowtie, its successor Bowtie 2, and the splice-aware aligner TopHat.[62-65] Alternatively, the STAR algorithm leverages uncompressed suffix arrays to enable increasingly efficient alignment of sequence reads to a reference.[66] Other alignment algorithms, like Sailfish, utilize a k-mer assembly approach to estimate the relative abundance of transcripts.[67] Reads aligned to a reference genome or transcriptome are assessed for quality based on a number of factors, including
10
but not limited to, individual base pair quality, tolerance for insertions or deletions in the alignment, and parsimony of alignment, where sequence reads mapped to multiple loci are often scored lower than those that are aligned to unique locations on the reference. Since all subsequent analyses, including transcript abundance estimation and structure are based on the overall quality of sequence alignment, careful consideration must be given to aligner selection and parameterization.
1.7 Estimation of relative transcript abundance from RNA sequencing data
The relative abundance of transcripts and isoform structure may be inferred through assessment of those sequence reads that align across, or span, exon-exon splice junctions constructed from a reference transcriptome or transcript annotation database. In addition, paired-end sequence alignment and careful observation of deviations from the expected distribution of the distance between these read pairs can be used to guide increasingly sensitive and specific transcript structure assembly, or even identify de novo splice junctions.[58,64] Since the sampling of cDNA fragments from which the sequence reads are derived is typically assumed to be random, the relative abundance of reads aligned to a transcript may be used to infer its relative abundance. Since longer transcripts are more likely to be sequenced, relative transcript abundance is typically summarized as a library and transcript length-normalized estimate. RPKM, FPKM or TPM may be estimated directly from the number of reads annotated to each transcript, however more sophisticated algorithms like Cufflinks and RSEM build statistical models based on alignment parsimony to more accurately assemble transcripts and report their relative abundance.[58,68]
11
With multiple replicates, the differential expression of genes or transcript isoform abundance may be assessed using statistical metrics, or by using software packages like EdgeR or DESeq.[69-71] In this way, it is possible to observe and report global patterns in gene expression or relative isoform abundance across conditions or sample cohorts.
1.8 Mass spectrometry and estimation of protein abundance
Protein identification and their relative abundance may be estimated using immunoassay-based methods including Western blotting, ELISA, or through reporter-linked immunoluminescent readouts like GFP or firefly luciferase.[72-75] Immunoassay-based methods for protein identification and abundance estimation may be limited by the availability of high-quality, specific antibodies, and the concurrent measurement of multiple protein species in a single experiment can be technically challenger, or time and labor intensive. More recently, protein microarrays were developed for the high-throughput assessment of protein abundance in a sample; they are relatively cheap to produce, and may be customized to experimental requirements. Like immunoassay-based methods, protein microarrays may be limited by the availability of suitable bait antigens, and protein-protein interactions may not be accurately assessed due to immobilization of secondary or tertiary structure. In addition, the overall search space of a protein microarray experiment may be artificially constrained by the density available on the chip.[76]
Technological advances in automation and detection sensitivity have enabled increasingly high-throughput investigation of the proteomic content of a sample using mass spectrometry-based
12
approaches. In a typical high-throughput MS experiment, proteins are selected according to size, or by affinity purification. Isolated proteins are then fragmented, their constituent peptides are ionized, and the mass-to-charge time of flight of these peptide-ion species is measured. Peptide sequences may then be assembled de novo, or more generally, compared against a reference protein and peptide sequence database using search algorithms like MASCOT, X!Tandem, PeptideProphet, or MSFragger.[77-81] Most search algorithms take an input MS/MS spectrum and compare it against a theoretical peptide sequence fragmentation database. Sensitivity and specificity of the peptide search against the fragmentation database may be customized, including parameterization for mass tolerances allowed, proteolytic enzyme constraints, and for the types of post-translational modification that may be considered. The output from the database search is a list of peptide sequence matches ranked according to their likelihood of being a positive match. Relative protein abundance may be estimated from the number of spectra assigned, or more accurately, normalized according to identification parsimony.[82]
1.9 Confounding variables in the comparison of transcriptome and protein abundance
Comparison of transcript abundance estimates based on mRNA-Seq, and those based on MS experiments and database search, are positively but only moderately correlated.[83] There are several factors which may complicate the comparison of abundance estimates across -omic space, some of which have been detailed above. Briefly, post-transcriptional regulation by microRNAs may target certain mRNAs for degradative clearance, and may result in anti-correlated transcript abundance with protein expression. The translation of some mRNAs into protein may be
13
negatively regulated through competitive or steric inhibition by uORFs. Moreover, PTMs like ubiquitination may result in the selective degradation of protein species and subsequent down-regulation of their abundance when measure by mass spectrometry. In addition, other PTMs may alter the structure, activity, or sub-cellular localization of a protein and complicate their isolation, fragmentation, or detection using MS-based assays.
Global comparison of transcript expression with protein abundance may be further confounded by bioinformatics-based biases inherent to transcriptome or protein searches. For example, liberal parameterization of sequence alignment or during transcript assembly may artificially enrich for false positive transcript structures, or splice junctions with poor evidentiary support. Peptide databases derived from less stringently assembled transcripts may significantly enlarge the potential search space, and result in spurious peptide matches. Furthermore, depending on how the peptide database is constructed, or its search parameterized, certain transcript variants may be alternatively identified as a novel peptide, instead of a post-translational modification of an existing peptide. Thus, considerable thought must be given to how comparative studies of transcript expression and protein abundance are conducted, and interpreted.[84]
1.10 Translational profiling through sequencing of ribosome-protected mRNA
Ribosome profiling, or Ribo-Seq, is a next-generation high-throughput sequencing methodology that was developed to directly investigate the content and dynamics of actively translating ribosomes.[85] Ribosome profiling involves the isolation and massively parallel sequencing of
14
ribosome-protected fragments of mRNA; since these mRNA fragments, or footprints, are protected from enzymatic digestion during library preparation by their complexed ribosomes, they are representative of regions in a transcript under active translation. A typical ribosome profiling experiment starts with cellular lysis to isolate mRNA bound by ribosomal complexes. Treatment with biochemical translation elongation inhibitors, like cycloheximide, or through combinatorial cold-shocking of the samples, immobilizes ribosomal complexes over an mRNA.[86,87] Exposed regions of mRNA not protected by a ribosome are enzymatically digested using a ribonuclease, and the mRNA:ribosome complexes are isolated using sucrose gradient density centrifugation. Ribosomes are proteolytically disaggregated to free the bound mRNA, and the de-coupled mRNA is then size selected in order to enrich for a range of 28-30 nt fragments typically protected by a ribosome. Sequencing adapters are ligated to the 3’ ends of the isolated fragments of mRNA, biotinylated, and then purified to deplete the sample of ribosomal RNA contaminants. The adapter-ligated mRNA fragments are reversed transcribed into cDNA, subjected to several cycles of PCR amplification, and then sequenced on a high-throughput next-generation sequencing machine.[88]
1.11 Bioinformatic considerations for the analysis of ribosome profiling data
Once ribosome profiling library sequence reads are collected from a next-generation sequencing machine, the RPFs are removed of sequencing adapters and then trimmed by minimum base quality thresholds. Ribosome profiling reads may then be aligned to a reference genome or transcriptome using established methods suitable for RNA- or mRNA-Seq experiments. However, even after immunoaffinity depletion during library preparation, rRNA contamination can persist
15
in the sequenced ribosome profiling reads due to the presence of several kilobases of rRNA in a ribosomal complex.[89] rRNA contaminants can comprise anywhere from 10% to up to 80% of sequenced reads in a given ribosome profiling experiment.[90] Thus, prior to alignment, ribosome profiling reads are typically aligned to a contaminant sequence database to further deplete them of rRNA sequences. Following this bioinformatic depletion of rRNA contaminant species, the remaining unmapped reads are then aligned to a reference genome or transcriptome. Alignment parameters must be carefully selected, and post-alignment quality control must be judiciously applied; because of their shorter length (28-30 nt) compared to the typical length of fragments isolated in many contemporary mRNA-Seq experiments (50-150 nt), ribosome profiling reads are more sensitive to non-parsimonious alignment.[91] In addition, treatment with different biochemical translation elongation inhibitors may enrich for varying lengths of mRNA due to changes in the conformation of immobilized ribosomes. Cycloheximide treatment enriches for mRNA fragments with an average length of 28-30 nt, whereas immobilization through cold-shock alone, enriches for a secondary population of mRNA fragments which range in size from 18 to 22 nucleotides.[92]
Following alignment, positional analysis of RPFs over a transcript must account for the physical localization of an isolated mRNA fragment inside the ribosome.[93] Internal mRNA fragment localization is also inhibitor-dependent; cycloheximide is a translation elongation inhibitor that induces a conformational change in the E-site of the ribosome.[94] Therefore, the aligned position of ribosome profiling sequence reads derived from cycloheximide immobilization must be centered to the A-site of the ribosome. In contrast, harringtonine is a translation elongation inhibitor that prevents the peptidyl transfer of the amino-acid:tRNA to the nascent peptide. Thus,
16
the aligned position of ribosome profiling reads in harringtonine-derived sequence libraries must be adjusted to the P-site of the ribosome. To determine the A- or P-site offset to adjust the aligned position of ribosome profiling reads derived from cycloheximide or harringtonine immobilization, respectively, reads of the same length that overlap annotated canonical translation initiation sites are extracted. Reads of the same length are collected, and the most common distance from the 5’ ends of these reads is used to adjust the aligned position of all reads of identical length (Figure 1.7).[93] For example, if the most common distance from the 5’ end of 28 nt length reads overlapping canonical AUG initiation sites is 13 nt, then the 5’ aligned position of all reads 28 nucleotides in length are adjusted by 13 nucleotides from their 5’ end. In this way, the A- or P-site adjusted aligned position of reads is reflective of the structural-dependent position of the ribosome over the bound mRNA.
1.12 Identification of regions under active translation
Given some of the limitations of comparative analysis between transcript expression and protein abundance, ribosome profiling is strategically positioned to provide an intermediate view of translation and translational dynamics. However, because of the generally shorter lengths of RPFs, alignment of ribosome profiling sequence reads can be especially sensitive to non-parsimonious alignment to multiple locations on a reference genome or transcriptome. Therefore, rudimentary coverage metrics may not be sufficiently robust enough on their own to reliably identify regions in the transcriptome under active translation. To that end, several algorithms have been developed
17
that leverage critical features of translation, ribosome profiling library preparation, and fragment alignment to more accurately detect actively translated regions of the transcriptome.
Size selection during ribosome profiling library preparation typically enriches for fragments of 28-30 nt in length.[85] Thus, an early translational scoring rubric was developed that was based on deviation from this expected enrichment of specific fragment lengths; this fragment length optimization similarity score was calculated by comparing the distribution of fragments aligned to a transcript against an aggregated distribution of reads aligned to all annotated protein-coding genes.[95] Transcripts with fragment length distributions that closely matched that of the aggregated reference distribution were classified as actively translated. However, because the scoring metric is dependent on efficient size selection during library preparation, FLOSS classification of translation may be sensitive to technical variations in ribosome profiling sequence library generation.[96]
Subsequent translational classification algorithms based on analysis of ribosome profiling sequence data have taken advantage of additional characteristics inherent to translation and the alignment of RPFs to a reference transcriptome. Peptide elongation occurs through the systematic formation of peptidyl:tRNA bonds as amino acids are sequentially added to a nascent protein. Since amino acids, or codons, consist of triplet nucleotides, when ribosome profiling reads are aligned to a reference transcript, the A- or P-site adjust aligned position of these fragments tracks the tri-nucleotide codon-dependent elongation of a peptide (Figure 1.8).[95,97,98] ORFscore is a translational classification metric that scores the enrichment of RPFs over the canonical reading
18
frame in a transcript.[99] However, ORFscore employs a conservative scoring heuristic that penalizes severely for RPF enrichment outside of the canonical reading frame. Therefore, classification of the translational activity of transcripts based on ORFscore is less robust than other more recently developed algorithms.[96]
More recently, translational profiling algorithms including ORF-RATER, RiboTaper, and SPECtre were developed; all three model the tri-nucleotide periodicity of aligned A- or P-site adjusted ribosome profiling reads to measure translational activity.[96,100,101] ORF-RATER utilizes a regression-based model to score the tri-nucleotide periodicity of aligned RPFs against a re-sampled transcript read coverage profile. Alternatively, RiboTaper and SPECtre directly model aligned and adjusted RPF coverage as a signal process, and then scores its coherence, or power relationship, to a reference tri-nucleotide periodic signal.[102,103] RiboTaper uses mRNA-Seq to build a null distribution and applies Slepian functions to normalize and score the coherence of RPF coverage over a transcript. In contrast, SPECtre scores the windowed (Welch’s) coherence of RPF coverage over a transcript against an idealized tri-nucleotide periodic signal. RiboTaper and SPECtre are robust to technical variations in ribosome profiling library preparation, and demonstrate comparable levels of sensitivity and specificity for the identification of regions in the transcriptome under active translation.[96] Notably, SPECtre achieves this accuracy in translational classification in the absence of mRNA-Seq data.
19
Entrenched between transcriptional and proteomic survey methodologies, the analysis of ribosome-protected sequence fragments enables the surveillance of translation, and translational dynamics. In the proceeding chapters, we detail work that begins with the development of SPECtre, which measures the translational activity of regions in the transcriptome as a function of its tri-nucleotide periodicity. This work forms the basis for the robust detection of uORFs involved in the regulation of retinoic acid induced neuronal differentiation of SH-SY5Y cells. Finally, we extend SPECtre profiling to investigate the translational landscape of chimeric gene fusion breakpoints in prostate cancer. Breakpoints are identified through integrative curation of known fusion transcripts with de novo predictions from mRNA sequencing studies; profiling of these breakpoints enables the integrative characterization of chimeric gene fusion events from transcription to translation.
20
Figure 1.1 Gene expression and protein synthesis regulation. Genomic information encoded as DNA is first transcribed into RNA, then translated into protein through the multi-factorial and omni-directional coordination of various regulatory mechanisms. In concert, these regulatory mechanisms may positively or negatively regulate the abundance, function, or localization of protein in a cell.
21
Figure 1.2 Adjustment of RPF alignment position. Metagene profile of raw, and P-site adjusted ribosome profiling reads proximally aligned to canonical AUG translation initiation start sites. The shaded region in the plots represents the canonical coding sequence regions of the metagene profile. A) The raw aligned position of RPFs, often reported as the 5’ end of the aligned read to the reference, does not account for its physical position inside of the ribosome it was once protected by. Therefore, raw read coverage of RPFs is enriched upstream of the annotated meta- translation initiation start site of protein-coding genes. B) Following P-site adjustment of the reported RPF alignment positions, the meta-coverage of ribosome profiling reads on protein-coding genes is enriched over the annotated position of translation initiation (denoted as +0).
22
CHAPTER 2
Spectral profiling of uORF translation in non-differentiated and differentiated neuroblastoma cells
Modified from: Chun, S.Y.*, Rodriguez, C.M.*, Todd, P.K. and Mills, R.E. (2016) SPECtre: a spectral coherence-based classifier of actively translated transcripts from ribosome profiling sequence data. BMC Bioinformatics 17(482). DOI: 10.1186/s12859-016-1355-4
The work presented in this chapter of the dissertation was published in BMC Bioinformatics. Prior to its publication, several other algorithms were published, including those that leveraged the tri-nucleotide periodicity of ribosome profiling alignments. Thus, multiple groups were interested in using similar ideas to identify regions of active translation using ribosome profiling sequence data, demonstrating the utility in measuring this phenomenon. Since its publication, this work has been cited a total of five times in the past year, further demonstrating the utility of this approach. Although this work is now published, much of its development was done concurrent to the work presented in the following chapter. Dr. Todd and Ms. Rodriguez provided experimental support, and Ms. Rodriguez generated preliminary ribosome profiling sequence libraries. Dr. Mills guided the computational approach, and I developed and implemented the coherence algorithm.
2.1 Introduction
Ribosome profiling is a next-generation sequencing strategy that enriches for ribosome-protected mRNA footprints indicative of active protein translation [85]. Fragments of mRNA bound by ribosomal complexes are selected for by enzymatic digestion, isolated using a sucrose cushion or gradient, released from their occupying ribosome, size selected by gel electrophoresis, and then sequenced. Thus, sequencing and analysis of ribosome protected fragments of mRNA enables profiling of the translational content of a sample on a transcriptome wide level.
23
Various algorithms have been developed to differentiate protein coding and non-coding transcripts in ribosome profiling sequence data using fragment length distribution differences and read frame enrichment of aligned reads,[95,99] However, classification based on extreme outlier analysis of fragment length organization similarity score differences are agnostic to the ribosome protected fragment abundance over a transcript. Furthermore, classification based on read frame alignment enrichment (ORFscore) is optimized for canonical open reading frame usage only. In addition, neither of the algorithms described above are available as standalone packages and must be implemented by the user. Published more recently, RiboTaper utilizes a coherence based approach to detect actively translated transcripts from the alignment of ribosome protected fragments; however, the RiboTaper algorithm requires matched ribosome profiling and mRNA sequence libraries and can take multiple days to analyze a single sample.[100]
Here we introduce SPECtre, a classification algorithm based on spectral coherence to identify regions of active translation with high sensitivity and specificity using aligned ribosome profiling sequence reads without the requirement of a matched mRNA sequence library (Figure 2.1 a). SPECtre leverages a key feature of ribosome profiling where sequence reads aligned to a reference transcriptome will track the tri-nucleotide periodicity characteristic of transcripts as they are translated by ribosomes, and reports both significant signals of translation as well as windowed periodicity scores for visualizing results within a genomic context. Options to change the size of windows analyzed, the step size between adjacent windows, false discovery rate, abundance cutoffs to define actively translated versus untranslated score distributions, and parameters to optimize runtime performance are provided to the user to customize. Implementations of FLOSS and ORFscore are included with SPECtre for comparative purposes.
24
2.2 Implementation
In contrast to non-coding transcripts, ribosome profiling fragments aligned to protein coding transcripts are characterized by a tri-nucleotide periodic signal as ribosome bound mRNAs are translated into protein in a codon dependent manner (Figure 2.1 b). Thus, coding transcripts may be differentiated from non-coding transcripts by the presence or absence of a strong tri-nucleotide periodic signal. To measure the strength of this tri-nucleotide signal, we calculate the spectral coherence over sliding N nucleotide length windows across a transcript (see also Appendix B for Supplemental Materials and Methods).[103] Spectral coherence is a measurement of the power relationship between two signals over the frequency domain, such that two signals with shared frequencies will have high coherence, whereas wo unrelated signals will be of low coherence. The SPECtre score, based on a modified Welch’s spectral density estimate of overlapping windows, is calculated for each transcript from a user provided transcript annotation database.[104]
For a given transcript with coordinates defined by the set C, the A- or P-site adjusted read positions overlapping those coordinates are extracted from a BAM alignment file. The coverage over each coordinate in the set is summed, then normalized to the position with the highest coverage, such that all coordinate positions defined by the set C range from zero (no coverage) to one (highest coverage). The default SPECtre score is calculated as the average (Welch’s) coherence over N
nucleotide sliding windows across a normalized coverage region against an idealized trinucleotide control signal of the same length. Therefore, the SPECtre score across a normalized coverage
25
region R, with coordinates C, against an idealized trinucleotide periodic signal S with frequency j, over adjacent N nucleotide windows is given by:
(1) 𝑆𝑝𝑒𝑐𝑅𝑆,𝑗 = 1 𝑀 ∑ 𝐶𝑜ℎ𝑅𝑚,𝑚+𝑁𝑆𝑁,𝑗 𝑀 𝑚=1 𝑓𝑜𝑟 𝑎𝑙𝑙 𝑚 + 𝑁 ∈ 𝐶
Alternatively, the number of sliding windows (Wn) over the coordinate set C, may be modified
based on the step size between each window. Therefore, given a coordinate set C, and step size of
L:
(2)
𝑊𝑛 = 𝐶𝐿𝑛, 𝑓𝑜𝑟 𝑛 ≥ 1 𝑎𝑛𝑑 𝐿 ≥ 1
Therefore, the default SPECtre score of a normalized coverage region R, at frequency j of an idealized trinucleotide signal S, over N nucleotide sliding windows with a step size of L, is given by the equation: (3) 𝑆𝑝𝑒𝑐𝑅𝑆,𝑗 = 1 𝑀 ∑ 𝐶𝑜ℎ𝑅𝑚,𝑚+𝑁𝑆𝑁,𝑗 𝑀 𝑚=1 𝑓𝑜𝑟 𝑎𝑙𝑙 𝑚 ∈ 𝑊𝑛 𝑎𝑛𝑑 𝑎𝑙𝑙 𝑚 + 𝑁 ∈ 𝐶
Distributions of these scores are generated using a user-defined fragments per kilobase per million reads cutoff to differentiate transcripts under active translation from those that are not; these distributions are then used to derive a minimum SPECtre score threshold for active translation given a pre-determined false discovery rate, as well as the posterior probability that a given transcript or region is actively translated.[105]
26
Ribosome profiling libraries treated with cycloheximide typically isolate RPFs of 28 to 30 nucleotides in length; these fragments align with high fidelity to protein-coding regions. However, in the absence of cycloheximide, conformational changes in the ribosomal complex enrich for a shorter range of RPFs that also map with high fidelity to protein-coding regions.[92] Enrichment of these shorter-range fragments may obscure the trinucleotide signal profiled by coherence-based classifiers, like SPECtre, and may under-estimate the number of actively translated ORFs. We simulated increasing variance of RPF lengths outside of the expected enrichment of 28-30 nt length fragments through a biased sampling of reads aligned to the housekeeping gene ACTB. With increased bias, the RPF length distribution is no longer enriched in fragments of 28-30 nt in length, but instead progressively resembles a uniform distribution (Supplemental Figure A.1). Biased re-sampling of 10,000 out of over 500,000 P-site adjusted reads aligned to ACTB was performed over 10,000 trials, and in each trial the sampled reads were converted into normalized coverage, then scored by SPECtre. Using an extreme outlier cutoff, this biased re-sampling analysis suggests that SPECtre scoring remains robust under increased variance in sequence library fragmentation (Supplemental Figures A.1 and A.2).
2.3 Results
We assessed the sensitivity and specificity of each classification algorithm using recently published ribosome profiling and mRNA-Seq data derived from HEK293 cells.[100] For the comparative analysis of each classification algorithm in the HEK293 ribosome profiling library,
27
RiboTaper (version 1.3) was run against published read alignments using the included GENCODE (v19) transcript annotation database.[106] The highest scoring RiboTaper ORFs were extracted from the orfs_found results file using the transcript identifiers and scoring method from the
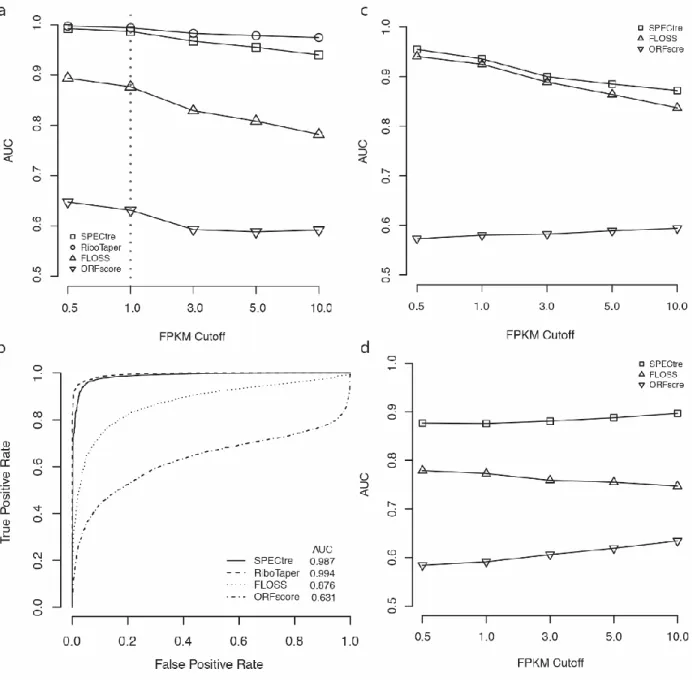
ORFs_max output. These ORFs were then scored by SPECtre (using default parameters), FLOSS and ORFscore, and the relative performance of each algorithm was assessed by receiver operating characteristic analysis. Previous work has benchmarked classifier performance using a series of transcript FPKM cutoffs or other coverage based metrics [95,99,100]. Therefore, ROC analyses were performed using a series of ORF abundance cutoffs based on FPKM to differentiate those under active translation from those that are not. In this manner, we are able to assess the ability of each approach to identify ORFs with signatures of active translation in the interrogated cell type. We performed ROC analyses and calculated the AUC over pre-defined RPF abundance cutoffs (0.5, 1.0, 3.0, 5.0 and 10.0 FPKM) to assess the relative performance of each classification algorithm to accurately define regions of active translation. In HEK293 cells, SPECtre conforms with high fidelity to RiboTaper classification and outperforms both FLOSS and ORFscore to identify actively translated ORFs (Figure 2.2 a and b).
We also used previously published ribosome profiling data derived from mouse embryonic stem cells and zebrafish embryos to assess the performance of SPECtre, FLOSS and ORFscore in the absence of mRNA-Seq data (Supplemental Table A.1); RiboTaper was excluded from these analyses due to its requirement of matched mRNA-Seq data. Ribosome profiling sequence reads from each set were aligned to the mouse or zebrafish reference genome and transcriptome, respectively. Antisense, overlapping and neighboring protein coding and non-coding transcripts were removed from the analysis using methods described previously [95]. The FLOSS, ORFscore
28
and SPECtre metrics were calculated for each remaining transcript and ROC analyses were carried out as described above. SPECtre remains robust in its classification of actively translated transcripts in the standalone mESC ribosome profiling library (Figure 2.2 c and Supplemental Table A.2), and exhibits a marked improvement in accuracy in a meta-analysis of ribosome profiling libraries derived from zebrafish embryos (Figure 2.2 d).
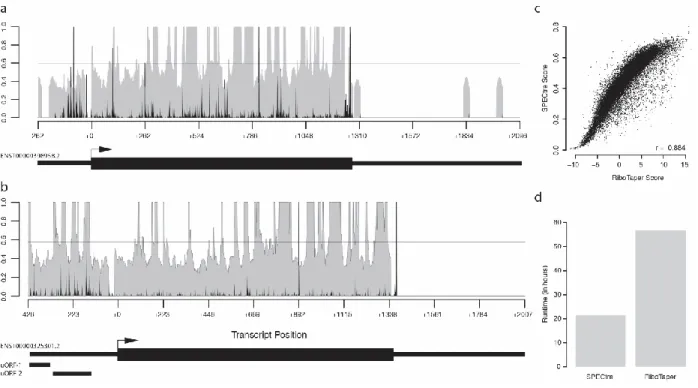
A unique feature of SPECtre is its ability to report and visualize signals of periodicity in the context of surrounding genomic features. Graphical output from SPECtre analysis is shown for two representative transcripts (Figure 2.3 a and b). A condensed transcript profile of RCC1-201 (ENST0000398598) is show in Figure 2.3(a) with the 5’UTR and 3’UTR depicted by the narrow black lines, and the CDS region depicted with the thicker black line. In gray is the normalized P-site adjusted read coverage over the transcript, with the posterior probability calculated by SPECtre denoted by the black line. The dashed horizontal line represents the translational threshold calculated by SPECtre at a false discovery rate of 0.05. In addition to the transcript structure depicted in Figure 2.3(b) are two upstream open reading frames detected by separately by RiboTaper (asterisked black bars) in the MIEF1 (ENST0000325301) transcript. Although the 5’UTRs of both RCC1201 and MIEF1 are profiled by RPF coverage, SPECtre analysis identifies only the uORFs in the 5’UTR of MIEF1, also identified previously by RiboTaper, with a trinucleotide signal of sufficient strength to be indicative of translational potential.[100]
A further analysis of these and other ORFs assessed by both SPECtre and RiboTaper show a very high degree of score consistency between the two algorithms (Figure 2.3 c) in addition to their
29
comparable overall accuracy. However, SPECtre has been designed to be fast and efficient and exhibits a runtime almost one third of that required by RiboTaper (Figure 2.3 d) without requiring RNASeq data. This is achieved through SPECtre’s ability to chunk experiments and parallelize analyses over multiple threads, depending on available computational resources, which enables this exceedingly fast runtime relative to existing methods and decreases the computational barrier between library alignment to application and validation. For these experiments, SPECtre analysis was split by chromosome and run using 8 processors, with 32 gigabytes of RAM allocated; RiboTaper was run with default parameters, using 8 processors and 64 gigabytes of RAM. Both SPECtre, and RiboTaper were run on a high-performance computing cluster running Red Hat Enterprise Linux version 6.4 (Santiago). For installation simplicity and application efficiency, SPECtre has been written in Python with minimal third-party dependencies; the only non-standard Python libraries required for SPECtre analysis are RPy2, NumPy, HTSeq, SAMTools, PyFASTA, PySAM, and the R package ROCR.
2.4 Conclusions
SPECtre is a flexible, lightweight, command line driven analytical package that identifies regions of active translation through modeling of the tri-nucleotide periodicity characteristic of translation by ribosomes, and does so with high fidelity to a recently published method that relies on a similar coherence based approach. SPECtre classification also outperforms prevailing algorithms based on fragment length distribution profiling and reading frame occupancy enrichment. SPECtre is robust across ribosome profiling libraries derived from multiple organisms and cell types, even in
30
the absence of matching mRNA-Seq data, and is capable of identifying active translation in regions previously thought to be non-coding. Furthermore, SPECtre is under continuous development to optimize compute run time and memory overhead in order to facilitate the efficient and accurate investigation of translational dynamics through ribosome profiling sequence analysis.
31
Figure 2.1 SPECtre pipeline and tri-nucleotide periodicity a) SPECtre analytical pipeline, input files, formats and outputs. b) Ribosome profiling read coverage averaged over annotated protein coding transcripts demonstrates a tri-nucleotide periodic signal characteristic of translation by ribosomes.
32
Figure 2.2 Comparative analysis of SPECtre against previously published methods. a) Performance of SPECtre, RiboTaper, FLOSS and ORFscore classification of ORF translation at various PRF abundance cutoffs as measured by AUC in ribosome profiling of HEK293 cells.[100] b) ROC curves of SPECtre, RiboTaper, FLOSS, and ORFscore at a cutoff of 1.0 FPKM. c) Performance of SPECtre, FLOSS, and ORFscore classification of ORF translation in ribosome profiling of mESC at various RPF abundance cutoffs as measured by AUC.[95] d) Performance of SPECtre, FLOSS, and ORFscore classification of ORF translation in a meta-analysis of ribosome profiling in zebrafish over various RPF abundance cutoffs as measure by AUC.[99] All
33
SPECtre analyses were based on 30 nt sliding windows, using a step size of three between each window.
34
Figure 2.3 Examples of SPECtre results and runtime comparison to RiboTaper. a) SPECtre posterior probability profile (shaded gray) and normalized P-site adjusted read coverage (black bars) over the transcript structure of RCC1-201. Solid, horizontal black line represents the translational threshold as calculated by SPECtre at a false discovery rate of 0.05. Arrow indicates position of annotated translational start site. Thin black boxes (left to right) denote the 5’UTR and 3’UTR, respectively, with CDS (thick black box) in between. b) SPECtre posterior probability profile (as above) over the transcript structure of MIEF1. Thin, black boxes under transcript structure denote two uORFs previously identified by RiboTaper analysis. c) Scatter plot of SPECtre and log2(RiboTaper) scores over assessed ORFs. d) Comparison of SPECtre (left) and RiboTaper (right) total compute time, in hours.
35
CHAPTER 3
Translational profiling of uORFs in a cellular model of neuronal differentiation
Modified from manuscript in preparation: Rodriguez, C.M.*, Chun, S.Y.*, Mills, R.E. and Todd, P.K. (2017) Translational profiling of uORFs in a cellular model of neuronal differentiation.
The work presented in this chapter has been modified from a manuscript in preparation. The project context, design and scope were conceived by Dr. Todd, and Ms. Rodriguez. Ms. Rodriguez grew and differentiated the SH-SY5Y cells, prepared the sequencing libraries, and performed the biological validation experiments. Dr. Mills directed the computational approach and analyses, and I developed the uORF prediction pipeline, processed the data, and led the bioinformatics analyses.
3.2 Introduction
The development of massively parallel next-generation sequencing and application of robust analytical methods have empowered the quantitative characterization of the gene expression changes that underlie phenotypic diversity and cellular function. Corresponding advancements in mass spectrometry and peptide identification algorithms have made it possible to track gene expression from the transcriptome through the proteome.[84] However, critical differences in sampling, scale, and search methodologies makes linear comparison across the two platforms imperfect.[107] Furthermore, we have increasingly come to understand the complex regulatory network of interactions and changes that makes comprehensive profiling of the genome, transcriptome and proteome elusive. Although components of this underlying regulatory network may be inferred from evaluating changes in transcript abundance, translational profiling may