Worcester Polytechnic Institute
Digital WPI
Masters Theses (All Theses, All Years) Electronic Theses and Dissertations
2013-04-19
An Empirical Evaluation of Student Learning by the
Use of a Computer Adaptive System
Corey T. Belhumeur
Worcester Polytechnic Institute
Follow this and additional works at:https://digitalcommons.wpi.edu/etd-theses
This thesis is brought to you for free and open access byDigital WPI. It has been accepted for inclusion in Masters Theses (All Theses, All Years) by an authorized administrator of Digital WPI. For more information, please [email protected].
Repository Citation
Belhumeur, Corey T., "An Empirical Evaluation of Student Learning by the Use of a Computer Adaptive System" (2013).Masters Theses (All Theses, All Years). 223.
An Empirical Evaluation of Student Learning
by the Use of a Computer Adaptive System
By
Corey Belhumeur
A Thesis
Submitted to the Faculty of
WORCESTER POLYTECHNIC INSTITUTE In partial fulfillment of the requirements for the
Degree of Master of Science In
Computer Science April, 2013
APPROVED:
____________________________________________________ Professor Neil Heffernan, Major Advisor
____________________________________________________ Professor Kathi Fisler, Thesis Reader
____________________________________________________ Professor Craig Wills, Head of CS Department
2
Abstract
Numerous methods to assess student knowledge are present throughout every step of a students’ education. Skill-based assessments include homework, quizzes and tests while curriculum exams comprise of the SAT and GRE. The latter assessments provide an indication as to how well a student has retained a learned national curriculum however they are unable to identify how well a student performs at a fine grain skill level. The former assessments hone in on a specific skill or set of skills, however, they require an excessive amount of time to collect curriculum-wide data. We’ve developed a system that assesses students at a fine grain level in order to identify non-mastered skills within each student’s zone of proximal development.
“PLACEments” is a graph-driven computer adaptive test which not only provides thorough student feedback to educators but also delivers a personalized remediation plan to each student based on his or her identified non-mastered skills. As opposed to predicting state test scores, PLACEments objective is to personalize learning for students and encourage teachers to employ formative assessment techniques in the classroom. We have conducted a randomized controlled study to evaluate the learning value PLACEments provides in comparison to traditional methods of targeted skill mastery and retention.
3
Acknowledgements
For the establishment of PLACEments, I would like to thank Skyler Whorton (MS, WPI) for his work on the design and development of the test algorithm, design advice throughout the course of the project and management of the experimentation. I would also like to thank Doran Smestad (BS, WPI) and Andrew Burnett (ASSISTments advisor) for their contributions towards the design of PLACEments. For his work on the PLACEments reports and soon-to-be guardianship of the PLACEments project, I would like to thank Seth Adjei (Ph.D. Candidate, WPI).
I would also like to thank David Magid (Project manager, WPI) and Joshua Bodah (MS, WPI) for their expertise and design contributions that helped successfully incorporate PLACEments into the ASSISTments infrastructure. Additionally. I would like to thank the Tutor Research Group (TRG) at WPI for their work and dedication to the ASSISTments project.
For their creation of ASSISTments and ongoing management of the project, I would like to thank Prof. Neil Heffernan (WPI) and Cristina Heffernan. They were both heavily involved in the research and experimentation of PLACEments, as well as a key resource in providing the necessary materials and skill content needed to make the project a success.
I would also like to thank Kim Kelly (Ph.D. Candidate, WPI), Barbara Delaney (Bellingham, MA), Janine Ohnemus (Bellingham, MA) and Jeffrey Grupposo (Bellingham, MA), whose students took part in the PLACEments experimentation. Without their time and feedback, we would not have been able to have such a well-tuned and successful experiment.
Funding for this research was provided primarily by the National Science Foundation’s GK-12 program, under the Partnership In Math and Science Education (PIMSE) grant, for which I served as a fellow. Additional sources of funding include the Department of Education, the Office of Naval Research, the Bill and Melinda Gates Foundation and the Spencer Foundation.
4
Contents
Abstract ... 2 Acknowledgements ... 3 Contents ... 4 Tables ... 5 Figures ... 5 Introduction ... 6Research and Design ... 10
ITS Ecosystem ... 16
Experimental Design ... 20
Results ... 26
Discussion ... 31
Conclusion and Future Work ... 33
5
Tables
Table 1: Study Schedule ... 23
Table 2: Southbridge Middle School experiment results ... 26
Table 3: Bellingham Memorial Middle School (Group 1) experiment results ... 27
Table 4: Bellingham Memorial Middle School (Group 2) experiment results ... 28
Table 5: Complete experiment results ... 29
Table 6: Split Prerequisite Graph study schedule ... 34
Figures
Figure 1: Excerpt from MAP’s RIT Score analysis for mathematics ... 7Figure 2: Snippet from Jason Zimba’s Common Core State Standards Prerequisite Graph ... 9
Figure 3: Snippet from WPI Fine Grain Skill Prerequisite Graph ... 11
Figure 4: PLACEments Remediation Report ... 13
Figure 5: Vygotsky’s Zone of Proximal Development ... 16
Figure 6: The Andes Tutor ... 17
Figure 7: Remediation Assignments available to a student ... 20
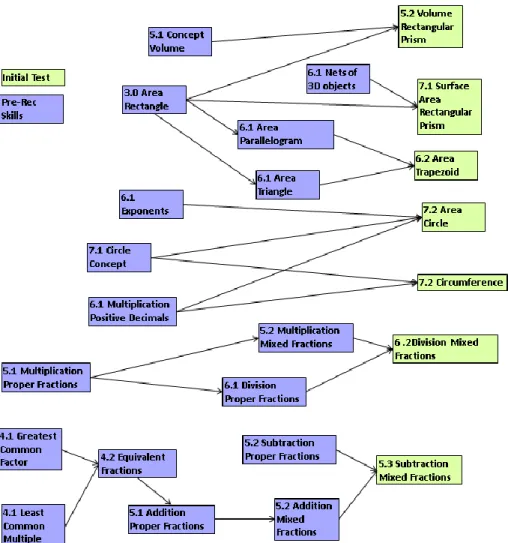
Figure 8: Prerequisite Graph used for experiment ... 22
Figure 9: Scaffolding questions in ASSISTments ... 24
Figure 10: Hints in ASSISTments ... 25
Figure 11: PLACEments Split Prerequisite Graph ... 33
Figure 12: PLACEments Report Info Graphic ... 35
6
Introduction
Stemming from the desire to bring diverse state curricula into alignment with one another, the U.S. educational community set out to standardize current state testing techniques. Sponsored by the National Governors Association (NGA) and Council of Chief State School Officers
(CCSSO), the Common Core State Standards Initiative was derived and is currently adopted by most U.S. states [6]. Over the past twenty years, which has come to be dubbed as the
“Accountability Movement”, states have been held accountable for testing student mastery and achievement in order to demonstrate their students’ capability to achieve success in the United States. Although states mandatorily tested students on their abilities throughout the K-12 spread, there was never a way by which data between states could be compared [13]. In order to
standardize graduation requirements, strengthen accountability, and overall, increase assessment capability, the Common Core State Standards (CCSS) were born. Designed to be robust and relevant in today’s world, the CCSS provide a dependable and clear understanding of what students are projected to learn [6]. Committed to by forty-five states, the CCSS assessments will begin to be administered in the 2014-2015 school year, however, they will not be using a
common test [6].
Two assessment consortiums, Partnership for Assessment of Readiness for College and Careers (PARCC) and SMARTER Balanced, have emerged from the Common Core movement. At first, having two separate assessments may sound counterintuitive however, due to the untested nature of the CCSS across state boundaries, multiple consortiums could be beneficial. Although
different, both PARCC and SMARTER Balanced have taken similar, innovative approaches to assessing students. Both assessments will be taken on computers for students between third and eleventh grade on a variety of selected response, open response, and complex performance questions [6]. Although both will be provided on computers, the delivery of questions is an important difference. Students taking PARCC will receive a fixed set of questions based on one of several equated tests [1]. On the other hand, students taking SMARTER Balanced will get an adaptive test which tailors questions based on their responses [16]. The latter delivery of
7
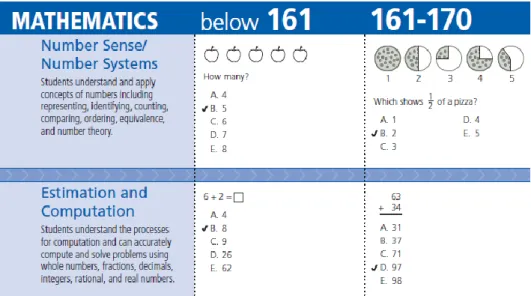
FIGURE 1: EXCERPT FROM MAP’S RIT SCORE ANALYSIS FOR MATHEMATICS
Computer adaptive tests, which are both well understood and in widespread use, have become a larger part of standardized testing in recent years. MAP (Measures of Academic Progress) tests adjust question difficulty in real time in an effort to test at the academic level of the student, not the grade level the student is assumed to be at [11]. The GRE (Graduate Record Examination) uses the same style of testing such that as students get questions wrong, they will receive easier questions. Likewise, as students get questions correct, harder questions will be provided. This continues until the confidence interval on the estimate of student knowledge has been reduced to a minimal value. The psychometrics behind these types of assessments is also well understood making computer adaptive testing a viable platform to track learning progress [16]. The problem using these tests, such as MAP, is not that they fail to provide good assessment value but that they are being used out of context as formative assessment systems. Many providers of computer adaptive tests sell themselves as formative assessment systems yet do very little to help teachers do something differently in the classroom.
Assessment systems such as MAP have the potential to help individual students but they are being sold in a context that they are not geared to provide. Systems which allow a district to assess students four times a year and provide a number as the students’ growth metric have the potential to help students progress as well as offer teachers and superintendents with teacher aggregated data (to help evaluate teacher impact on a class). MAP excels at predicting state test scores and was employed in several states to serve such a purpose. However, MAP’s RIT score,
the number it delivers per student per strand, does not directly identify what a student does and does not know [11]. Instead, the number can be related to a difficultly level and set of categories that
8
the academic level of the student [11]. MAP’s data is difficult to act upon given the uncertainty of its semantics. By definition, formative assessment allows for measures to be employed by teachers during the learning process, such as modifying teaching and learning activities, in order to improve student learning and retention [5]. Unless MAP’s data can be used to easily and efficiently influence classroom instruction, it is difficult to classify it as a formative assessment system. Teachers are given a substantial amount of professional development to help utilize MAP’s data proficiently however MAP was simply never built to serve the purpose of a formative assessment system. Our goal is to use computer adaptive testing and focus it to perform formative assessment rather than attempting to do longitudinal tracking and the prediction of state test scores.
Our research has been focused on developing a computer adaptive test which excels in formative assessment as opposed to the ability to predict state test scores. We acknowledge and purposely lack the capability to make a state score prediction as it is our goal instead to seek the benefit in being able to tell individual students which skills they have mastered. To accomplish this feat, we have taken advantage of the years of research that have been put into the practicality of learning progressions [9]. A learning progression is simply the trail that students travel as they progress toward mastery of the pieces of knowledge understood to be essential for college and career readiness. These pieces of knowledge, for which we will often use the term skill, can also be strategies as well as declarative bits of information. Our research is based in mathematics and as such, it is easier to imagine the learning progression as a prerequisite graph. These graphs contain a set of nodes, or skills, and a set of edges describing the relationship between the nodes. It is the edges which explain the notion of how one skill is a prerequisite for another. We openly acknowledge though that the use of a prerequisite graph may not be as appropriate in other domains. Our research led us to find out how a learning progression-driven computer adaptive test could increase student learning and retention.
This study’s goal is to see how we can repurpose computer adaptive testing to become a
formative assessment system. Fortunately, due to the large amount of research being poured into learning progressions (especially in mathematics), our goal is easily within sight. Jason Zimba, the founding principal of Student Achievement Partners (SAP), is not only the lead writer on the Common Core mathematics standards, but also the creator of the CCSS prerequisite graph [6].
9
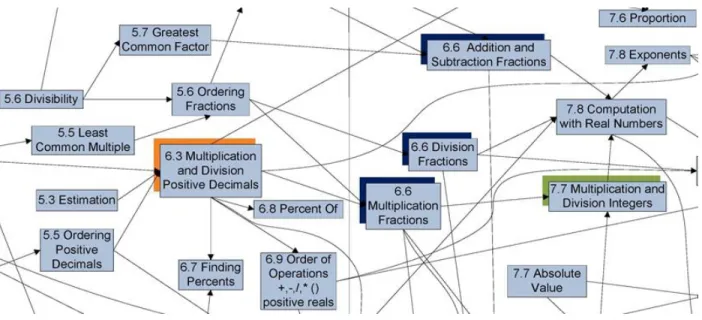
FIGURE 2: SNIPPET FROM JASON ZIMBA’S COMMON CORE STATE STANDARDS PREREQUISITE GRAPH
Understanding the progression of learning that occurs between the CCSS skills, Zimba designed a graph which illustrates student advancement through the curriculum both within and between grade levels [9]. Given such an influential learning progression derived directly from the CCSS, we worked to develop an algorithm that traverses the graph
starting at a preset grade level and attempts to identify which skills a student does or does not know. As students answer skills incorrectly, they will move backwards on the prerequisite chain in order to detect non-mastered prerequisite skills. Likewise, as student answer skills correctly, they will move forward in time so as to test their understanding of post-requisite skills. By allowing the test to directly navigate the prerequisite graph, each student’s answers precisely pinpoint which skills the student does and does not know. With this data in hand, we
automatically remediate students on their skills we have detected to be non-mastered, as well as publish this data through a series of reports to allow teachers to modify their instruction and learning activities. Our graph-driven computer adaptive test, supported by the detailed teacher reports and student intervention system, provides the infrastructure necessary to be a formative assessment system.
10
Research and Design
In order to produce our computer adaptive test, we decided to build upon a system which already supported similar features. ASSISTments is an Intelligent Tutoring System whose name comes from the combination of the words “Assistance” and “Assessment”. It delivers assistance to students by providing immediate feedback in the form of hints and step-by-step explanations. ASSISTments also provides assessment through the wide variety of reports available detailing individualized student performance as well as overall learning trends for a grouping of students. With instant feedback at their fingertips, teachers using ASSISTments are able to formatively assess their students by modifying their teaching strategies.
ASSISTments is currently used by educators and students in all levels of academia and is commonly considered to be an effective educational tool. Part of its effectiveness is due to the way ASSISTments complements the traditional classroom. By removing tedious tasks such as grading and allowing teachers to focus on student performance and understanding, teachers are able to drive their lessons using the collected data. If a teacher is further inclined to do so, they also have the ability to assign skill builders, or a set of questions focused on a specific skill, as a way to provide each student with targeted practice. As good of an intention as this is, skill builders are mistakenly assigned in droves and their effectiveness is severely degraded. ASSISTments therefore provides a medium by which teachers can data drive in the classroom but it lacks the infrastructure needed to focus on the personalization of learning. By
acknowledging the complications of keeping a detailed record of each student’s ability, we explored the ability to create a system which automates many of these time consuming tasks. Driven by the power of a computer adaptive test, our research led to a system that optimizes ASSISTments ability as a formative assessment system.
The product or our research, known as PLACEments, is a computer adaptive test that attempts to determine a students’ understanding of curriculum skills and further provides data reports to teachers and individualized remediation to students. Before assigning a PLACEments test, teachers are presented with various options to fine tune how the test based on the level of their students. Since the answers presented to students are determined by the prerequisite graph that is used, teachers are able to currently select from Zimba’s CCSS graph or use the WPI fine grain
11
FIGURE 3: SNIPPET FROM WPI FINE GRAIN SKILL PREREQUISITE GRAPH
skill graph, which is an interpretation of the former [9]. Since each graph covers skills through a series of grade levels, teachers must also provide the grade level to start at, as well as how far to navigate backwards through a prerequisite chain. Given a set of parameters, teachers begin by assigning a PLACEments test to students in ASSISTments.
Upon starting the test, PLACEments uses the starting grade level provided by the teacher to generate a list of skills that will be initially tested. Students are then presented with questions pertaining to each of these skills in a linear fashion. As students answer the questions, we build up additional queues of skills to be tested, namely prerequisite and post-requisite skills. In order to make the most effective use of time, every prerequisite chain must be either satisfied (a student gets a question correct and thus we no longer need to check any further prerequisites on that chain) or bottomed out before any post-requisite skills are tested. While students are answering questions, they will only receive one question per skill. Although our confidence interval is quite wide by only asking one question, our goal is only to identify potential skill weaknesses. Since we are not predicting state test scores, neglecting to retest skills does not have adverse effects. The result of a simple math mistake will only lead to additional practice for a student, which in most cases serves as skill reinforcement. Once a student had completed a test, PLACEments will generate a personalized learning plan for each student.
12
At the completion of a test, PLACEments will automatically deliver an individualized learning plan for each student in the form of targeted skill-based assignments. For each skill identified as a non-mastered skill, we automatically generate a remediation assignment for the students to complete. Each of these assignments is in the form of a skill builder which is a special
parameterized assignment. Students are generally allowed up to ten problems a day per skill and must answer three questions correctly in a row to show mastery. In order to ensure that students never receive assignments for which they have not mastered the prerequisites skills, we have developed an algorithm which assigns the skill builders using the prerequisite graph from the test. After generating all of the assignments that will be given to the student, we check to see which of these assignments are not blocked by any other assignments. Each assignment, which the student has proven to understand all its prerequisite skills, will be initially available for the student to start. Upon the completion of an assignment, the algorithm goes through a similar process; we first identify any post-requisite assignments available and then for each of the identified assignments, we check to see if there are any incomplete prerequisite assignments. This ensures that we never accidentally allow students to start assignments that we have detected they have not mastered all the prerequisites for. To complement the test and personalized
learning plan for students, we also offer teachers access to the data being collected.
To be a true formative assessment feature, PLACEments will also include a variety of reports to help teachers identify trends and issues among their students. One of the projected and most influential reports identifies trends between PLACEments tests. We are able to identify with confidence which skills the student has improved on (if the student answered incorrectly on the first test however answered correctly on the next test), as well as which skills the student has regressed on. We are also able to recognize when a student is proficient at a skill (such as if the student has continually shown mastery on the skill) in addition to which skills a student needs improvement on.
In order to view proficiency information at a more fine grain level, we also supply a report which breaks down skill mastery by class, section, and student level. Aggregated by class (which is a collection of sections of students), teachers are able to view the percentage of correctness (how many students have mastered the skill) as well as the actual number of students this
13
FIGURE 4: PLACEMENTS REMEDIATION REPORT
only two students have seen (1 correct and 1 incorrect = 1/2 = 50%) versus a skill which has been seen by forty students (20 correct and 20 incorrect = 20/40 = 50%). Breaking the data down into a more fine grain level, we can view the same results for each section of students (sections are traditionally a period; ~10-30 students for an hour long duration). Each section will show the correctness percentage and number of students as well as have the class data also available in the report for comparison. In the student report, each student’s mastery per skill will be available. This data is useful for teachers to identify the skills that each student has not mastered, as well as how they rank in contrast to the rest of the class.
As for the personalized assignments given to students at the end of a test, we have designed reports to similarly disclose this data. Along the same lines as the assignment and item reports in ASSISTments, teachers will have the ability to view each assignment’s total progress, as well as how the student performed per question. In order to monitor the progress of the assignments in general, we will have a report which allows teachers to see how many each student received from PLACEments, as well as how many they have completed. Given the abundance of data between the test and assignments, PLACEments offers a unique way for teachers to hone in on each of their students weaknesses and change their learning activities for the benefit of the class.
As effective as the use of PLACEments can be in the classroom, there are some limitations and considerations that must be taken into account. PLACEments will only be as effective as the prerequisite graph’s effectiveness in a school [19]. Since the adaptability relies solely on the graph that is given, if the prerequisite graph does not cover the material that students are
14
graph is. The given graph must also dig deep enough into the curriculum to identify an underlying weakness in the student’s knowledge [19]. Lack of prerequisite skills for a given question will prevent PLACEments from providing teachers with the fine graininess needed to help students grasp non-mastered skills. Given a proven or well-tested prerequisite graph such as the CCSS graph, PLACEments is able to deliver information to teacher that can make an impact on student learning.
Similar to the difficulties associated with the identifying an effective prerequisite graph, the other limitation to PLACEments is the content used in both the test and individualized remediation. For each skill in the prerequisite graph, there must be a question associated with it such that if the skill must be tested, PLACEments has a way to evaluate the students’ knowledge. Since the content chosen to represent these skills has not be selected by and expert nor has been proven by empirical evidence (in the experimentation at minimum), it can be argued that the content representing a skill was poorly selected should a student get the question wrong. In a system which predicts state test scores, poorly chosen content immediately nullifies the value of such a test. In the case of PLACEments however, our system is focused on helping students master misunderstood skills, and as such, the lack of qualified questions does not degrade the benefits of using the system. The selection of lesser quality questions may lead to larger amounts of practice which does not decrease a student’s mastery of a skill. As for the information forwarded to teachers in the reports, the data will suggest the teacher help a student with a particular skill which again only leads to more practice.
Similarly for the automatic practice assignments, the impact and effectiveness of the content chosen plays a role in how quickly and efficiently a student will master a given skill.
PLACEments currently uses skill builders for the remediation assignments which have been used by hundreds of teachers and tens of thousands of students. Through teacher input and expert advice, the assignments have become proven practice towards the goal of mastering a particular skill [12]. As such, research suggests that most skill builders provide some benefit to helping students [12].
PLACEments goal is to evaluate and remediate students on a set of standards and further reveal the results of the evaluation to educational experts. By using PLACEments, it is our desire that two things occur; first is that there is a learning benefit to students who use PLACEments.
15
Second follows that teachers are presented information that can help them make a greater impact in the classroom. Through experimentation, it is our hope that students who partake in the test and receive automatic practice will gain some measurement of benefit by following through on the work. Should students take a post-test on the same material tested by PLACEments, we hope to see better performance on a students identified non-mastered skills. It is our hope that the data collected can help teachers make more efficient use of their time as well as feel the cost/benefit analysis of using PLACEments is well worth the time lost. We particularly see teacher’s benefiting from such systems that are not bound by time constraints, such as teachers who manage assisted learning classes. We hope to show that PLACEments can make a positive impact in the traditional classroom.
16
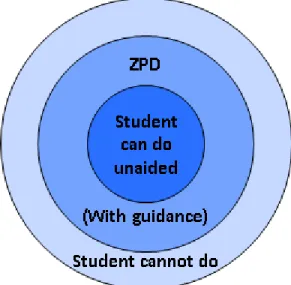
FIGURE 5: VYGOTSKY’S ZONE OF PROXIMAL DEVELOPMENT
The ITS Ecosystem
The goal of using PLACEments is to give teachers the ability to make a difference today. As part of the rapid learning environment schools have created to meet the demand of teaching
additional topics in a minimal amount of time, it is critical that we provide teachers with information that can make an immediate and lasting impact, rather than waste time guessing what a student needs to master. Psychologist Lev Vygotsky developed what he called the Zone of Proximal Development (ZPD) which defines the skills that are in the process of maturing in a student [18]. The point he stressed is that there are functional learning zones in each student; there is the zone for skills which have been mastered, a zone for which skills are in an embryonic state, and the zone of skills which are unable to be learned [18]. For students who have failed to master skills in previous grades, it is likely that they are being taught topics at a level for which their understanding of the prerequisite skills are still in the process of maturing.
PLACEments targets and reveals each student’s zone of proximal development in order to ensure teachers can focus on the skills that will have the most influence on student development. By understanding the variance between what a student can
do on their own and what they need assistance with (the ZPD), individualized support can be provided to help students catch up to the expected level of mastery in the most effective way possible. It is for this reason that the practice PLACEments assigns at the
conclusion of the test must also be chronologically ordered in relation to the prerequisite graph. If post-requisite skills were allowed to be attempted prior to the mastery of the prerequisites, we may in fact be providing help outside of the students learning ability. Vygotsky and other educational professionals believed education's role was to give children
experiences that were within their zones of proximal development, thereby encouraging and advancing their individual learning [18]. By working within each student’s ZPD, teachers can
17
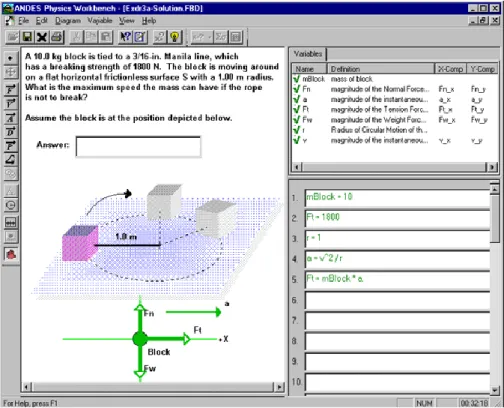
FIGURE 6: THE ANDES TUTOR
make the most effective use of time in the classroom. Besides PLACEments, other systems have been developed to help understand and tackle the task of individualized learning.
Building upon the lessons and understandings of other intelligent tutoring systems (ITS), PLACEments optimization of learning is centered in what an ITS aims to accomplish:
personalized learning. Not only have other ITSs been built to serve individualized education in the last decade but the potential of ITS’ have grown into a multi-billion dollar competition. Understanding how vital and effective these systems have the potential to be, Race to the Top, spurred by the United States Department of Education (and also part of the CCSS movement), was created to stimulate the innovation of ITS’ that successfully serve personalized learning [13]. As a result of school accountability efforts to prioritize the collection, analysis and use of student data, educational reformers and leaders are searching for the formative assessment system that meets their needs [10].Given the known advantages of intelligent tutoring systems operated in unison with traditional teaching methods, PLACEments goal is to use its collected assessment data to drive remediation, disconnecting it from what other ITSs and educational systems do.
To better understand where PLACEments fits in the ITS ecosystem, several remediation-capable systems have been studied. The Andes tutor is an intelligent tutoring system aimed at teaching introductory physics which
exemplifies the
simplicity and influence behind computer aided teaching (CAT). Based from the conclusion of
18
the study, students who used Andes increased their understanding of the subject [2]. One of the interesting turnouts from the experiment was that generally higher student scores were received whether or not extra time spent doing the work over traditional methods [14]. There was no change either in the way teachers conducted their class in order for students to receive the benefits [14]. In a posttest survey, not only did students receive higher scores while using Andes but they preferred the ITS over paper and pencil work [17].
Stat Lady is an ITS aimed at teaching introductory statistics to adult learners. Parallel to the findings from Andes, the empirical results of the study concluded that students in the
experimental group acquired greater procedural skills no matter their aptitude. High-aptitude students were shown to learn more and receive higher grades from Stat Lady, as would be expected from students who may have practiced outside of the ITS, but low-aptitude students also obtained higher scores than from traditional teaching [15]. Aligned with the goals of
PLACEments, Stat Lady individualized the sequence of problems based on each student’s degree of mastery [15].
To point out from another notable ITS, Cognitive Tutor, is the lasting effect of computer aided teaching. Teachers using Cognitive Tutor not only reported spending half as much time
reviewing material in the subsequent semester but also acknowledged that their students were more likely to succeed when enrolling in courses of higher difficulty [7]. Parallel to other ITSs, AnimalWatch, and arithmetic tutor, improved students’ abilities to answer questions correctly without assistance. By providing customized help and feedback, students made fewer mistakes over their learning progression [4]. In both cases, not only did students perform better in the short run but they were also able to surmount courses of greater difficulty post-ITS use.
By design, PLACEments aims to both pinpoint student weaknesses on a skill-based level as well as remediate those skills in a logical order. Like the Andes and Stat Lady tutors, PLACEments intends to complement the traditional classroom setting. The small amount of time necessary to take the test leads to an abundance of information that helps teachers ultimately spend less time reviewing material. Where PLACEments excels in comparison to the above mentioned ITSs is its ability to harness assessment and individualized remediation cohesively. By tightly coupling the way we assess skill weaknesses with the mechanics of individualized feedback,
19
PLACEments is able to collect assessment data that is then used to drive learning, disconnecting it from other educational systems.
In ASSISTments, problem sets that are focused to a single skill, otherwise known as skill
builders, are currently abused in the ASSISTments system. Teachers have previously assigned all the skill builders for their grade level in hopes that the abundance of practice will lead to stronger student understanding. Besides the overwhelming amount of perceived work by students, there’s no efficient way by which students know how to tackle the material. Not only will some skills already be mastered by a student but some skills require prerequisites that the student hasn’t mastered. Illogical for any student to finish, the assignments remain undone, the teachers give up on the practice, and an educationally good intention is lost. PLACEments alleviates these
problems by being intelligent about which skills need to be focused on. Students not only receive remediation in the skills that are directly applicable to their understanding (or within their zone of proximal development) but also receive the practice in chronological order based on the prerequisite graph. With PLACEments in hand, students can focus their effort where it counts and teachers no longer have the burden of selecting individualized feedback.
20
FIGURE 7: REMEDIATION ASSIGNMENTS AVAILABLE TO A STUDENT (9 are currently available to attempt,
14 are post-requisites to the 9 available and thus are not listed)
Experimental Design
We envision PLACEments to work on a two-step cycle where teacher reports and automatic student practice occur after students have taken a PLACEments test. Students begin by taking a PLACEments test to evaluate their understanding of taught skills. As students answer questions, the test automatically records their results and adjusts which skills need to be tested. Assuming a student incorrectly answers a question for a specific skill, the test will automatically test
prerequisite skills to identify potential knowledge weaknesses. By driving the test based on student responses, PLACEments can cover a wide variety of skills in a relatively short amount of time.
Upon the completion of a PLACEments test, teachers will be able to access a breakdown of not only each student’s skill understanding, but the general percentage of understanding for each class and all students combined. For individual students, teachers will be able to view exactly how well that student did per skill and the question that was asked. For each class, teachers will be able to see the percentage of student understanding per skill in comparison to one another as well as for all their students combined. These diagnostics allow teachers to quickly identify individual and class weaknesses and address the issue immediately after taking a test.
To follow up on the data collected, the
remediation aspect of PLACEments will infer student weaknesses and assign targeted material to increase student understanding. Based on each student’s data and the prerequisite graph used, PLACEments assigns individualized content to help increase
21
student skill comprehension. Fortified by PLACEments remediation and their teachers equipped with specialized reports, students are provided with the resources to tackle proximally weak skills with ease and poise.
To create a fair experiment to determine if PLACEments offers a better learning value over traditional classroom methods, we spent a considerable amount of time understanding exactly what the traditional methods are. Inferred from the way ASSISTments is generally used, teachers will assign a skill builder to students which they either perceive as a skill students are weak in or a skill that requires constant practice. This indicates that, traditionally, teachers will give an assignment to students in order to reinforce or aid student learning. We were initially inclined to provide the control group with skill builder assignments however there are two disadvantages. First, skill builders will be provided as the remediation work for the experimental group. Using such similar routines may the study to poorly predict the learning value provided by
PLACEments. Second, it is also the case that skill builders provide tutoring feedback to students which is not included with normal paper and pencil work. Students do not typically have a tutor guiding them through practice work thus skill builders are a poor example of traditional method. Under the assumption that practice work given is not directly assessed (it may however be indirectly assessed through quizzes and tests on other skills), providing a list of websites which focus on explaining the weak skill serves as sufficient practice. Our definition of a traditional classroom method is the assignment of extra practice work which is not directly assessed. Since students can practice the material on these websites and will not be assessed on it at any point, we have chosen this method to represent how students traditionally learn in the classroom. Common to our understanding of how PLACEments will be generally used in the classroom and how students traditionally receive skill practice, we have designed an experiment to determine the learning value of the system. We hypothesize that students who use PLACEments and complete the individualized remediation assignments will perform better on a posttest than students who receive remediation that is general to the whole class. In order to test this theory, we recruited three middle school teachers in Massachusetts with a combined total of 220 students to test the effectiveness of PLACEments. Each teachers’ students were randomly split into two groups, one the control group and the other the experimental group using PLACEments, as our
22
FIGURE 8: PREREQUISITE GRAPH USED FOR EXPERIMENT two conditions. Both groups followed similar routines however they each received a different form of intervention.
For the control group, students began by taking a pretest on seven skills which have been identified as knowledge components learned in the last few months. These skills emulate a standard test that a teacher
would use to evaluate how well students have retained taught material thus far. Students are given an entire class period, about fifty minutes, to complete the seven questions. This test is taken in
ASSISTments as a normal assignment in test mode (students do receive correctness feedback but do not get tutoring feedback). At the end of the test, students will receive a remediation assignment to work on for each question they
answered incorrectly. Each of these assignments
contains several websites that can be visited which provide practice on the identified non-mastered skill; the assignments only contain the website links; none of them include any follow-up assessment questions to determine whether or not the students have mastered the skill. An assignment is considered completed if the student acknowledges they have sufficiently covered the presented skill. We have taken this approach in an attempt to mimic how students would generally master these topics. Since a teacher would normally assign practice on the current
23
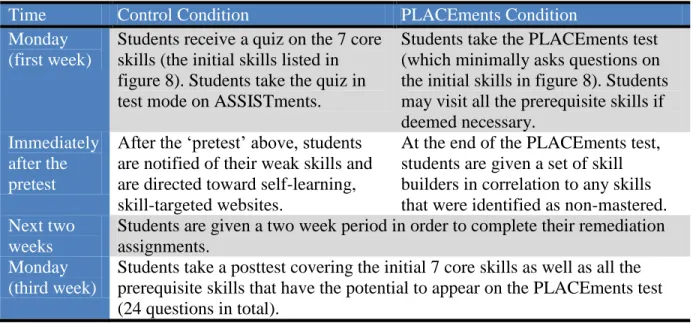
TABLE 1: STUDY SCHEDULE
skills being taught and not the prerequisite skills, the control group receives these websites which imitate a student looking in a book or on the internet for help.
Students are then given two full weeks to practice and master the skills that were assigned to them. Students who received fewer remediation assignments or who completed their work early were assigned general homework by the teacher on the skills currently being taught in class. At the end of the two weeks, the control group was given a posttest covering the original seven skills that were tested as well as an additional seventeen prerequisite skills based on the prerequisite graph used. The point of testing the additional skills is to see whether or not there were non-mastered prerequisite skills that PLACEments would have detected and could have assigned personal remediation for.
For the experimental group, students began by taking the PLACEments computer adaptive test which starts by asking them the same seven initial questions as the control group. In contrast to the control group, if a student gets a question wrong, we queue a question for each of the prerequisite skills associated with the question. Students continue answering questions for a given prerequisite skill chain until they either answer a question correctly or until there are no longer any prerequisite questions left to ask. In total, there are the seven initial questions and seventeen additional prerequisite questions. Students who answer all the questions incorrectly will maximally see twenty four questions total. Like the control group, students will get
Time Control Condition PLACEments Condition
Monday (first week)
Students receive a quiz on the 7 core skills (the initial skills listed in figure 8). Students take the quiz in test mode on ASSISTments.
Students take the PLACEments test (which minimally asks questions on the initial skills in figure 8). Students may visit all the prerequisite skills if deemed necessary.
Immediately after the pretest
After the ‘pretest’ above, students are notified of their weak skills and are directed toward self-learning, skill-targeted websites.
At the end of the PLACEments test, students are given a set of skill builders in correlation to any skills that were identified as non-mastered.
Next two weeks
Students are given a two week period in order to complete their remediation assignments.
Monday (third week)
Students take a posttest covering the initial 7 core skills as well as all the prerequisite skills that have the potential to appear on the PLACEments test (24 questions in total).
24
FIGURE 9: SCAFFOLDING QUESTIONS IN ASSISTMENTS
correctness feedback and will not receive tutoring feedback. At the end of the test, PLACEments will automatically assign a skill builder for each identified non-mastered skill.
The skill builders received by the experimental condition are vastly different than the assignments given to the control group. Instead of receiving several websites to visit, each skill builder assignment poses questions which directly pertain to the non-mastered skill. Each question includes a series of hints, which are small reminders about what the next step should be in solving the question, as well as scaffolding, which presents a parallel step-by-step question for the student to follow. Scaffolding helps a student understand the critical concepts behind a skill without revealing the answer of the originally asked question. In order to obtain mastery of a skill builder assignment, students must answer
three questions correctly in a row. By providing hints and scaffolding to help students master the skill as well as a ‘three-in-a-row’ assessment completion criterion, students in the experiment condition will hopefully have solidified their understanding of their identified weak skills.
25
FIGURE 10: HINTS IN ASSISTMENTS
Analogous to the control condition, students will have two full weeks to complete the remediation assignments given to them. Students who finish their remediation assignments earlier than the two weeks will be given general
homework by the teacher on the skills currently being taught in class. At the end of the two weeks, the experiment
condition will be given the same posttest provided to the control group. From these results, we will be able to see if
PLACEments provides a better learning value to students than traditional methods given to the control group.
26
TABLE 2: SOUTHBRIDGE MIDDLE SCHOOL EXPERIMENT RESULTS
Results
In order to evaluate the learning value of PLACEments, we took a look at how the remediation assignments influenced the posttest scores in relation to the pretest at a broad level. We included metrics such as time spent per problem on the pretest, posttest and each remediation assignment given. For a more fine grain look at the data, we analyzed the impact that the remediation had over a skill and sought to understand if students mastered the prerequisite skills or the core skills more quickly. Overall, our study suggests that the study itself may have been a poor evaluation of the potential benefits tied to the use of PLACEments.
Our first evaluation of PLACEments and student learning consisted of 16 control students and 19 experiment students from Southbridge Middle School. Table 2 provides the base findings for these students:
Averages (per student) Control PLACEments Effect Size P-value
Pretest Core Skills Score 0.161 0.101 -0.314 0.179
Pretest Total Average (all skills) (not tested) 0.204
# of Questions Given 7 (static) 23
Pretest Seconds per Problem 98 sec. 62 sec.
Pretest Total Seconds 980 sec. 1385 sec.
Posttest Core Skills Score 0.353 0.393 0.152 0.600
Posttest Total Score (all skills) 0.252 0.273 0.142 0.636
Posttest Seconds per Problem 74 sec. 60 sec.
Posttest Total Seconds 1779 sec. 1409 sec.
Remediations Assigned 6 18
Remediations Completed 4 5
Remediation Problems Attempted 5 41
Remediation Seconds per Problem 256 sec. 95 sec.
Remediation Total Seconds 976 sec. 3341 sec.
Core Skill Gain (Posttest-Pretest) 0.241 0.286 0.180 0.541
From our initial group of students from Southbridge, the control group performed slightly better than the PLACEments group on the core skills. Students spent less time per question in the
27
TABLE 3: BELLINGHAM MEMORIAL MIDDLE SCHOOL (GROUP 1) EXPERIMENT RESULTS
PLACEments group mostly likely due to the need to answer maximally 24 questions as opposed to the 7 maximal questions seen by the control group. This also explains why the number of total seconds is greater for the PLACEments group.
As for the remediation assignments given after the pretest, students in the control group received a slightly higher percentage of assignments than the PLACEments group (6 given, 7 maximal vs. 18 given, 24 maximal). Although given many more assignments, the PLACEments group barely completed just over the same amount of remediation assignments. An interesting piece of data to note, however, is the time spent in total on the assignments, suggesting that the PLACEments group spent over three times more time on their assignments. The posttest indicates that the PLACEments group performed slightly better than the control group on all the given skills and was able to spend less time on the test in general. It follows that the amount of time spent per problem was also less. Overall, students may have learned slightly more core skills than the control group however the results are statistically unreliable.
The second group of students consisted of 38 control students and 36 PLACEments students from Bellingham Memorial Middle School. Table 3 provides the base findings for these students:
Averages (per student) Control PLACEments Effect Size P-value
Pretest Core Skills Score 0.271 0.286 0.094 0.670
Pretest Total Average (all skills) (not tested) 0.400
# of Questions Given 7 (static) 20
Pretest Seconds per Problem 103 sec. 83 sec.
Pretest Total Seconds 1077 sec. 1549 sec.
Posttest Core Skills Score 0.447 0.527 0.414 0.111
Posttest Total Score (all skills) 0.457 0.483 0.229 0.443
Posttest Seconds per Problem 73 sec. 61 sec.
Posttest Total Seconds 1751 sec. 1451 sec.
Remediations Assigned 5 12
Remediations Completed 5 6
Remediation Problems Attempted 5 39
Remediation Seconds per Problem 55 sec. 63 sec.
Remediation Total Seconds 228 sec. 2432 sec.
28
TABLE 4: BELLINGHAM MEMORIAL MIDDLE SCHOOL (GROUP 2) EXPERIMENT RESULTS
The first group of students at Bellingham Memorial performed slightly better on the pretest than the Southbridge students. It should be noted that this group is on par with the curriculum as opposed to the Southbridge students, all of whom are part of the assisted learning program. As expected, the Bellingham students outperformed the Southbridge students. Bellingham students received fewer questions on the PLACEments test and spent more time answering questions. Given their better pretest scores, both the control and experiment groups received fewer
remediation assignments. Both groups also completed more of their assignments and spent less time overall to complete them. As their remediation work would suggest, the control group saw a decent increase in their posttest scores. The PLACEments group saw an even larger gain nearly doubling their pretest score. Overall, the first group of students in Bellingham exhibited the potential of a learning benefit from using PLACEments.
The third group of students, also from Bellingham Memorial Middle School, consisted of 35 control students and 29 PLACEments students. Table 4 provides the base findings for these students:
Averages (per student) Control PLACEments Effect Size P-value
Pretest Core Skills Score 0.530 0.636 0.356 0.127
Pretest Total Average (all skills) (not tested) 0.654
# of Questions Given 7 (static) 14
Pretest Seconds per Problem 131 sec. 126 sec.
Pretest Total Seconds 1083 sec. 1477 sec.
Posttest Core Skills Score 0.632 0.661 0.093 0.692
Posttest Total Score (all skills) 0.579 0.624 0.171 0.475
Posttest Seconds per Problem 63 sec. 65 sec.
Posttest Total Seconds 1444 sec. 1451 sec.
Remediations Assigned 3 7
Remediations Completed 3 3
Remediation Problems Attempted 3 14
Remediation Seconds per Problem 128 sec. 66 sec.
Remediation Total Seconds 269 sec. 937 sec.
29
TABLE 5: COMPLETE EXPERIMENT RESULTS
The second group of students from Bellingham performed the highest out of the three total groups. These students, for the most part, are enrolled in advanced math classes at Bellingham which explains their high pretest scores. On average, they spent the most time per problem out of any group as well as used the most amount of time in general for the allotted duration of the test. As such, they received the lease amount of remediation assignments. The control group generally completed all of their remediation assignments whereas the PLACEments group completed less than half of their assignments. Unfortunately, we were notified after collecting the data that the experiment had not been followed properly for the posttest. Presented in more detail in the “Discussion” section, we cannot include the results from this group in our overall study. For the purpose of experimental integrity, we still present the results from this group to the reader. Table 5 shows the averages of the first and second group combined (the third group is not considered due to the invalidation of its results):
Averages (per student) Control PLACEments Effect Size P-value
Pretest Core Skills Score 0.220 0.230 -0.109 0.522
Pretest Total Average (all skills) (not tested) 0.320
# of Questions Given 7 (static) 21
Pretest Seconds per Problem 101 sec. 75 sec.
Pretest Total Seconds 1041 sec. 1483 sec.
Posttest Core Skills Score 0.418 0.480 0.280 0.150
Posttest Total Score (all skills) 0.394 0.408 0.090 0.664
Posttest Seconds per Problem 73 sec. 60 sec.
Posttest Total Seconds 1759 sec. 1436 sec.
Remediations Assigned 5 15
Remediations Completed 5 6
Remediation Problems Attempted 5 40
Remediation Seconds per Problem 119 sec. 76 sec.
Remediation Total Seconds 467 sec. 2816 sec.
30
In general, students in both conditions showed the same gains between the pretest and posttest. The experiment condition always spent less time per problem but more time overall given the higher number of problems they had to solve. Conversely, the control group spent more time per problem but less time overall. Percentage wise, the control group always completed more
remediation assignments than the PLACEments group by about 3 to 1. Given that the
experimental group performed slightly better, the overall results showed favorable effects from PLACEments however these results are not statistically reliable.
31
Discussion
Given the overall trend in the data, it would look like our experimental design was not a good predictor of the benefits, or potential downfalls, for students using the PLACEments system. Of the nearly 45 data points removed from the study due to various reasons (student achieved a perfect pretest score, student purposely failed the test, student did not take the pretest/posttest, etc.), about two thirds of those data points were from the PLACEments condition. Given the fewer pieces of data to represent the experiment group along with the study chosen,
PLACEments was unable to show any learning difference in comparison to traditional methods. The most obvious idea to increase PLACEments effectiveness would be to force students to complete all of their remediation assignments prior to taking the posttest. From basic intuition, students who complete more practice, especially practice at their level, are bound to perform better on a posttest. As such, lengthening the duration of the study may have resulted in greater remediation completion. Based on a posttest survey given to the students, many of them felt burdened to have to do the extra work each night for the experiment. It may have been an unintentional consequence that giving the students such a short amount of time to complete the experiment caused them not to take the posttest seriously. A longer study may have also let students spend the time necessary to really understand their non-mastered concepts as opposed to scrambling to get as many assignments complete in as little time as possible.
Another potential way the study may have been hurt is in how the study handled the control group. In an effort to give the control students a chance as fair as possible to also learn their non-mastered skill, we provided each student with remediation assignments containing links to websites with decent material to learn from. Although we expected that students would get off track due to the lack of direction, many of the students embraced their independence and took the time to watch the videos and read though the articles. Surprisingly, the control group did
exceptionally well, and in some cases, better than the PLACEments group. This is not to say that PLACEments did not provide any benefit (both conditions saw an increase in test scores) but rather that the control group’s assignments could be as effective as PLACEments given the students apply themselves. In order not to make the experiment too one-sided, we may have
32
inadvertently made the control condition equally as strong thus suggesting that there is no difference in learning potential between the two groups.
The data collected from the groups are also questionable as to their reliability. The posttest data collected for the second group at Bellingham Memorial is unreliable due to a last-minute
problem we were notified of. Each group was given up to a maximum of 60 minutes to complete their posttest however this group was not allotted the full period. Students received minimal time to complete it in class and then were instructed to complete the test for homework or the next day in class. Due to the new variables added in to the experiment, the posttest data collected is not credible. Some students answered the test questions incorrectly to finish the test as quickly as possible as noted by the teachers however there may be other noise causing the statistics to be skewed. Given the ability to run the study again, it would be most beneficial to let it run longer, force students to complete all of their remediation assignments in the time interval, and make sure the participants strictly conform to the study procedure.
33
FIGURE 11: PLACEMENTS SPLIT PREREQUISITE GRAPH
Conclusion and Future Work
Given the ambiguity of the results from the first study, we are working to conduct further experimentation that will more reliably indicate the potential effects of PLACEments. Rather than have a control and experimental condition, we will be splitting the students into two sections that receive both control and experimental work. From the original experiment prerequisite graph shown in Figure 8, we have split the graph into two separate sections, Fractions and Geometry as shown in Figure 11. For one of the two groups, which I will refer to as Section A, they will receive, for example, the geometry skills in a fixed form. Each skill will be tested in a linear fashion. The other set of skills, fractions, will be tested by PLACEments.
The other group, Section B, will receive the same tests however they will take receive
PLACEments on the geometry skills and will take a fixed test on the fraction skills. The PLACEments assignment will provide remediation, or skill builders, to the students as usual but the control
assignment will not cause any remediation, website links or skill builders, to be assigned. Students will then have one week to complete the skill builders and, at the conclusion of the week, will take a posttest on all the skills (which will be a similar posttest from the last original study).
34
TABLE 6: SPLIT PREREQUISITE GRAPH STUDY SCHEDULE
Time Section A Section B
Monday (first week)
Students take a linear test on the Geometry skills and a PLACEments test on the Fraction skills.
Students take a linear test on the Fractions skills and a PLACEments test on the Geometry skills.
Immediately after the pretest
Students receive remediation skill builders from the Fractions test. No remediation is given for the
Geometry skills.
Students receive remediation skill builders from the Geometry test. No remediation is given for the Fractions skills.
Next two weeks
Students are given a one week period in order to complete their remediation assignments.
Monday (third week)
Students take a posttest covering every skill that could have been tested between both the Fractions and Geometry skills from the pretest.
From these results, we are looking to determine if the remediation assignments do have a learning benefit to students, even in a relatively short period of time. We will compare each group to see if by completing the remediation assignments, there was a gain in knowledge as compared to the control skills which they did not receive any remediation for.
In addition to additional studies, we hope to include some new features to the PLACEments project. We currently resolve the situation when a student does not understand a skill; we ask an additional prerequisite question to hone in on the root of the problem. There is the case though that a student may get answer every question correctly which means that they do not receive any remediation assignments. Instead of neglecting to provide proficiency work to these students, we would like to additionally allow PLACEments to assign post-requisite assignments to these students. Every student will therefore have additional work to do that will help them progress further in the curriculum.
In addition to post-requisite work, we also would like a way for anyone to come to the
ASSISTments site and build their own prerequisite graph to be used with PLACEments. Beyond mathematics, there are learning progressions for language, science, and geography classes which can be adapted into a prerequisite graph. Although ASSISTments already provides a way to build learning progressions, the feature needs to be cleaned up to be easily usable by a teacher or educator.
35
FIGURE 12: PLACEMENTS REPORT INFO GRAPHIC Lastly, there are many different
reports that can be developed to help teachers employ formative assessment techniques in the classroom. Listed in the Research and Design portion of the paper, we provide several descriptions of reports that are currently being developed with the help of teacher feedback. One such report that has generated a substantial amount of excitement is the PLACEments test info graphic report. Rather than working with numbers, the
info graphic would display the results of a student’s test directly on the prerequisite graph from which it was generated. As shown in Figure 12, teachers will be able to see a line for the level the test was administered at (the expected mastery blue line) in contrast to how well the student actually performed (the red actual mastery line). By overlaying the students results on the graph, teachers will hopefully it helpful when identifying student mastery. These lines can be broadened to include the average results of a section or class, as well as could pull data from any other schools which have taken PLACEments to show how they rank in comparison (this data would remain anonymous). We will continue to work with teachers to understand the report that will have the most impact in the classroom.
36
References
[1] Achieve Inc. (2013). Partnership for Assessment of Readiness for College and Careers.
Retrieved from PARCC Online: http://www.parcconline.org/
[2] Albert T. Corbett , John R. Anderson, Student Modeling and Mastery Learning in a Computer-Based Proramming Tutor, Proceedings of the Second International Conference on Intelligent Tutoring Systems, p.413-420, June 10-12, 1992
[3] Aleven, V., Koedinger, K. R. and K. Cross (1999). Tutoring Answer Explanation Fosters
Learning with Understanding.Proceedings of the 9th International Conference on Artificial
Intelligence in Education, AIED'99. S. Lajoie and M. Vivet. Amsterdam, IOS Press: 199-206.
[4] Arroyo, I., Murray, T., Woolf, B. and C. Beal (2003). Further results on gender and
cognitive differences in help effectiveness. Proceedings of the 11th International Conference on Artificial Intelligence in Education, Sydney, Australia.
[5] Bloom, Benjamin S.; Hasting, Thomas and Madaus, George (1971). Handbook of
formative and summative evaluation of student learning. New York, USA: McGraw-Hill.
[6] CCSSO, NGA. (2012). Preparing America's Students for College and Career. Retrieved
from Common Core State Standards Initiative: http://www.corestandards.org/ [7] Koedinger, K.R., Anderson, J.R., Hadley, W.H. and Mark, M.A. (1997). Intelligent
tutoring goes to school in the big city.International Journal of Artificial Intelligence in
Education 8 (1): pp. 30-43.
[8] Lesgold, A., Lajoie, S., Bunzo, M., and Eggan, G. (1992). SHERLOCK: A Coached Practice Environment for an Electronics Troubleshooting Job.Computer-Assisted
Instruction and Intelligent Tutoring Systems. Hillsdale, NJ, Lawrence Erlbaum : 201–238.
[9] McCallum, B. (2012, June 9). Jason Zimba's Wiring Diagram. Retrieved from Tools for
the Common Core Standards: http://commoncoretools.me/2012/06/09/jason-zimbas-wiring-diagram/
[10] Militello, M., & Heffernan, N. (2009). Which one is "just right"? What educators should
know about formative assessment systems. International Journal of Educational
Leadership Preparation, 4(3), 1-8.
[11] NWEA. (2012). MAP: Measures of Academic Progress. Retrieved from Northwest
Evaluation Association: http://www.nwea.org/node/98
[12] Razzaq, L. & Heffernan, N.T. (2006). Scaffolding vs. hints in the Assistment system. In Ikeda, Ashley & Chan (Eds.). Proceedings of the Eight International Conference on Intelligent Tutoring Systems. Springer-Verlag: Berlin. pp. 635-644.
[13] Schneiderman, M. (2012, May 22). District Race to the Top Appropriately Prioritizes
37
http://www.siia.net/blog/index.php/2012/05/ district-race-to-the-top-appropriately-prioritizes-personalized-learning/
[14] Shelby, R., Schulze, K., Treacy, D., Wintersgill, M., VanLehn, K. and Anders Weinstein,
A. (2000). An Assessment of the Andes Tutor. Physics Education Research Conference.
Boise, Idaho.
[15] Shute, V. and Gawlick-Grendell, L. (1993). An Experiential Approach to Teaching and
Learning Probability: StatLady.International Conference on Artificial Intellgience in
Education. Edinburgh, Scotland, IOS Press.
[16] Smarter Balanced Assessment Consortium. (2012). Retrieved from Smarter Balanced:
http://www.smarterbalanced.org/
[17] Vanlehn, Collin Lynch, Kay Schulze, Joel A. Shapiro, Robert Shelby, Linwood Taylor, Don Treacy, Anders Weinstein, Mary Wintersgill, The Andes Physics Tutoring System: Lessons Learned, International Journal of Artificial Intelligence in Education, v.15 n.3, p.147-204, August 2005
[18] Vygotsky, L.S. (1978). Mind in society: The development of higher psychological processes. Cambridge, MA: Harvard University Press. pp. 79-91.
[19] Whorton, Skyler. "Can a Computer Adaptive Assessment System Determine Whether Students Know Mathematics Skills Better than Traditional Methods?" Thesis. Worcester Polytechnic Institute, 2012. Print.