Volume 38
Article 24
11-30-2020
Blockchain Risk Evaluation on Enterprise Systems using an
Blockchain Risk Evaluation on Enterprise Systems using an
Intelligent MCDM based model
Intelligent MCDM based model
Ahmed Abdel-Monem
Amal Abdel Gawad
Heba Rashad
Follow this and additional works at: https://digitalrepository.unm.edu/nss_journal
Recommended Citation
Recommended Citation
Abdel-Monem, Ahmed; Amal Abdel Gawad; and Heba Rashad. "Blockchain Risk Evaluation on Enterprise Systems using an Intelligent MCDM based model." Neutrosophic Sets and Systems 38, 1 (2020). https://digitalrepository.unm.edu/nss_journal/vol38/iss1/24
This Article is brought to you for free and open access by UNM Digital Repository. It has been accepted for inclusion in Neutrosophic Sets and Systems by an authorized editor of UNM Digital Repository. For more
University of New Mexico
Blockchain Risk Evaluation on Enterprise Systems using an
Intelligent MCDM based model
Ahmed Abdel-Monem1, Amal Abdel Gawad2, and Heba Rashad3
1Faculty of Computers and Informatics, Zagazig University, Egypt; [email protected] 2Faculty of Computers and Informatics, Zagazig University, Egypt; [email protected] 3Faculty of Computers and Informatics, Zagazig University, Egypt; [email protected]
* Corresponding author:
Ahmed Abdel-Monem ([email protected])Abstract: Blockchain technology (BT) has become popular in the firms in the present time, however,
implementation of BT includes several risk factors from various points of view. Some of these risks can be serious for the processes of firms. These risks should be cautiously recognized and analyzed to reduce the negative impacts of them. Assessment of the risks can be recognized as a multi-criteria decision making (MCDM) problem. In this work, the risks that will occur when implementing BT are assessed by using MCDM methodology built on Single Valued Neutrosophic Sets (SVNSs), Analytic Hierarchy Process (AHP), and Decision Making and Trial Evaluation Laboratory (DEMATEL) methods. The main and sub-criteria risks are collected via a company in the smart village in Egypt and from previous research, hence, the hierarchical form of the problem is built. AHP is used to show the importance of risk factors and the relationships between risk factors obtained by using the DEMATEL method. The main goal of this study is to aid the firms mainly and the firm in Egypt especially to determine which risks are more serious and to which of them causing effect and are being affected. In this study 8 main criterion and 28 sub-criteria, risks are used. As result, the security risk is important in the main risks but energy costs and data leaks are important in sub risks.
Keywords: Blockchain technology (BT), Risks, SVNSs, AHP, DEMATEL
_____________________________________________________________________________________________
1. Introduction
Firms, industries, and businesses have a critical choice and decision in implementing new technology. The processes of the organization are affected by modem technology. For this reason, the implementation of new technology should be considered seriously. These days, technology can be found anywhere, 67% of adults use the internet based on a survey from 40 states. smartphones have also become common [1]. Technology has been profiled in several parts from the manufacture to service segment. It grows the well-being and life standard of people [2]. Technology choice depends on the competitiveness
and effectiveness of organizations [3]. Applying BT in firms has become more popular in the present time because of its importance. The transactions can be done by using a decentralized mechanism because BT is a distributed database. In BT, some blocks are related to each other and they cover many transactions. The transaction should be confirmed in terms of validness before adding to the system as a new block [4]. The chain of transactions can be represented as the blockchain. In Bitcoin, these transactions are public [5]. BT guarantees the transactions more secure for industries, businesses, organizations, and governments, hence the common use of BT will have a big influence on the firms in the future. The transaction data is reserved in various nodes in blockchain and it is known as a dispersed ledger. In the dispersed ledger, every user can enter the public ledger system. This can generate a stable environment and doesn’t depend on third parties. The technology reduces system failure and other connected risks in the chain. BT can be a great area for keeping significant information. BT allows users to monitor prior transactions [6]. Implementing a new BT includes various risk factors from various parts. To apply BT at the maximum level, these risks should be assessed cautiously. In this research, these risks have been assessed in multi-criteria decision making (MCDM) and these are ranked by using Single Valued Neutrosophic Sets (SVNSs), Analytic Hierarchy Process (AHP), and Decision Making and Trial Evaluation Laboratory (DEMATEL). SVNSs are used to deal with uncertainties [7] and likely risk factors are hierarchical based on their importance by AHP [8] and the relationship between them with DEMATEL [9]. To get the best of information, ranking BT risks by using the MCDM technique has not been studied yet. This work will provide a decision to the firms to decide which of these risks are more serious and which of them should be reduced primarily. The remainder of the paper followsas section 2 provides a brief description of blockchain technologies. SVNSs are summarized in section 3. The proposed MCDM methodology based on SVNSs is presented in section 4. Section 5 shows the application for risk assessments of BT by using AHP and DEMATEL. The attained outcomes and future research directions have been discussed in section 6.
2. Blockchain Technologies
BT is considered as one of the most significant creations after the Internet [10]. BT and Internet technology are different in some significant parts. On the Internet, only the information and the copies of things are moved but the original information cannot. In BT, the value of the things is reserved in a time-stamped transaction in a common ledger in a safe way [11]. BT is an information technology [11] and is based on a dispersed ledger technology [6]. With this technology, there is no need to depend on a third party. In BT, when a transaction is done, it should be confirmed. The transaction is only accepted when the agreement is ensured. Then, the information about the transaction is kept on a new block and the new block is added after the other blocks on the chain [6]. Once the information is confirmed and added to the chain, it cannot be removed anymore[6, 10]. BT has become common with Bitcoin implementation [11, 12] and is used in various parts like the Internet of things, economics, and medicine, etc. [13]. Though BT suggests various chances for firms, it can only add value to the products if the processes are appropriate for BT implementation. For example, if there is a need for data transparency or immutability, BT will be beneficial, but if the transaction speed is important, BT will not be suitable [14].
3. The Proposed Model for Risk Evaluation of Blockchain Technologies
In this research, MCDM methodology based on SVNSs, AHP, and DEMATEL methods are suggested for risk assessment of BTs. Three key steps in methodology. The first step, factors of risk is recognized by conducting a literature review and specialist reviews. Then BT risk factors are determined and the
hierarchical structure of the problem is built. In the second step, the risk factors are assessed. For the second step to be achieved AHP method is used to attain main and sub-criteria weights and the DEMATEL method is used to show the importance of main and sub-criteria and the relationship between them. Finally, the risks are ranked according to the weights of the AHP method and showing the impact of the relationship between main and sub-criteria. The detailed framework of the proposed methodology is shown in figure 1.
Fig 1. Steps of SVNSs, AHP, and DEMATEL methodology 3.1. Neutrosophic theory
The neutrosophic set can model the decision maker’s perspectives in the neutrosophic single value scale [15] and apply aggregation to produce the final vision. Neutrosophic set multiplications and calculations are illustrated in [16]. The steps of the neutrosophic theory are illustrated in [17]:
Step 1. Build the decision-making opinions pairwise matrix according to SVNSs scale in table 1 using the
mentioned form: LE= [ l11E ⋯ LE1y ⋮ ⋱ ⋮ lx1E ⋯ lxyE ] (1)
Table1. Single valued Neutrosophic scale Linguistic term SVNSs
Extremely evil (0.00,1.00,1.00) Very Highly evil (0.10,0.90,0.90) Very evil (0.20,0.85,0.80) Evil (0.30,0.75,0.70) Medium evil (0.40,0.65,0.60) Medium (0.50,0.50,0.50) Medium better (0.60,0.35,0.40) Better (0.70,0.25,0.30) Very better (0.80,0.15,0.20) Very Highly better (0.90,0.10,0.10) Extremely better (1.00,0.00,0.00)
Step 2. Convert the SVNSs into crisp values by the use of the score function [18]:
V(lmnE ) =
2+ TmnE − ImnE − FmnE
3 (2)
TmnE , ImnE , FmnE presents truth, indeterminacy, and falsity of the SVNSs.
Step 3. Aggregate the judgments of the pairwise comparison matrix as
𝑙𝑚𝑛 =
∑𝐸𝐸=1𝑙𝑚𝑛
𝐸 (3)
Step 4. Create the comparison matrix of the aggregation as following:
L = [
l11 ⋯ l1n
⋮ ⋱ ⋮
lm1 ⋯ lmn
] (4)
3.2. The AHP method
The steps of the AHP method are shown in [17] as :
Step 1: Calculate the weights of the main criteria and sub-criteria.
Step 1.1: Calculate the normalization using the following equation.
wmx = wm
∑xm=1wm;m = 1,2,3, … … . x (5)
Step 1.2: Calculate the row average.
wm=
∑yn=1(lmn)
y ; m = 1,2,3, … … . x; n = 1,2,3, … … . y; (6)
Step 2: Check the consistency of matrix to ensure the consistency the pair-wise comparison matrix [17].
3.3. The DEMATEL method
Step 1: Generating the direct relation matrix
The matrix of direct relation s x s is obtained through step 4 in neutrosophic theory.
Step 2: Normalizing the direct relation matrix.
The normalized direct relation matrix uses the following equation: B = 1 max 1≤x≤s∑ lmn s y=1 (7) V = B x L (8)
Step 3: Determine the total relation matrix.
This step uses the Matlab software to obtain an identity matrix using the following equation:
O = V(I − V)−1 (9)
Step 4: Calculate the sum of rows (T) and columns (U)
Step 5: Generating a causal diagram
The causal diagram is attained by (T + U) and (T − U) is the outcome of the DEMATEL method.
4. Application
The case study for assessing risk factors of BT, in this section. A company in the smart village in Egypt needs to implement BT for its operations. But the managers recognize that some risks can happen during the implementation of operations, so they decided to assess these risks and calculate which of them have more important before the implementation. In the beginning, the factors of risks are collected by using previous work [10, 11, 13, 20-25] and decision-makers. As a consequence of this, 8 main criteria and 28 sub-criteria are calculated for risk assessment of BT as shown in Figure 2. Then three specialists assessed these main and sub-criteria by using AHP and DEMATEL method.
Fig 2. Evaluation risk factors (Criteria and sub-criteria)
Evaluating
Blockchain
Technology
Risks
C1-Environmental/Cultura
l
S1: Negative image of BT
S2: Uncertainty of customers
C 2- legal and regulatory challenges
S3: Unclear Legal Jurisdictions
S4: Regulatory barriers
S5: Antitrust
C3- Energy
S6: High consumption
S7: Importing energy efficiency
S8: Energy intensive cryptocurrency validation process
C4- Adoption challenges
S9: System speed
S10: User experience
S11: Lack of knowledge
S12: Technology usability
C5- Organizational and strategic
S13: Need of skilled worker
S14: Resistance to changing technology
S15: Lack of equipment and tool
S16: Lack of management support
C6- Technical
S17: Lack of customer awareness
S18: Access to technology
S19: Limited transaction capacity
S20: Scaling due to processing requirements
S21: Untasted code
C7- Financial
S22: Usage cost
S23: Training cost
S24: Energy cost
C8- Security
S25: Cyberattacks
S26: Privacy
S27: Shared data among multiple peer
4.1. Neutrosophic theory results
The neutrosophic set can model the decision maker’s perspectives in neutrosophic single value scale as shown in table 1 and apply aggregation to produce the final vision. The steps of the neutrosophic theory are showed as follows:
Step 1: Build the decision-making opinions pairwise matrix according to SVNSs scale using Eqs. (1).
Step 2: Convert the SVNSs into crisp values by the use of the score function using Eqs. (2).
Step 3: Aggregate the judgments of the pairwise comparison matrix using Eqs. (3.)
Step 4: Create the comparison matrix of the aggregation as shown in table 2 using Eqs. (4).
4.2. The AHP results
Step 1: Compute the normalization matrix using Eq. (5) As shown in table 3.
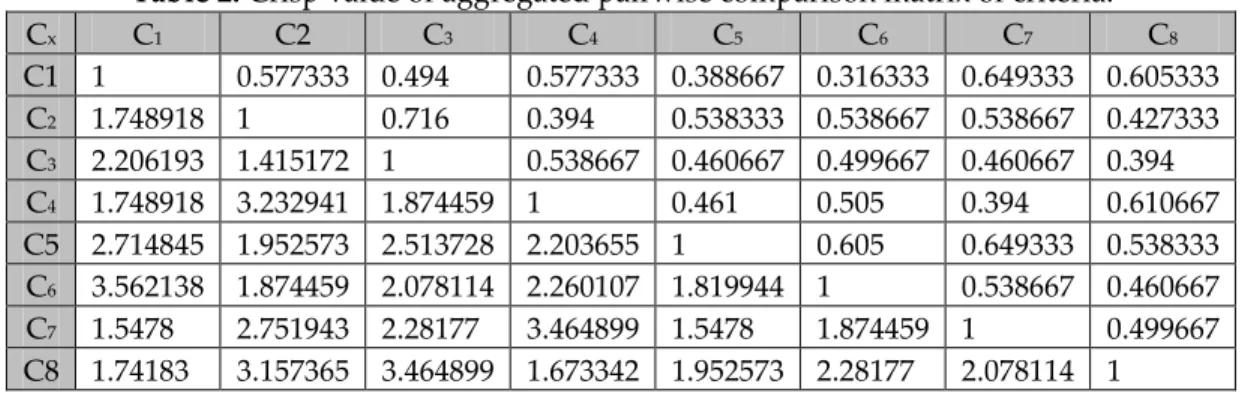
Table 2. Crisp value of aggregated pairwise comparison matrix of criteria.
Cx C1 C2 C3 C4 C5 C6 C7 C8 C1 1 0.577333 0.494 0.577333 0.388667 0.316333 0.649333 0.605333 C2 1.748918 1 0.716 0.394 0.538333 0.538667 0.538667 0.427333 C3 2.206193 1.415172 1 0.538667 0.460667 0.499667 0.460667 0.394 C4 1.748918 3.232941 1.874459 1 0.461 0.505 0.394 0.610667 C5 2.714845 1.952573 2.513728 2.203655 1 0.605 0.649333 0.538333 C6 3.562138 1.874459 2.078114 2.260107 1.819944 1 0.538667 0.460667 C7 1.5478 2.751943 2.28177 3.464899 1.5478 1.874459 1 0.499667 C8 1.74183 3.157365 3.464899 1.673342 1.952573 2.28177 2.078114 1
Step 1.2: Determine the weights of criteria, local and global sub-criteria using Eq. (6) as shown in table 4.
Figure 3 shows the weights of the main criteria.
Table 3. Normalization values of main criteria.
𝐶𝑦𝑧 C1 C2 C3 C4 C5 C6 C7 C8 C1 0.06146 0.03617 0.034251 0.047666 0.047578 0.041509 0.102925 0.133451 C2 0.107489 0.06265 0.049643 0.03253 0.0659 0.070683 0.085384 0.094209 C3 0.135594 0.08866 0.069334 0.044474 0.056392 0.065565 0.07302 0.086861 C4 0.107489 0.202543 0.129963 0.082563 0.056433 0.066265 0.062453 0.134627 C5 0.166855 0.122328 0.174286 0.18194 0.122414 0.079387 0.102925 0.11868 C6 0.21893 0.117434 0.144084 0.186601 0.222787 0.131218 0.085384 0.101558 C7 0.095128 0.172408 0.158204 0.286072 0.189473 0.245963 0.158509 0.110156 C8 0.107054 0.197808 0.240235 0.138156 0.239023 0.29941 0.3294 0.220459
Fig 3. Weights of main criteria.
Step 2: The Consistency Ratio (CR) = 0.10. according to [17] such that CR < =0.1, therefore, the matrix of
pairwise comparison is consistent. Table 5 displays the importance of local and global weights of main and sub-criteria based on AHP calculations. Hence C8 (security) is the most important in the main criteria and C1 (Environmental/Cultural) is the least important in the main criteria. For sub-criteria S24 (Energy cost) is the most important in sub-criteria and S9 (System speed) is the least important in sub-criteria.
Table 4. Weights of main criteria, local and global sub-criteria.
Main Criteria Sub criteria Weights Local weights Global C1 0.063126 s1 0.32903 0.02077 s2 0.67097 0.042356 C2 0.071061 s3 0.283611 0.020154 s4 0.315125 0.022393 s5 0.401263 0.028514 C3 0.077487 s6 0.236806 0.018349 s7 0.305799 0.023695 s8 0.457395 0.035442 C4 0.105292 S9 0.137244 0.014451 s10 0.204308 0.021512 s11 0.349301 0.036779 s12 0.309147 0.032551 C5 0.133602 c1 c2 c3 c4 c5 c6 c7 c8
s13 0.159466 0.021305 s14 0.292025 0.039015 S15 0.247912 0.033122 S16 0.300597 0.04016 C6 0.150999 s17 0.122023 0.018425 s18 0.200505 0.030276 S19 0.198784 0.030016 S20 0.226835 0.034252 S21 0.251853 0.03803 C7 0.176989 s22 0.211513 0.037435 s23 0.286858 0.050771 s24 0.501629 0.088783 C8 0.221443 S25 0.14637 0.032413 S26 0.25559 0.056599 S27 0.238016 0.052707 S28 0.360024 0.079725
4.3. The DEMATEL results
Step 1: Generating the direct relation matrix in table 5 of the main criteria and direct relation matrix for the
sub-criteria of security criteria in table 5.
Step 2: Normalizing the direct relation matrix for the main criteria in table 6 using Eqs. (7, 8).
Step 3: Determine the total relation matrix using Eq. (9) In table 7.
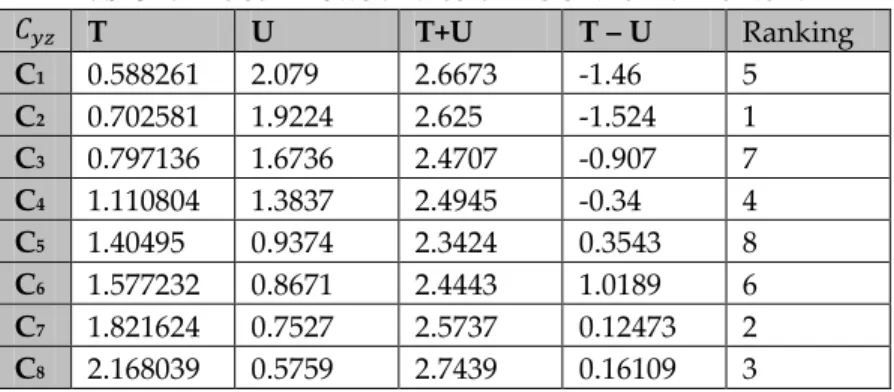
Step 4: Calculate the sum of rows (T) and columns (U) in table 8 and rank according to the importance of
the main criteria in table 8.
Step 5: Generating a causal diagram as shown in figure 4. It shows the security, financial, technical, and
organizational is the most important main criteria. C5 (Organizational), C6 (Technical), C7 (Financial), C8 (Security)are causing effect while others are being affected
Fig 4. The causal diagram for the main criteria.
Table 5. The direct relation matrix for sub-criteria of security.
𝑆𝑦𝑧 S25 S26 S27 S28
S25 1 0.394 0.671667 0.671667 S26 4.051484 1 0.677333 0.571667 S27 1.687315 1.540713 1 0.671667
S28 1.687315 2.69554 1.687315 1
Table 6. Normalization of direct relation matrix of main criteria.
𝐶𝑦𝑧 C1 C2 C3 C4 C5 C6 C7 C8 C1 0.0578 0.03337 0.028553 0.03337 0.022465 0.018284 0.037531 0.034988 C2 0.101087 0.0578 0.041385 0.022773 0.031116 0.031135 0.031135 0.0247 C3 0.127518 0.081797 0.0578 0.031135 0.026627 0.028881 0.026627 0.022773 C4 0.101087 0.186864 0.108344 0.0578 0.026646 0.029189 0.022773 0.035297 C5 0.156918 0.112859 0.145293 0.127371 0.0578 0.034969 0.037531 0.031116 C6 0.205892 0.108344 0.120115 0.130634 0.105193 0.0578 0.031135 0.026627 C7 0.089463 0.159062 0.131886 0.200271 0.089463 0.108344 0.0578 0.028881 C8 0.100678 0.182496 0.200271 0.096719 0.112859 0.131886 0.120115 0.0578
Table 7. Total relation matrix of main criteria.
𝐶𝑦𝑧 C1 C2 C3 C4 C5 C6 C7 C8 C1 0.121175 0.094524 0.081078 0.076915 0.05188 0.046394 0.062404 0.053891 C2 0.176417 0.124154 0.098908 0.0713 0.064241 0.061554 0.059248 0.04676 C3 0.211359 0.154533 0.119665 0.082342 0.062187 0.061692 0.057744 0.047614 C4 0.220165 0.289444 0.193498 0.123948 0.074857 0.074542 0.065226 0.069124 C5 0.307497 0.250131 0.257612 0.216011 0.11798 0.091106 0.090063 0.074551 C6 0.376721 0.260514 0.247866 0.233394 0.173768 0.119465 0.089823 0.075681 C7 0.295829 0.347913 0.287103 0.32493 0.173242 0.183664 0.124348 0.084594 -1.46 -1.524 -0.907 -0.34 0.3543 1.0189 0.12473 0.16109 -2 -1.5 -1 -0.5 0 0.5 1 1.5 2.3 2.35 2.4 2.45 2.5 2.55 2.6 2.65 2.7 2.75 2.8
C8 0.348777 0.401178 0.387831 0.254874 0.219212 0.228671 0.20381 0.123685
Table 7. The sum rows and columns of the main criteria.
𝐶𝑦𝑧 T U T+U T – U Ranking C1 0.588261 2.079 2.6673 -1.46 5 C2 0.702581 1.9224 2.625 -1.524 1 C3 0.797136 1.6736 2.4707 -0.907 7 C4 1.110804 1.3837 2.4945 -0.34 4 C5 1.40495 0.9374 2.3424 0.3543 8 C6 1.577232 0.8671 2.4443 1.0189 6 C7 1.821624 0.7527 2.5737 0.12473 2 C8 2.168039 0.5759 2.7439 0.16109 3
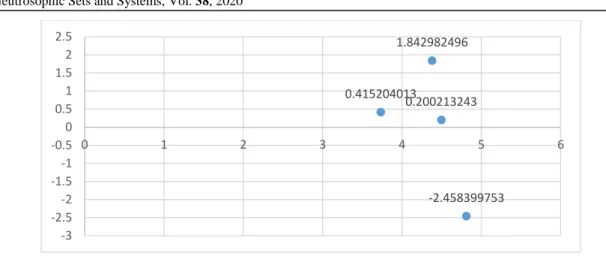
Figure 5 shows S2 (Uncertainty of customers) is causing effect while S1 (Negative image of BT) is being affected in C1 (Environmental/Cultural). Figure 6 shows S5 (Antitrust) is causing effect while S3 (Unclear Legal Jurisdictions) and S4 (Regulatory barriers) are being affected in C2 (legal and regulatory challenges). Figure 7 shows S8 (Energy-intensive cryptocurrency validation process) is causing effect while S6 (High consumption) and S7 (Importing energy efficiency) are being affected in C3 (Energy). Figure 8 shows S11 (Lack of knowledge) and S12 (Technology usability) are causing effect while S9 (System speed) and S10 (User experience) are being affected in C4 (Adoption challenges). Figure 9 shows S14 (Resistance to changing technology) and S16 (Lack of management support) are causing effect while S13 (Need of skilled worker) and S15 (Lack of equipment and tool) are being affected in C5 (Organizational and strategic). Figure 10 shows S20 (Scaling due to processing requirements) are S21 (Untested code) are causing effect while S17 (Lack of customer awareness), S18 (Access to technology), and S19 (Limited transaction capacity) are being affected in C6 (Technical). Figure 11 shows S24 (Energy cost) is causing effect while S22 (Usage cost) and S23 (Training cost) are being affected in C7 (Financial). Figure 12 shows S27 (Shared data among multiple peers) and S28 (Data leaks) are causing effect while S25 (Cyberattacks) and S26 (Privacy) are being affected in C8 (Security).
Fig 5. The causal diagram for C1 (Environmental) sub-criteria.
4.319145239 1.481202152 0 1 2 3 4 5 -2 -1 0 1 2 3 4 5
Fig 6. The causal diagram for C2 (legal and regulatory challenges) sub-criteria.
Fig 7. The causal diagram for C3 (Energy) sub-criteria.
Fig 8. The causal diagram for C4 (Adoption challenges) sub criteria.
-1.344775009 -0.416830876 1.761605885 -2 -1.5 -1 -0.5 0 0.5 1 1.5 2 8.94 8.96 8.98 9 9.02 9.04 9.06 9.08 9.1 9.12 -0.705970768-0.633662074 1.339632842 -1 -0.5 0 0.5 1 1.5 0 0.5 1 1.5 2 2.5 3 3.5 -1.685365394 -0.223179809 1.188368054 0.720177148 -2 -1.5 -1 -0.5 0 0.5 1 1.5 0 0.5 1 1.5 2 2.5 3 3.5
Fig 9. The causal diagram for C5 (Organizational and strategic) sub-criteria.
Fig 10. The causal diagram for C6 (Technical) sub-criteria.
Fig 11. The causal diagram for C7 (Financial) sub-criteria.
-2.351235254 0.996540059 0.339886484 1.014808711 -3 -2.5 -2 -1.5 -1 -0.5 0 0.5 1 1.5 0 1 2 3 4 5 6 -4.112923216 0.223653879 0.5926847781.27739358 2.019190979 -6 -4 -2 0 2 4 0 1 2 3 4 5 6 7 8 9 -1.059830189 -0.421305846 1.481136034 -1.5 -1 -0.5 0 0.5 1 1.5 2 2.95 3 3.05 3.1 3.15 3.2 3.25 3.3 3.35 3.4
Fig 12. The causal diagram for C8 (Security) sub-criteria.
5. Conclusion and Future Works
BT is one of the most significant creations of the Internet. The usage of this system has become fairly common for firms. Though, implementing a new BT system in firms includes different risk factors. Consequently, firms need to address and analyze these risks. For this goal, the risks of BT in a firm are measured and ranked by using SVNSs, AHP, and DEMATEL method. In this ranking process, Energy, environmental/cultural, financial, security, organizational, technical, legal, and regulatory challenges and adoption challenges risks are taken into account. 28 sub-risks covered by these risks are assessed under these groups. As a result, security is considered as the most significant risk factor among the eight risks and energy cost, and data leaks are ranked as the first and second important sub-risks correspondingly. DEMATEL results show security, financial cost, technical and organizational are causing effect while others are being affected. So the administrators should give more importance to these types of risks. For future research, the scope of the problem can be extended and the solutions of minimizing the risks for BT can be added as alternatives and the problem can be solved by MCDM techniques.
References
1. Wyant, J. and J.-H. Baek, Re-thinking technology adoption in physical education. Curriculum Studies in Health and Physical Education, 2019. 10(1): p. 3-17.
2. Renn, O. and C. Benighaus, Perception of technological risk: insights from research and lessons for risk communication
and management. Journal of Risk Research, 2013. 16(3-4): p. 293-313.
3. Farshidi, S., et al., A decision support system for software technology selection. Journal of Decision systems, 2018.
27(sup1): p. 98-110.
4. Chen, R.-Y., A traceability chain algorithm for artificial neural networks using T–S fuzzy cognitive maps in blockchain.
Future Generation Computer Systems, 2018. 80: p. 198-210.
5. Prybila, C., et al., Runtime verification for business processes utilizing the Bitcoin blockchain. Future Generation Computer Systems, 2017.
6. Ølnes, S., J. Ubacht, and M. Janssen, Blockchain in government: Benefits and implications of distributed ledger
technology for information sharing. 2017, Elsevier.
7. Yang, H.-L., et al., A hybrid model of single valued neutrosophic sets and rough sets: single valued neutrosophic rough
set model. Soft Computing, 2017. 21(21): p. 6253-6267.
8. Nabeeh, N.A., et al., An integrated neutrosophic-topsis approach and its application to personnel selection: A new
trend in brain processing and analysis. IEEE Access, 2019. 7: p. 29734-29744.
-2.458399753 0.200213243 0.415204013 1.842982496 -3 -2.5 -2 -1.5 -1 -0.5 0 0.5 1 1.5 2 2.5 0 1 2 3 4 5 6
9. Liu, F., et al., A multicriteria model for the selection of the transport service provider: A single valued neutrosophic
DEMATEL multicriteria model. Decision Making: Applications in Management and Engineering, 2018. 1(2): p.
121-130.
10. Efanov, D. and P. Roschin, The all-pervasiveness of the blockchain technology. Procedia Computer Science, 2018.
123: p. 116-121.
11. Saberi, S., et al., Blockchain technology and its relationships to sustainable supply chain management. International Journal of Production Research, 2019. 57(7): p. 2117-2135.
12. Sikorski, J.J., J. Haughton, and M. Kraft, Blockchain technology in the chemical industry: Machine-to-machine
electricity market. Applied Energy, 2017. 195: p. 234-246.
13. Li, X., et al., A survey on the security of blockchain systems. Future Generation Computer Systems, 2017. 14. Casino, F., T.K. Dasaklis, and C. Patsakis, A systematic literature review of blockchain-based applications: current
status, classification and open issues. Telematics and Informatics, 2019. 36: p. 55-81.
15. Kazimieras Zavadskas, E., R. Baušys, and M. Lazauskas, Sustainable assessment of alternative sites for the construction of a waste incineration plant by applying WASPAS method with single-valued neutrosophic set.
Sustainability, 2015. 7(12): p. 15923-15936.
16. Nabeeh, N.A., A. Abdel-Monem, and A. Abdelmouty, A Novel Methodology for Assessment of Hospital Service
according to BWM, MABAC, PROMETHEE II. Neutrosophic Sets and Systems, 2020. 31(1): p. 5.
17. Nabeeh, N.A., A. Abdel-Monem, and A. Abdelmouty, A Hybrid Approach of Neutrosophic with MULTIMOORA
in Application of Personnel Selection. Neutrosophic Sets and Systems, 2019: p. 1.
18. Wang, H., et al., Single valued neutrosophic sets. 2010: Infinite study.
19. Abdel-Basset, M., et al., A hybrid approach of neutrosophic sets and DEMATEL method for developing supplier
selection criteria. Design Automation for Embedded Systems, 2018. 22(3): p. 257-278.
20. Abdel-Basset, M., Gamal, A., Chakrabortty, R. K., & Ryan, M. A new hybrid multi-criteria decision-making approach for location selection of sustainable offshore wind energy stations: A case study. Journal of Cleaner Production, 280, 124462.
21. Abdel-Basset, M., Manogaran, G. and Mohamed, M., 2019. A neutrosophic theory based security approach for fog and mobile-edge computing. Computer Networks, 157, pp.122-132.
22. Abdel-Basst, M., Mohamed, R., & Elhoseny, M. (2020). <? covid19?> A model for the effective COVID-19 identification in uncertainty environment using primary symptoms and CT scans. Health Informatics Journal, 1460458220952918.
23. Abdel-Basset, M., Gamal, A., Chakrabortty, R. K., & Ryan, M. J. (2020). Evaluation of sustainable hydrogen production options using an advanced hybrid MCDM approach: A case study. International Journal of Hydrogen Energy.
24. Abdel-Basset, Mohamed, et al. "Evaluation framework for smart disaster response systems in uncertainty environment." Mechanical Systems and Signal Processing 145 (2020): 106941.
25. Abdel-Basset, Mohamed, et al. "A novel decision-making model for sustainable supply chain finance under uncertainty environment." Journal of Cleaner Production (2020): 122324.
26. Min, H., Blockchain technology for enhancing supply chain resilience. Business Horizons, 2019. 62(1): p. 35-45.