The future scope of large-scale solar in the UK: Site suitability and
target analysis
Diane Palmer
a,*, Ralph Gottschalg
a,b,c, Tom Betts
aaCentre for Renewable Energy Systems Technology (CREST), Loughborough University, LE11 3TU, United Kingdom
bFraunhofer Center for Silicon-Photovoltaic (CSP), 06120, Halle, Germany
cEMW, Hochschule Anhalt, 06366, K€othen, Germany
a r t i c l e i n f o
Article history:Received 23 October 2017 Received in revised form 5 June 2018
Accepted 30 August 2018 Available online 1 September 2018
Keywords:
Solar farm planning Site location Photovoltaic Suitability map Solar installation policy Geographical information systems
a b s t r a c t
This paper uses site suitability analysis to identify locations for solar farms in the UK to help meet climate change targets. A set of maps, each representing a given suitability criterion, is created with geographical information systems (GIS) software. These are combined to give a Boolean map of areas which are appropriate for large-scale solar farm installation. Several scenarios are investigated by varying the criteria, which include geographical (land use) factors, solar energy resource and electrical distribution network constraints. Some are dictated by the physical and technical requirements of large-scale solar construction, and some by government or distribution network operator (DNO) policy. It is found that any suitability map which does not heed planning permission and grid constraints will overstate po-tential solar farm area by up to 97%. This researchfinds sufficient suitable land to meet Future Energy Scenarios (UK National Grid outlines for the coming energy landscape).
©2018 The Authors. Published by Elsevier Ltd. This is an open access article under the CC BY license (http://creativecommons.org/licenses/by/4.0/).
1. Introduction
Following the Paris Agreement of the United Nations Frame-work Convention on Climate Change in 2015, governments are encouraging power suppliers to increase the proportion of elec-tricity generation from renewable energy resources. The aim is to reduce carbon dioxide emissions. Solar photovoltaics (PV) is an integral part of this effort. In the UK, legally-binding limits are set by the Climate Change Act 2008 [1] and are guided by the UK Renewable Energy Roadmap [2]. This commits the nation to a 34% reduction in greenhouse gases by 2020 (based on 1990 levels). The Roadmap expresses the government's opinion that solar PV should make a significant contribution to the renewable energy generation mix and to this end up to 20 GW of solar PV could be installed by 2020. Currently (end of January 2018), there is a total capacity of 12.8 GW of PV [3], so capacity would need to almost double to fulfil these ambitions. Falling costs and the recent history of installation rate are making this scenario appear ever more achievable. Declining component prices are expected to reduce utility-scale PV costs annually for at least the nextfive years [4]. However, these
falling technology costs have also resulted in a reduction in gov-ernment subsidies [5]. UK government policy on solar farms is perhaps best summarised by a ministerial speech“we want to see a lot, lot more. But not at any cost…not in any place [6].”
Thus there is currently a government drive to expand UK solar farm assets, whilst keeping costs low and retaining public support. This presents a challenge for solar project developers and consul-tancies. The discovery of economically feasible locations for utility-scale solar projects, which also fall within policy guidelines, can be a costly process in itself. Geographical information systems (GIS) are now frequently employed as a cost effective means to deter-mine optimal locations for solar farms worldwide. Map layer data quality and GIS modelling techniques have advanced in the last decade. The U.S. Department of Energy's SunShot Initiative specif-ically called for the application of GIS to reduce so-called “soft costs”[7].
1.1. Contemporary GIS analysis for large-scale solar installation site selection
There are several commercial mapping applications dedicated to solar siting in the US e.g. PVMapper [8], but these do not cover other continents. Table 1 reviews global state-of-the-art GIS *Corresponding author.
E-mail address:[email protected](D. Palmer).
Contents lists available atScienceDirect
Renewable Energy
j o u r n a l h o me p a g e : w w w . e l s e v i e r . c o m/ l o ca t e / r e n e n e
https://doi.org/10.1016/j.renene.2018.08.109
analysis for utility-scale solar resource site selection. Inputs include slope of land, proximity to electricity transmission and road net-works, current land use and avoidance of environmentally sensitive areas. Interestingly, not all studies attempt to maximise the solar yield, possibly because in some locations this is taken for granted. These input factors are typically categorised as economic, envi-ronmental, social and technical requirements. However, from the point of view of accomplishing analysis, this research divides them into: land use criteria, the solar resource, network connection constraints and restrictions due to ground slope. Obviously, some aspects are region-specific e.g. dust storms in Europe are of less significance and occur less frequently than in the Arabian Penin-sula. Large earthquakes associated with fault zones are unknown in the UK. The same physical feature may also be treated differently between countries. For instance, proximity to a river is a desirable attribute in the US where the water is required for panel cleaning. On the other hand, rain is generally relied upon in the UK for cleaning, so rivers are regarded as unimportant or in some cases to be avoided as aflood risk.
All commercial and research solar farm siting applications overlay multiple GIS map layers. In contrast, the relationship be-tween those layers is handled using a variety of techniques. The simplest is Boolean, where an area of land is simply regarded as advantageous for solar farm development (e.g. adequate solar irradiation) or excludes large-scale solar siting (e.g. built environ-ment). The advantageous layers are combined and the exclusionary criteria maps are subtracted to generate an overall suitability map. The more complex map overlay techniques weight the individual layers according to personal judgement, expert opinion or analyt-ical hierarchy process (AHP). AHP involves pairwise comparisons. It isflexible and clarifies the weight of each criterion. Nevertheless, it has some shortcomings including arbitrary rankings, ambiguous questions and elicitation questions [16].
Nearly all the research listed inTable 1focusses on countries with high average annual solar irradiation. Only one paper has investigated solar farm location in Northern Europe [16]. There is a lack of case studies in high latitude regions. Many authors include proximity to power lines amongst their suitability criteria, but so far no research has examined whether those grid lines actually have the capacity to incorporate extra distributed generation. Furthermore, none of the studies reviewed above evaluate the impact of policy decisions by government bodies and business or-ganisations on solar farm site location. Regulatory issues have a large influence in site development [18]. The strong correlation between expansion of PV technology and level of policy support
has been demonstrated by an assessment of existing PV deploy-ment in the UK [19].
This paper describes the generation of a UK-wide site suitability map for potential solar farm locations. The objectives are: to determine how much large-scale solar canfit into the UK; and how much of this quantity will be installed in reality in the current economic circumstances. The approach presented may be applied anywhere with adequate spatial data inputs. It is intended as an analytical tool to aid decision-making, appropriate for government departments, DNO companies and solar developers.
2. Methods
2.1. Study area
The study area is the whole of the UK mainland. This developed nation is one of the most densely populated countries in Europe. Yet, only 10% of the land mass is classified as urban, hence theo-retically there should be adequate opportunity for establishing large-scale solar installations. Having said that, the heterogeneity of the British landscape presents challenges for analysis. It comprises farmland, woodland, industrial areas, mountains, moors, villages, small towns and big cities. Additionally, the agricultural areas often contain significant areas of natural vegetation or may be mixed with industry.
2.2. Breakdown of method
This research uses a three phase approach. Firstly, land use criteria are chosen and combined with the solar resource. Secondly, electricity transmission network constraints are identified. Thirdly, the impact of slope on solar farm installation, both in terms of physical limitations and planning policy, is investigated. Details of the site selection method are illustrated inFig. 1. (Analysis carried out using ArcGis software [20]).
2.3. Selection and combination of criteria 2.3.1. Choice of land use criteria
Definition of appropriate criteria is not straightforward. Some are obvious, for instance, a solar farm cannot be located in built-up, wooded or mountainous areas. As evidenced inTable 1, little aca-demic literature is relevant to the UK, so factors were also extracted from several solar consultancy websites and reports ([21e24]). Not all of the consultants’ ideal site requirements could be Glossary
AHP Analytical hierarchy process BSP Bulk Supply Point
CfD Contracts for Difference
Corine Coordination of information on the environment DBEIS Department for Business, Energy and Industrial
Strategy
DECC Department of Energy and Climate Change
Defra Department for Environment, Food and Rural Affairs DNO Distribution Network Operator
GHI Global horizontal irradiation GIS Geographical Information Systems
GW Gigawatt
IRENA International Renewable Energy Agency
KML Keyhole Markup Language
kV Kilovolt
kWh Kilowatt hour
MW Megawatt
PV Photovoltaics
REPD Renewable Energy Planning Database
RO Renewable Obligation
SRTM Shuttle Radar Topography Mission
SSEPD Scottish and Southern Energy Power Distribution STA Solar Trade Association
UK United Kingdom of Great Britain and Northern Ireland
US United States of America
implemented. Avoidance of land containing single large trees and mobile phone masts which cast shade or public footpaths was not possible due to lack of data and computer storage/processing needs. The criteria eventually chosen and the online sources from which the GIS layers were obtained are detailed inTable 2.
The national parks and moorland line layers are used to rule out environmentally sensitive, historically significant and pro-tected areas. Access to a road is also an important consideration in any large-scale PV project. It is necessary for construction and maintenance vehicles. This research assumes all non-mountainous areas of the UK have at least an un-metalled road close by to allow farm dispatches and deliveries. Consequently, roads are not input as a map layer.
The avoidance offlood zones and high grade agricultural land for potential solar farm development is more problematic. Solar consultancies advise selecting land outside of recognised flood zones but a recent author supports installation on flood plains when appropriate measures are implemented [29]. This research therefore investigates several scenarios, with and withoutflood zones as an exclusionary criteria, and with only largeflood zones (over 40 km2) used for exclusion.
UK government policy on site suitability for large-scale solar is subject to interpretation. Establishing a solar farm on land clas-sified as agricultural grade 1, 2 or 3a or in ecological areas is not specifically banned, yet it is unlikely planning permission would be granted [30]. There is the additional difficulty that available maps do not stipulate whether grade 3 land is 3a or 3b. For this reason, scenarios allowing development on all agricultural land, or excluding development on grade 1 and 2, and on 1, 2, and 3, were all investigated. (UK Agricultural Land Classification grades: 1eexcellent, 2every good, 3aegood, 3bemoderate, 4epoor, 5- very poor.)
An attempt at validating the land use criteria was made by determining whether existing solar farms are found in the exclusion areas. The locations of solar installations from the Department of Energy and Climate Change Renewable Energy Planning database, REPD 2015 (575 x 1e50 MW installations at September 2015) were analysed. The results are illustrated in Fig. 2.
It may be seen that some existing large-scale solar plants are situated within woodlands. The explanation lies in the accuracy of the map, which has simplified clearings. Installations are also to be found in urban areas. This is because the urban map contains brownfield land. This will be analysed separately (Subsubsection 2.3.1.1). Thus some problems in defining criteria may be accounted for by map accuracy. 12% of existing UK solar farms are inflood zones, suggesting siting there is feasible. The majority of current solar farms are located on agricultural land grade 1, 2 and 3 with 16% falling into grade 1 and 2 areas. Then again, government guidance has changed in the last couple of years. On 25 March 2015 a government statement declared that proposals for solar farms on high grade agricultural land would need to be justified by “the most compelling evidence” and each case must be considered on its merits. Several solar farm appeals have been dismissed since then on the grounds that they would occupy valuable farm land. In summary, solar development on flood plains appears possible but now less likely on high grade agri-cultural land.
2.3.1.1. Availability of brownfield land for solar installation.
Planning policies should encourage re-use of previously devel-oped (brownfield) land [31]. The only database of brownfield sites in the UK is the Corine Land Cover 2012 dataset, classification 132, dump sites [32]. The minimum mapping unit is 25 ha. Fortunately,
solar projects on low-grade or brownfield land tend to range from Table
1 Summary of cont emporar y tech niq ues and crit eria emplo y e d for GIS anal y sis of solar siting. Country Analysis Technique Irradiation Slope Aspect Roads Rivers Settlements Power lines Landcover Acreage Fault zones Elevation Tempe rature Cloud, humidity,dust Social preference Reference Australia Boolean ✓ < 4% ✓✓ ✓ ✓ ✓ [ 9 ] India Boolean ✓ < 2% ✓✓ [ 10 ] Iran fuzzy AHP ✓ < 11% ✓✓ ✓ ✓ ✓ ✓ ✓ ✓ [ 11 ] Malaysia Boolean ✓ < 5% ✓✓ ✓ ✓ ✓ [ 12 ] Morocco Boolean ✓ < 5% ✓✓ ✓ [ 13 ] Turkey Weig hted overlay by personal judgement < 9% ✓✓ ✓ ✓ ✓ [ 14 ] Turkey AHP ✓ < 3% ✓✓ ✓ ✓ [ 15 ] UK AHP < 10% ✓✓ ✓ ✓ ✓ [ 16 ] USA Weig hted linear combination ✓ < 9% ✓✓ ✓ ✓ [ 17 ] USA Boolean ✓ < 3% ✓✓ ✓ ✓ [ 18 ]
60 to 100 ha [33], so this resolution is acceptable.
Brownfield site analysis was carried out independently of the other land use criteria due to the relatively small overall area covered by this category. Corine 132 sites within 10 km of an electricity network Bulk Supply Point (BSP) (see 2.4) were selected using GIS and converted to KML. Candidate sites were viewed with aerial photography available in GoogleEarth [34].
2.3.2. The solar resource
The solar resource is a critical factor for any solar farm. Most studies employ satellite based estimations. Another (less accurate) possibility is to model solar energy on the earth's surface per unit of area and time, using sun path, sun angle and ground elevation. This research interpolates [35,36] the global horizontal irradiation (GHI) measurements of over 80 UK meteorological stations [37]. The weather stations are distributed unevenly throughout the UK. Stations cluster in London, the South and the Midlands. Stations are typically about 40 km apart. The ordinary kriging interpolation technique was employed. Kriging was used to take advantage of the ground-based measurement network available in the UK, which at 3 met. stations per 10,000 km2 has been demonstrated to be
adequate for this work [38]. In addition the uncertainties inherent in satellite-derived datasets [39] are circumvented.
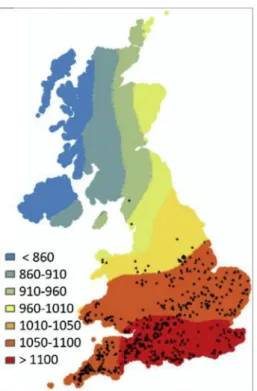
The threshold solar energy resource regarded as sufficient for a solar farm development varies from country to country. There is very little guidance as to what is acceptable in the UK, since it is only one (admittedly significant) ingredient in a complex cost/ benefit calculation. [22] select sites predicted to receive at least 1050 kWh/m2/annum solar irradiation. (Annual GHI values for the UK are illustrated inFig. 3.) Once again, the situation of existing large-scale solar plants was scrutinised. 97% were found to receive more than 210 Wh/m2(0.21 kWh/m2) average hourly global hori-zontal irradiation (average of 2011e2015) (Fig. 4). Therefore this value was taken as a minimum for potential large-scale in-stallations. It covers all land in the UK south of a line running from roughly the Humber Estuary to Snowdon in North Wales (top of yellow band inFig. 4). That is approximately half of England or one-third of the British mainland. This area is similar to that which receives the 1050 kWh/m2annual irradiation advised by the solar consultancy (top of orange band inFig. 3).
2.3.3. Combination of land use criteria
A simple Boolean method was used to combine the criteria because of the subjectivity involved in weighting layers and the above-mentioned problems with AHP. It is difficult to develop an unbiased score due to varying perspectives between developers [18]. The original vector (line) electronic map layers were converted to 1 km2 raster (pixel) cells. Overlaps between the layers were subtracted e.g. woodlands in mountainous regions. The area of each criterion was entered into a spreadsheet to show the impact on land available for solar of each one. The sum of the non-overlapping areas was deducted from the total land area of the UK to deliver a first estimate of potential solar farm capacity.
Fig. 1.Details of generation of UK-wide site suitability map for potential solar farm locations.
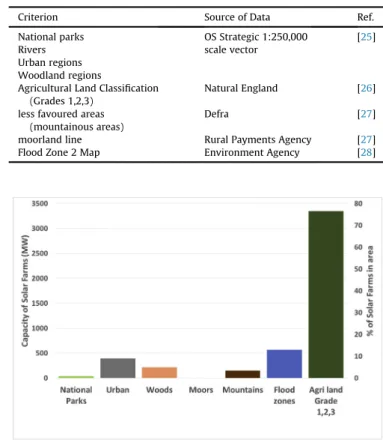
Table 2
Land use criteria.
Criterion Source of Data Ref. National parks OS Strategic 1:250,000
scale vector
[25] Rivers
Urban regions Woodland regions
Agricultural Land Classification (Grades 1,2,3)
Natural England [26] less favoured areas
(mountainous areas)
Defra [27] moorland line Rural Payments Agency [27] Flood Zone 2 Map Environment Agency [28]
The following layers were combined to give an overall coun-trywide exclusion zone for development of large-scale solar: na-tional parks, urban regions, woodland regions, Agricultural Land Classification (Grades 1,2,3), less favoured areas (mountainous areas), moorland line and Flood Zone 2 Map. Further combination maps were produced with agricultural land grades 1 and 2 only and floods zones larger than 40 km2 because of lack of clarity over
which criteria to include.
The size of a solar farm is usually described in terms of its nameplate capacity, rather than its land area. Accordingly, the re-sults are converted to capacity using the 2 ha of land (0.02 km2/5 acres) per megawatt conversion factor provided by the UK Solar Trade Association.
2.4. Network connection constraints 2.4.1. Constraints on grid connection
In the UK, larger solar farms (50 MW or more) connect to the national grid at the 33 kV level. (Note: Generation, transmission, distribution and consumption of electricity in the UK is normally in the form of alternating current (AC)). Small ones (up to 10 MW) connect to the 11 kV lines, but feed up to the higher level. Therefore grid connection was studied by determining availability of 33 kV Bulk Supply Points (BSP) to potential solar plants of all sizes. UK DNO websites offer maps of their locations [40e42], but the exis-tence of a BSP does not guarantee that the DNO will accept connection of additional distributed generation to that point. Constraints on BSP were obtained from the DNO constraint maps [40,43,44]. Scottish and Southern Energy Power Distribution (SSEPD) provide generation availability as map coordinates of un-constrained BSP. The others are pdf maps which required digitising. BSP marked as unconstrained, no voltage constraint, no thermal overload, no reverse powerflow, or no fault level limitation were considered suitable for solar farm connection.
Out of 2782 BSP situated south of the 210 Wh/m2irradiation line, only 977 are available for distributed generation connection. That is, only about one-third of BSP are actually available for connection, mostly in the South and Southeast. Restrictions may due to fault levels caused by legacy switchgear, for example, although another key constraint is the policy implemented by the DNO.
European Directive 2003/54/EC [45] encourages DNOs to inte-grate distributed generation into their network planning. Yet there is little incentive for them to do so. DNOs share the costs of any network reinforcement which is necessary with the renewable generator. Whilst connection of decentralised energy can result in lower electrical losses for DNOS, they also have to manage the resulting voltagefluctuation. On the whole, most of the benefits lie with the generator [46,47].
2.4.2. Distance to grid
There are no definitive specifications as to how close to the grid a solar farm must stand. Most solar consultancies advertise for sites within 1 km of existing distribution lines but few actual in-stallations meet this standard. 50% of existing solar farms (REPD, 2015) are within 2.5 km of a BSP. 10 km represents one standard deviation. Buffers (circles) were generated using GIS to select suitable land around unconstrained BSP at these distances. A further case was also investigated, using buffers of variable distance which move out from the BSP until the nearest river is reached. Given the high cost of taking a cable under a river, this was judged to be a realistic scenario.
2.4.3. Combination of distance to grid and land use criteria
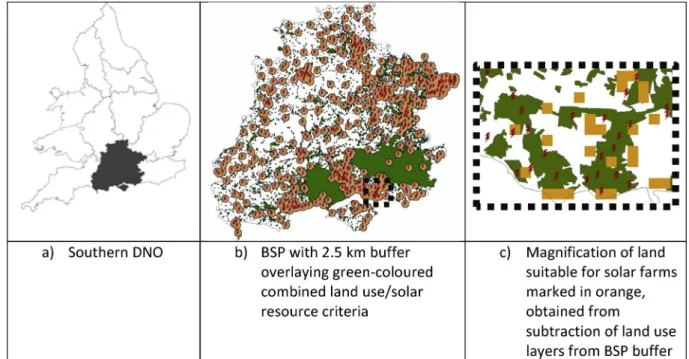
Unconstrained BSP were buffered and converted to raster (grid) format. Combined land use layers were subtracted (Section2.3.3) to deliver suitable areas for solar farm development. This process is illustrated inFig. 5, taking the example of the Southern DNO with a buffer distance of 2.5 km.
Fig. 3.Current solar farms (REPD 2015) compared to total interpolated GHI kWh/m2/
annum.
Fig. 4.Current solar farms (REPD 2015) compared to interpolated average hourly GHI Wh/m2(calculated from 5106 recorded irradiation values for 2015).
2.5. Restrictions due to slope: physical and permissible
As indicated inTable 1, there is little agreement between sci-entific research papers as to the maximum physical slope for a solar farm build to be considered. This ranges from<2% to<11% in the table. Indeed, there is no unified threshold of land slope according to the International Renewable Energy Agency (IRENA) [13]. Despite this lack of information, slope matters for developers. It influences construction costs and panels on steeper gradients may shade the next row, reducing yield.
Permissible slope for solar farms is influenced by government policy. To increase the chance that solar farms can be accommo-dated in the landscape, landform should beflat and close to signs of human development [48]. The emphasis on lack of slope is to minimise visual impact. Mixed land use comprising adjacent agri-cultural and industrial characteristics can be found in the UK e.g. a warehouse opposite a cornfield, but this classification is not captured in any land cover database, so this research focusses on the slope factor.
It may be seen that there is to some extent a misfit between available land, various policies, public opinion and solar developers. Government guidance prefersflat land butflat to gently sloping land is particularly suitable for mechanised farming. Government policy promotes the re-use of brownfield sites for solar farms but Section3.2.2finds that few of these are in fact suitable. Presence of human development is advocated for solar. This is more likely to be found on the edge of a settlement. It is therefore visible to resi-dential areas which may cause public reaction. Developers may prefer south-facing slopes for installation, due to the greater solar harvest. Despite their apparentfitness for use, these sites may be good agricultural land and of enhanced visibility [30].
This research calculates slope using GIS software and a 90 m gridded elevation model (SRTM) [49]. Slope is set a level which is as flat as possible to comply with government policy, whilst not excluding too much land. Land areas obtained by buffering un-constrained BSP and removing combined land use criteria (2.4.3) were investigated for slope practicality, to generate afinal list of sites most appropriate for large-scale solar construction.
3. Results and discussion
3.1. Phase one: selection and combination of land use criteria
The impact on available land of each individual criterion and their combined overlay is depicted inFig. 6.Fig. 7graphs the ca-pacity for solar farms available in the UK as each criterion is applied. A conversion factor of 2 ha of land (0.02 km2/5 acres) per MW is employed. It may be seen that the impact of each criterion is of the same order of magnitude. Obviously, the more criteria are applied, the smaller the resultant capacity.Fig. 7gives the impression that the potential capacity for solar farms in the UK is truly massive compared to that currently installed. However, the factor of avail-able transmission grid connection has not yet been examined (see Section3.2). When distance to BSP is investigated, the amount of capacity remaining after deduction of all seven exclusion criteria (3500 GW inFig. 7) falls markedly (2406 GW for 10 km or 479 GW for 2.5 km,Table 3).
3.2. Phase two: transmission network constraints
3.2.1. Consequences of distance to grid connection point and land use criteria
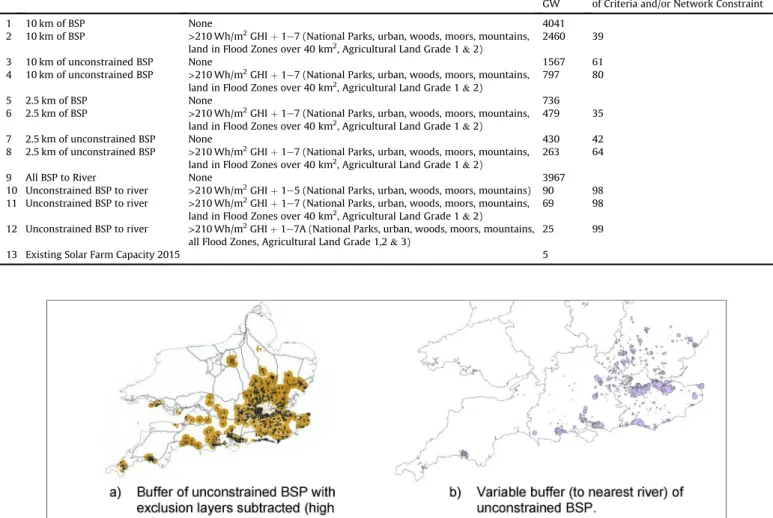
Example results of subtracting combined land use criteria from BSP distance buffers are illustrated inFig. 8. This reveals that the majority of potential capacity is located in the south and southeast, due to fewer network connection constraints in those areas. This is convenient to meet demand, since a large part of this is to be found in London and its environs [50].
Table 3details the effect of applying different BSP buffer dis-tances and land use criteria. It may be seen that applying land use criteria cuts down the amount of available capacity for buffered solar farms by 35% or 39%. Network constraints have an even greater impact and reduce potential solar capacity from BSP buffers by 42% or 61% depending on the size of buffer used. Eventual ca-pacity within a given buffer distance is 64% or 80% of the original value calculated from the distance buffer when both land use criteria and network connection constraints are applied.
3.2.2. Brownfield sites and distance to grid
GIS analysis (described in 2.3.1.1) discovered 22 brownfield sites within 10 km of unconstrained BSP. Visual inspection in Goo-gleEarth found that only 13 of these are in fact suitable for large-scale solar installations. The others are wooded, sloping, beach-front (salt spray), or have deep pits. Of the 13 potential sites, only two appeared particularly attractive to solar developers. These had adjacent solar farms and were crossed by 33 kV power lines. Many Corine dump sites were formerly used for gravel extraction. Due to lack of ecologicalfilling material, they are normally regenerated as leisure lakes e.g. yachting, course fishing or wetland nature reserves.
Although government policy advocates use of brownfield land for solar installation, this does not appear to be feasible. There are very few suitable brownfield sites within a reasonable distance of
unconstrained grid connection. This finding is in keeping with other authors who have reported that many UK brownfield sites cannot be used for large-scale solar [51].
3.3. Phase three: impact of slope on solar farm installation
Results obtained from the following procedures are illustrated inFig. 9and outlined inTable 4:
1. Apply a variable distance buffer (to nearest river) to uncon-strained BSP
2. Subtract combined land use criteria:
a. Case 1: 1e7eSolar yield>210 Wh/m2þNational Parks, ur-ban, woods, moors, mountains, land in Flood Zones over 40 km2, Agricultural Land Grade 1&2
b. Case 2: 1e7Ae Solar yield>210 Wh/m2 þNational Parks, urban, woods, moors, mountains, all Flood Zones, Agricul-tural Land Grade 1,2&3)
3. Select sites from the available land remaining above, minimising slope to obtain quantity of land required under various instal-lation scenarios (see below).
Future solar farm installation scenarios vary in size between sources. The Department of Energy and Climate Change (DECC) estimate is for 750 solar farms by 2020. (DECC was merged into the Department for Business, Energy and Industrial Strategy (DBEIS) in July 2016.) The Solar Trade Association (STA) has produced two scenarios: (1) 1800 solar farms and (2) 2300 solar farms, both to take place by 2020 [52]. The average size of solar farm in the REPD 2015 is 9 MW, so this equates to approximately 7 GW, 16 GW and 21 GW of ground-mounted solar installations, according to DECC/ STA scenario. 5 GW (578 solar farms) were already in existence in Fig. 6.Criteria for selection of land suitable for solar farm development and combination map.
2015, so this leaves 2 GW (172 farms), 11 GW (1222 farms) and 16 GW (1722 farms), respectively, to be installed by 2020.
Case 1 produces 497 sites with a maximum slope of 18before slope exclusions are applied. Case 2 produces 1388 sites with a maximum slope of 18before slope exclusions are applied. (N.B. 18 is the maximum gradient allowed for Agricultural Land Grades 1e4).
The results show that although the South of the UK is often perceived as fairlyflat, stringent slope criteria reduce the quantity of sites available for potential solar development by as much as 97%. However, even with the most stringent exclusion criteria applied (Case 1), the DECC and STA Minimum Ambition future scenarios appear achievable.
The 45 potential sites from the DECC scenario were converted to KML and examined in GoogleEarth. 4 sites are close to small towns, making them less suitable. 25 of the sites are located very close to the coast. Salt mist resistant panels are available but extra cleaning may be necessary. Three sites appear to be very appropriate, two of them due to existing solar development in the vicinity. The other is a former airfield. Manual checking of results is therefore very worthwhile, although the coastal proximity problem could be removed with an additional buffer. To make more land available
whilst minimising slope, the flood zones criterion could be removed from Case 1 because the necessity of this factor is debatable, as described previously. However, safeguarding against flooding would most likely add to costs.
Assuming the DECC (2 GW) scenario takes place, 72 MW of solar is scheduled for installation in 2016 and 2017 under the 2015 Contracts for Difference (CfD) auction [53]. This leaves 1928 MW to be constructed before 2020. Although this kind of growth has been seen previously under the RO scheme and Common Agricultural Policy, it now seems unlikely with the withdrawal of these sub-sidies. Thus it is not lack of land, but lack of monetary support which might result in predictions remaining unfulfilled.
Nevertheless, thefinancial situation for solar farm development is not as bad as it might be. The sites just identified as most suitable for solar farms are located in the south, southeast and east of the UK. These have mid-range arable rents (applicable to the east) and some of the lowest pasture rents in the UK [54]. Turning to a landowner's point of view, solar operators are willing to pay be-tween £600 and £1000 per acre every year [55]. Arable rents average£154 per acre and the average pasture rent is£107, so a solar installation is attractive from an economic standpoint. Table 3
Impact of various BSP buffer distances and exclusion criteria on potential capacity for solar farms GW in area of UK receiving>210 Wh/m2average hourly GHI.
Network Constraint Exclusion Criteria Capacity GW
% Reduction in Capacity by application of Criteria and/or Network Constraint
1 10 km of BSP None 4041
2 10 km of BSP >210 Wh/m2GHIþ1
e7 (National Parks, urban, woods, moors, mountains,
land in Flood Zones over 40 km2, Agricultural Land Grade 1&2)
2460 39 3 10 km of unconstrained BSP None 1567 61 4 10 km of unconstrained BSP >210 Wh/m2GHIþ1
e7 (National Parks, urban, woods, moors, mountains,
land in Flood Zones over 40 km2, Agricultural Land Grade 1&2)
797 80
5 2.5 km of BSP None 736
6 2.5 km of BSP >210 Wh/m2GHIþ1
e7 (National Parks, urban, woods, moors, mountains,
land in Flood Zones over 40 km2, Agricultural Land Grade 1&2)
479 35 7 2.5 km of unconstrained BSP None 430 42 8 2.5 km of unconstrained BSP >210 Wh/m2GHIþ1
e7 (National Parks, urban, woods, moors, mountains,
land in Flood Zones over 40 km2, Agricultural Land Grade 1&2)
263 64
9 All BSP to River None 3967
10 Unconstrained BSP to river >210 Wh/m2GHIþ1
e5 (National Parks, urban, woods, moors, mountains) 90 98
11 Unconstrained BSP to river >210 Wh/m2GHIþ1
e7 (National Parks, urban, woods, moors, mountains,
land in Flood Zones over 40 km2, Agricultural Land Grade 1&2)
69 98 12 Unconstrained BSP to river >210 Wh/m2GHIþ1
e7A (National Parks, urban, woods, moors, mountains,
all Flood Zones, Agricultural Land Grade 1,2&3)
25 99 13 Existing Solar Farm Capacity 2015 5
4. Conclusion
One of the goals of this study was to determine feasible locations for large-scale solar installations which satisfy physical, technical, environmental and geographical requirements, as well as imple-menting government policy and being economically viable. Bool-ean maps were created which demonstrate geospatial areas thatfit within chosen land use criteria. The effect of access to available grid connection and restrictions due to slope was then studied.
The selection of appropriate land use criteria for the UK is not easy because there is little previous work. Neither is there an agreed maximum distance to grid point. The location of existing solar installations is not much of a guide because government policy (on agricultural land) has changed recently. The choice of criteria is driven by data quality and availability, as well asfitness for purpose. This does skew results but cannot be avoided and simply reflects the base data available. Public Agricultural Land Classification maps do not differentiate between grade 3a or 3b. Solar construction is permitted on moderate quality 3b land, in addition to the poorer grades. However, the whole of the grade 3 class must be included or excluded in analysis. When excluded, and also examined for low slope, a large part of the remaining land comprises areas behind beaches, which are less suitable for photovoltaic installations.
The greatest impediment to utility-scale solar expansion in the UK is the solar energy resource. This removes two-thirds of the
British mainland from further investigation. The other land use criteria all carry about the same weight.
Official regulations dictate the number, sizes and locations of solar farms which will be established. Policy is produced by several bodies: central and local government, and DNOs. Central govern-ment produce guidelines which are implegovern-mented by local authority planners. The emphasis on avoiding high grade agricultural land is impactful. Even more significant is DNO stance on grid connection. Distributed generation connections to the network are still possible in constrained areas but there would need to be network upgrade or interruptible connection agreements. There is currently no incentive from central government for DNOs to increase connection possibilities.
Government policy on solar farm location is difficult to imple-ment. Brownfield land is recommended, but there is little available where grid connection is permitted. Flat land is advocated, as is the avoidance of high grade agricultural land. Yet the Ministry of Agriculture, Fisheries and Food Agricultural Land Classification categorises land partly according to slope. High grade land is of low slope (less than 7). Signs of human activity in an area increase the chances that a solar park will receive planning permission. Conversely, a solar installation should have little visibility, espe-cially from residential areas.
GIS proves to be a very useful tool for this analysis. Subsequent manual checking is required to identify both inappropriate loca-tions and reveal more advantageous ones. However, GIS does Fig. 9.Sites obtained from variable buffer of BSP and Case 1 exclusion criteria applied. Slope0.35. Background of gridded slope.
Table 4
Results of selecting various slopes from land available from variable BSP buffers and land use criteria. Exclusion
Criteria Case
Slope Number of 1 km2
Sites Detected
% Reduction in No. of sites by application of slope exclusion
Scenario met
Case 1: 1-7 <¼0.35/0.6% 45 91 DECC (2 GW)
Case 1: 1-7 <¼1/1.75% 218 56 STA Minimum Ambition (11 GW) Case 1: 1-7 <¼2.5/4.4% 334 33 STA Higher Ambition (16 GW)
Case 2: 1e7A <¼0.2/0.35% 41 97 DECC (2 GW)
Case 2: 1e7A <¼0.7/1.22% 225 83 STA Minimum Ambition (11 GW)
facilitate the automated elimination of many non-viable locations. Investigation on a national scale would be unmanageable without it.
Less suitable sites near to settlements and the coast were selected by the analysis. This could be improved by implementation of additional buffers. A 500 m buffer around residential areas has been used by previous authors [15,16,56]. In the marine environ-ment, sea spray, mist or fog can carry salt several miles inland, which makes installations at considerable distance subject to corrosion [57]. Transportation of sea spray depends on several geographical factors, such as wind, cliffs and weather. A simple buffer of the coastline could remove many potential sites unnec-essarily. Therefore, GIS analysis must be followed by an investiga-tion of local condiinvestiga-tions.
Another goal of this research is to ascertain how much of the land suitable for large-scale solar will actually be used for this purpose. It was found that the DECC Strategy Scenario for 2020 can be achieved, in terms of land availability, ifflood plains are utilised and low slopes e.g.<1, rather than zero slope. However, there is currently a lack offinancial incentive. Future CfD auctions would need more generous allocations than the 2015 auction for solar farms numbers to reach DECC targets.
This paper has examined large-scale solar site selection in a northern maritime climate. This climatic zone has its own partic-ular characteristics, divergent from regions with a higher solar resource. The influence of availability of network connection and policy decisions regarding slope were also investigated. It was found that any analysis failing to include these will overestimate potential land area for solar installations by 61e97% (Tables 3 and 4).
Acknowledgments
This work has been conducted as part of the research projects ‘PV2025 - Potential Costs and Benefits of Photovoltaic for UK Infrastructure and Society’and‘Joint UK-India Clean Energy Centre (JUICE)’which are funded by the RCUK's Energy Programme (con-tract no: EP/K02227X/1 and con(con-tract no: EP/P003605/1). The pro-jects funders were not directly involved in the writing of this article.
Appendix A. Supplementary data
Supplementary data related to this article can be found at https://doi.org/10.1016/j.renene.2018.08.109.
References
[1] Committee on Climate Change, Climate Change Act 2008, 2008.http://www. legislation.gov.uk/ukpga/2008/27/pdfs/ukpga_20080027_en.pdf. (Accessed 19 October 2017).
[2] Department of Energy&Climate Change, UK Renewable Energy Roadmap, 2011. https://www.rsb.org.uk/images/2167-uk-renewable-energy-roadmap-3.pdf. (Accessed 19 October 2017).
[3] DBEIS, National Statistics - Solar Photovoltaics Deployment 29 September 2016, 2016. https://www.gov.uk/government/statistics/solar-photovoltaics-deployment.
[4] E. Wesoff, S. Lacey, Solar Costs Are Hitting Jaw-dropping Lows in Every Region of the World, Greentech Media, GTM, 2017.https://www.greentechmedia. com/articles/read/solar-costs-are-hitting-jaw-dropping-lows-in-every-region-of-the-world#gs.dJNIsfk. (Accessed 19 October 2017).
[5] N. Chestney, Britain Follows Paris Deal with Cuts to Green SubsidiesjReuters, Reuters, 2015. http://uk.reuters.com/article/uk-britain-solar-idUKKBN0U00 OY20151217. (Accessed 2 December 2016).
[6] Department of Energy&Climate Change, in: Gregory Barker Speech to the Large Scale Solar Conference - Speeches - GOV.UK, 2013.https://www.gov.uk/ government/speeches/gregory-barker-speech-to-the-large-scale-solar-conference. (Accessed 2 December 2016).
[7] U.S. Department of Energy Sunshot, Final Report - Development of an Open Source Utility-scale Solar Project Siting Tool, Department of Energy, 2014,
p. 36.https://energy.gov/eere/sunshot/downloads/fi nal-report-development-open-source-utility-scale-solar-project-siting-tool. (Accessed 19 October 2017).
[8] B. Peery, R.S. Alessi, R. Lee, L. Vang, S. Brown, D. Solan, D.P. Ames, Enhancing user customization through novel software architecture for utility scale solar siting software, in: D.P. Ames, N.W.T. Quinn, A.E. Rizzoli (Eds.), Proc. 7th Int. Congr. Environ. Model. Softw., International Environmental Modelling and Software Society (IEMSs), San Diego, 2014.http://pvmapper.org/publication. html.
[9] J. Clifton, B. Boruff, Site Options for Concentrated Solar Power Generation in the Wheatbelt Final Report, 2010. http://www.wheatbelt.wa.gov.au/files/ 9413/9711/1915/Concentrated_Solar_Power_Generation_in_the_Wheatbelt_ Report.pdf.
[10] R. Mahtta, P.K. Joshi, A.K. Jindal, Solar power potential mapping in India using remote sensing inputs and environmental parameters, Renew. Energy 71 (2014) 255e262,https://doi.org/10.1016/j.renene.2014.05.037.
[11] E. Noorollahi, D. Fadai, M. Akbarpour Shirazi, S. Ghodsipour, Land suitability analysis for solar farms exploitation using GIS and fuzzy analytic hierarchy process (FAHP)da case study of Iran, Energies 9 (2016) 643,https://doi.org/ 10.3390/en9080643.
[12] M.L. Sabo, N. Mariun, H. Hizam, M.A. Mohd Radzi, A. Zakaria, Spatial energy predictions from large-scale photovoltaic power plants located in optimal sites and connected to a smart grid in Peninsular Malaysia, Renew. Sustain. Energy Rev. 66 (2016) 79e94,https://doi.org/10.1016/j.rser.2016.07.045.
[13] A.A. Merrouni, A.B. Mezrhab, A. Mezrhab, CSP sites suitability analysis in the eastern region of Morocco, Energy Procedia 49 (2013) 2270e2279,https:// doi.org/10.1016/j.egypro.2014.03.240.
[14] S. Mutlu, A. Çabuk, Y. Güney, GIS based site determination model for pro-ductive solar farm: a case study in Eskis¸ehir, Proc. Int. Offshore Polar Eng. Conf. 8 (2011) 499e505.
[15] M. Uyan, GIS-based solar farms site selection using analytic hierarchy process (AHP) in Karapinar region Konya/Turkey, Renew. Sustain. Energy Rev. 28 (2013) 11e17,https://doi.org/10.1016/j.rser.2013.07.042.
[16] J.J.W. Watson, M.D. Hudson, Regional Scale wind farm and solar farm suit-ability assessment using GIS-assisted multi-criteria evaluation, Landsc. Urban Plann. 138 (2015) 20e31,https://doi.org/10.1016/j.landurbplan.2015.02.001.
[17] R. Hott, GIS-based spatial analysis for large-scale solar power systems with respect to transmission, distribution and grid integration: case study of Wyoming, U.S, in: Proc. 41st Am. Sol. Energy Soc. Meet., Denver, 2012, pp. 13e17.https://www.researchgate.net/publication/262566355_GIS-based_ Spatial_Analysis_For_Large-Scale_Solar_Power_And_Transmission_Line_ Issues_Case_Study_Of_Wyoming_US.
[18] J. Brewer, D.P. Ames, D. Solan, R. Lee, J. Carlisle, Using GIS analytics and social preference data to evaluate utility-scale solar power site suitability, Renew. Energy 81 (2015) 825e836,https://doi.org/10.1016/j.renene.2015.04.017.
[19] P. Westacott, C. Candelise, A novel geographical information systems Framework to characterize photovoltaic deployment in the UK: initial evi-dence, Energies 9 (2016) 26,https://doi.org/10.3390/en9010026.
[20] ESRI, ArcGIS Desktop: Release, 10.3, 2014.www.arcgis.com.
[21] J. Harburn, Criteria checklist for Solar Farms in the UK - Solar Selections vol. 3, Sol. Sel., 2012. http://www.solarselections.co.uk/blog/solar-farms-in-the-uk-criteria-checklist. (Accessed 6 December 2016). Section 1.
[22] ESGP, ESGP» Solar Farm Site Identification, 2014. http://esgp.co.uk/ renewable-energy-site-identificatio/solar-farm-site-identification/. (Accessed 6 December 2016).
[23] URS, Solar Farms, Cambridgeshire, UK, 2013. Site Identification Report Zone 1
&2,http://plan.scambs.gov.uk/swiftlg/MediaTemp/1131812-502831.pdf.
[24] H. Shepherd-Cross, Requirements for a Solar Farm Site, n.d.http://www. haymakerenergy.co.uk/documents/SolarRequirements.pdf.
[25] Ordnance Survey, OS OpenData, 2010. https://www.ordnancesurvey.co.uk/ opendatadownload/products.html. (Accessed 6 December 2016).
[26] Natural England, Spatial Data Catalogue, (n.d.).http://environment.data.gov. uk/ds/catalogue/#/catalogue(accessed December 6, 2016).
[27] Magic, (n.d.). http://magic.defra.gov.uk/Dataset_Download_Summary.htm
(accessed December 6, 2016).
[28] Environment Agency, Flood Map for Planning (Rivers and Sea) - Flood Zone 2, (n.d.). http://environment.data.gov.uk/ds/catalogue/#/86ec354f-d465-11e4-b09e-f0def148f590(accessed December 6, 2016).
[29] P. Wolfe, Solar Photovoltaic Projects in the Mainstream Power Market: Philip Wolfe - Book2look, First, Routledge, Oxford, 2013.https://www.book2look. com/embed/9781136201646.
[30] BRE NSC, Planning Guidance for the Development of Large Scale Ground Mounted Solar PV Systems, 2013.http://www.solar-trade.org.uk/wp-content/ uploads/2015/05/BRE-Planning-Guidance-for-Solar-Farms.pdf.
[31] M. Burke, Report Number 07434.Solar Farms: Funding,planning and Impacts, 2015. London, http://researchbriefings.parliament.uk/ResearchBriefing/ Summary/CBP-7434.
[32] B. Cole, S. King, B. Ogutu, D. Palmer, G. Smith, H. Balzter, Corine Land Cover 2012 for the UK, Environmental Information Data Centre, Jersey and Guern-sey, 2015.http://doi.org/10.5285/32533dd6-7c1b-43e1-b892-e80d61a5ea1d. [33] J. Scurlock, NFU Briefing: Solar Photovoltaic Electricity in Agricultureeon
Your Roofs and in Your Fields, 2011. https://www.nfuonline.com/assets/ 21480.
[34] Google Inc, Google Earth Pro, 2018, Version 7.3.1.4507.https://www.google. com/earth/download/ge/.
[35] R. Gottschalg, T. Betts, P. Westacott, P. Leicester, C. Candelise, D. Palmer, P. Rowley, Multi-domain analysis of photovoltaic impacts via integrated spatial and probabilistic modelling, IET Renew. Power Gener. 9 (2015) 424e431,https://doi.org/10.1049/iet-rpg.2014.0374.
[36] D. Palmer, I. Cole, T. Betts, R. Gottschalg, Interpolating and estimating hori-zontal diffuse solar irradiation to provide UK-wide coverage: selection of the best performing models, Energies 10 (2017) 181,https://doi.org/10.3390/ en10020181.
[37] UK Met Office, MIDAS: Global Radiation Observations, NCAS British Atmo-spheric Data Centre, 2006.http://catalogue.ceda.ac.uk/uuid/b4c028814a666a 651f52f2b37a97c7c7. (Accessed 17 August 2016).
[38] D. Palmer, E. Koubli, I. Cole, T. Betts, R. Gottschalg, Satellite or ground-based measurements for production of site specific hourly irradiance data: which is most accurate and where? Sol. Energy 165 (2018) 240e255,https://doi.org/ 10.1016/j.solener.2018.03.029.
[39] M. Suri, T. Cebecauer, Satellite-based solar resource data: model validation statistics versus user’S uncertainty, in: ASES Sol. 2014 Conf, 2014, pp. 7e9. http://geomodelsolar.eu/_docs/papers/2014/Suri-Cebecauer– ASES-Solar2014–Satellite-Based-Solar-Resource-Data– Model-Validation-Statistics-Versus-User-Uncertainty.pdf.
[40] SSEPD, Generation availability map, scottish south, Energy Power Distrib. (2015) 1e2.https://www.ssepd.co.uk/GenerationAvailabilityMap/?mapareaid
¼1. (Accessed 30 September 2016).
[41] UKPN, UK Power Networks, 2013. http://www.ukpowernetworks.co.uk/. (Accessed 4 May 2017).
[42] WPD, Western Power Distribution - Network Capacity Map, 2013.http:// www.westernpower.co.uk/Connections/Generation/Network-Capacity-Map. aspx. (Accessed 4 May 2017).
[43] Western Power Distribution, Distributed Generation EHV Constraint Maps, 2016. https://www.westernpower.co.uk/Connections/Generation/Generation -Capacity-Map/Distributed-generation-EHV-constraint-maps.aspx. (Accessed 9 December 2016).
[44] S. Halsey, UK Power Networkse3 October 2013 Distributed Generatione
Customer Experience Workshop, 2013. https://www.ukpowernetworks.co. uk/internet/en/our-services/documents/Distributed_Generation_Customer_ Experience_Workshop_Presentation_3_October_2013.pdf.
[45] Directive 2003/54/EC of the European Parliament and of the Council of 26 June 2003e, 2003.http://eur-lex.europa.eu/legal-content/en/TXT/?uri¼CELEX :32003L0054.
[46] K.L. Anaya, M.G. Pollitt, Finding the Optimal Approach for Allocating and
Realising Distribution System Capacity: Deciding between Interruptible Connections and Firm DG Connections, 2013, pp. 1e23.http://www.eprg. group.cam.ac.uk/wp-content/uploads/2013/12/1320-NTS1.pdf.
[47] K.L. Anaya, M.G. Pollitt, Going smarter in the connection of distributed gen-eration, Energy Pol. 105 (2017) 608e617, https://doi.org/10.1016/ j.enpol.2017.01.036.
[48] Natural England, Technical Information Note on Solar Farms, 2011.http:// webarchive.nationalarchives.gov.uk/20150902172007/http://publications. naturalengland.org.uk/publication/32027.
[49] A. Pope, SRTM Slope DEM for Great Britain, Sharegeo Open, 2010.http://www. sharegeo.ac.uk/handle/10672/7. (Accessed 14 December 2016).
[50] National Grid, Electricity Ten Year Statement (ETYS), National Grid, 2015.
http://www2.nationalgrid.com/UK/Industry-information/Future-of-Energy/ Electricity-Ten-Year-Statement/. (Accessed 30 September 2016).
[51] C. Early, Not enough brownfield land for solar farms, developer claims, Plann. Resour. Plann. (2013) 1e2. http://www.planningresource.co.uk/article/ 1207865/not-enough-brownfi
eld-land-solar-farms-developer-claims#disqus_thread.
[52] Solar Trade Association, The Solar Independence Plan for Britain - Blueprint for a New Government, 2015. http://www.solar-trade.org.uk/wp-content/ uploads/2015/06/STA-Solar-Independence-Plan-v8-EMBARGOED-0001-08062015.pdf.
[53] T (LCP) Porter, What Next for UK Auctions of Renewable Contracts for Dif-ference?, 2015. https://www.frontier-economics.com/documents/2015/03/ lcp-frontier-economics-next-uk-auctions-renewable-contracts-difference. pdf.
[54] RICS RAU, RICS_RAU Farmland Market Survey of Land Prices H2-2014, 2014. Cirencester, https://www.rics.org/uk/knowledge/market-analysis/ricsrau-rural-land-market-survey-h2-2013/.
[55] Global Renewables (UK) Ltd, Solar PV for land ownersjEnergy shouldn't cost the earth, (n.d.). http://www.gr-uk.co.uk/Solar-farm-land-needed(accessed December 15, 2016).
[56] C. Perpina Castillo, F. Batista e Silva, C. Lavalle, An assessment of the regional~
potential for solar power generation in EU-28, Energy Pol. 88 (2016) 86e99, https://doi.org/10.1016/j.enpol.2015.10.004.
[57] B.H. Chudnovsky, Electrical Power Transmission and Distribution: Aging and Life Extension Techniques, Illustrate, CRC Press, 2012.https://www.crcpress. com/Electrical-Power-Transmission-and-Distribution-Aging-and-Life-Extension/Chudnovsky/p/book/9781466502468.