Robust Multichannel Equalization
for Blind Speech Dereverberation
by
Sze Chie (Felicia) Lim
A thesis submitted in fulfilment of requirements for the degree of Doctor of Philosophy of Imperial College London
Communications and Signal Processing Group Department of Electrical and Electronic Engineering
Imperial College London 2016
3
Copyright declaration
c b n d
The copyright of this thesis rests with the author and is made available under a Creative Commons At-tribution Non-Commercial No Derivatives licence. Researchers are free to copy, distribute or transmit the thesis on the condition that they attribute it, that they do not use it for commercial purposes and that they do not alter, transform or build upon it. For any reuse or redistribution, researchers must make clear to others the licence terms of this work.
5
Statement of originality
I declare that this thesis and the research it contains are the product of my own work under the guidance of my thesis supervisor, Dr Patrick A. Naylor. Any ideas or quotations from the work of other people, published or otherwise, are fully acknowledged in accordance with the standard referencing practices. The material of this thesis has not been submitted for any degree at any other academic or professional institution.
7
Abstract
Acoustic reverberation arises from the reflection of sound waves within an enclosed space. It is generally desirable in music reproduction but can be detrimental to speech-related applications. For the human listener, while the early reflections help to improve speech intelligibility, the late reflections have been shown to impair perceived speech quality. For speech processing technologies such as automatic speech recognizers, reverberation reduces accuracy and performance. Dereverberation is therefore an important research topic with interest driven by increasing availability of communication devices and consumer demand.
One approach to dereverberation computes a set of equalizing filters that are used to perform the dere-verberation processing, given multichannel inputs and estimates of the acoustic impulse responses (AIRs) between the source signal and microphones. However, estimation errors are inevitable in practice and therefore robust channel equalizers are required. This thesis aims to develop such robust algorithms in a manner that is desirable specifically for speech dereverberation. The framework of channel shortening is used, having been previously shown to give promising results. Subband approaches are also investi-gated to reduce the computational complexity and achieve finer control of dereverberation in separate frequency bands.
A second approach to dereverberation steers the look direction of beamformers towards the source. Reverberant sounds from other directions are treated as noise and accordingly suppressed. The motiva-tion behind beamformer design and channel equalizamotiva-tion is similar and in this work, a unified framework termed MINTFormer is proposed. The aim is to combine the robustness of beamformers with the po-tentially perfect dereverberation ability that can be achieved by channel equalization approaches.
9
Acknowledgement
First and foremost, I would like to thank my supervisor, Patrick Naylor, for encouraging me to undertake this PhD and for his support throughout. I appreciate the time and guidance he has given me over the years that have shaped my research and growth as a researcher.
I am very grateful to my friends and colleagues Mark Thomas, Wancheng Zhang, Emanu¨el Habets and Nikolay Gaubitch for their help with my research and for the collaborative research opportunities. I have learnt a lot from their constructive feedback and valuable insights into acoustic signal processing.
I would like to additionally thank Mark for hosting me as an intern researcher for three months at Microsoft Research. During my time there, I was able to explore exciting research areas and peer into the world of research in industry.
My time as a PhD student would not have been as interesting and enjoyable without my friends. I thank them for all their support and company.
Last but not least, I am eternally grateful to my family for their unconditional support in everything that I do.
11
Contents
Copyright declaration 3 Statement of originality 5 Abstract 7 Acknowledgement 9 Contents 11 Acronyms 15 List of Figures 19 List of Tables 23 List of symbols 25 Chapter 1. Introduction 33 1.1 Motivation . . . 33 1.2 Research statement . . . 35 1.3 Original contributions . . . 35 1.4 Publications . . . 36 1.5 Thesis outline . . . 37Chapter 2. Background and literature review 39 2.1 A reverberant system . . . 39
2.2 Room acoustics . . . 41
2.2.2 Energy decay curve . . . 42
2.2.3 Reverberation time . . . 43
2.2.4 Critical distance . . . 44
2.2.5 Acoustic impulse response models . . . 44
2.2.6 Normalized projection misalignment . . . 45
2.3 Subjective dereverberation measures . . . 45
2.4 Objective dereverberation measures . . . 46
2.4.1 Direct-to-reverberant ratio . . . 47
2.4.2 Log spectral distance . . . 47
2.4.3 Itakura-Saito and Itakura distances . . . 48
2.4.4 Perceptual evaluation of speech quality (PESQ) . . . 49
2.5 Overview of dereverberation approaches in the literature . . . 50
2.5.1 Linear-prediction residual enhancement . . . 50
2.5.2 Prediction based dereverberation . . . 51
2.5.3 Spectral enhancement . . . 52
2.5.4 Homomorphic filtering . . . 53
2.5.5 Spatial processing . . . 53
2.5.6 Acoustic channel estimation and equalization . . . 55
2.6 Conclusion . . . 58
Chapter 3. Statistical modelling of system identification errors 59 3.1 Introduction . . . 59
3.2 Supervised system identification errors . . . 60
3.3 Overview of a robust blind system identification algorithm . . . 61
3.4 A study of the BSIE coefficients . . . 64
3.5 Proposed BSIE model . . . 66
3.6 Validation of the proposed models . . . 68
3.7 Conclusions . . . 74
Chapter 4. Relaxed channel shortening methods for speech dereverberation 75 4.1 Introduction . . . 75
4.2 Problem formulation . . . 77
Contents 13
4.3.1 General channel shortening solutions . . . 78
4.3.2 Multiple-input/output inverse theorem (MINT) . . . 80
4.3.3 Relaxed multichannel least squares (RMCLS) . . . 80
4.4 Proposed robust multichannel equalizers . . . 81
4.4.1 RMCLS with constrained initial coefficients . . . 81
4.4.2 RMCLS with envelope constraint . . . 82
4.5 MISOp-norm reshaping algorithm . . . 86
4.6 Experimental results . . . 88
4.6.1 Experiment setup and performance measures . . . 88
4.6.2 Determining a suitable length forLcic . . . 89
4.6.3 Evaluating the proposed algorithms with WGN SIEs . . . 91
4.6.4 Evaluating the proposed algorithms with GMM-based SIEs . . . 93
4.6.5 White noise gain of the equalizers . . . 97
4.7 Conclusion . . . 97
Chapter 5. Subband approaches to relaxed channel shortening 101 5.1 Introduction . . . 101
5.2 Subband implementation . . . 102
5.2.1 Subband analysis and synthesis filters . . . 102
5.2.2 Subband decomposition of the AIRs . . . 104
5.3 Multichannel equalization in subbands . . . 106
5.4 Computational considerations . . . 108
5.5 Performance of subband equalizers . . . 109
5.6 Controlled relaxation in subbands . . . 110
5.6.1 Subband NPM . . . 111
5.6.2 Gated RMCLS . . . 113
5.6.3 Variable relaxation RMCLS . . . 113
5.7 Simulations and results . . . 117
5.7.1 Simulation 1: evaluating G-RMCLS . . . 118
5.7.2 Simulation 2: evaluating VR-RMCLS . . . 120
Chapter 6. A unified framework between channel equalization and spatial filtering 125 6.1 Introduction . . . 125 6.2 Problem formulation . . . 126 6.3 MINT . . . 129 6.4 Filter-and-sum beamformer (FSB) . . . 129 6.5 MINTFormer . . . 131
6.6 White noise gain . . . 133
6.7 Frequency domain considerations . . . 135
6.8 Simulations . . . 136
6.9 Conclusion . . . 140
Chapter 7. Conclusions 143 7.1 Summary of thesis achievements . . . 143
7.2 Future research directions . . . 146
15
Acronyms
AIR acoustic impulse response
ASR automatic speech recognition
BIC Bayesian information criterion
BSIE blind system identification error
BSI blind system identification
CDF cumulative distribution function
DoA direction of arrival
DFT discrete Fourier transform
DRR direct-to-reverberant ratio
EDC energy decay curve
EIR equalized impulse response
FIR finite impulse response
FPE flattening point estimation
FSB filter-and-sum beamformer
GCC generalized cross corelation
GDFT generalized discrete Fourier transform
GMM Gaussian mixture model
GSC generalized sidelobe canceller
GWPE generalized weighted prediction error
HOS higher order statistics
IDFT inverse discrete Fourier transform
IIR infinite impulse response
ITU-T International Telecommunications Union
LCMV linearly constrained minimum variance
LP linear prediction
LTASS long-term average speech spectrum
MCLMS multichannel least mean squares
MCN multichannel Newton
MIMO multiple-input multiple-output
MINT multiple-input/output inverse theorem
MINT-SB MINT in subbands
MISO multiple-input single-output
MMSE minimum mean square error
MOS mean opinion score
MVDR minimum variance distortionless response
NMCFLMS normalized multichannel frequency domain least mean squares
NPM normalized projection misalignment
OM-LSA optimally modified log spectral amplitude
PDF probability density function
PESQ perceptual evaluation of speech quality (ITU-T P.862)
Acronyms 17
PSD power spectral density
RMCLS relaxed multichannel least squares
RMCLS-SB RMCLS in subbands
R-CIC RMCLS with constrained initial coefficients
R-EC RMCLS with envelope constraint
SIE system identification error
SIMO single-input multiple-output
SISO single-input single-output
SOS second order statistics
SNR signal-to-noise ratio
STFT short time Fourier transform
RNMCFLMS robust NMCFLMS
SRMR speech to reverberation modulation energy ratio
ULA uniform linear array
WGN white Gaussian noise
WNG white noise gain
WPE weighted prediction error
19
List of Figures
1.1 Caption for LOF . . . 34
2.1 Structure of anAIRdepicting the three regions: direct path, early reflections and late reverberant tail. . . 42
2.2 Example of anAIR(top) and its corresponding energy decay curve (EDC) (bottom). . . . 43
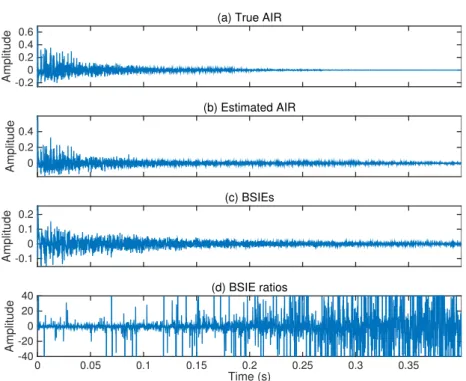
3.1 An example of coefficients in the first channel of (a) a trueAIR,h1, (b) the normalized
AIRestimated using robust NMCFLMS (RNMCFLMS),βNPMhˆ
1, (c) the resultant blind
system identification errors (BSIEs),ξ1, and (d) the correspondingBSIEratios,Ξ1. . . 65
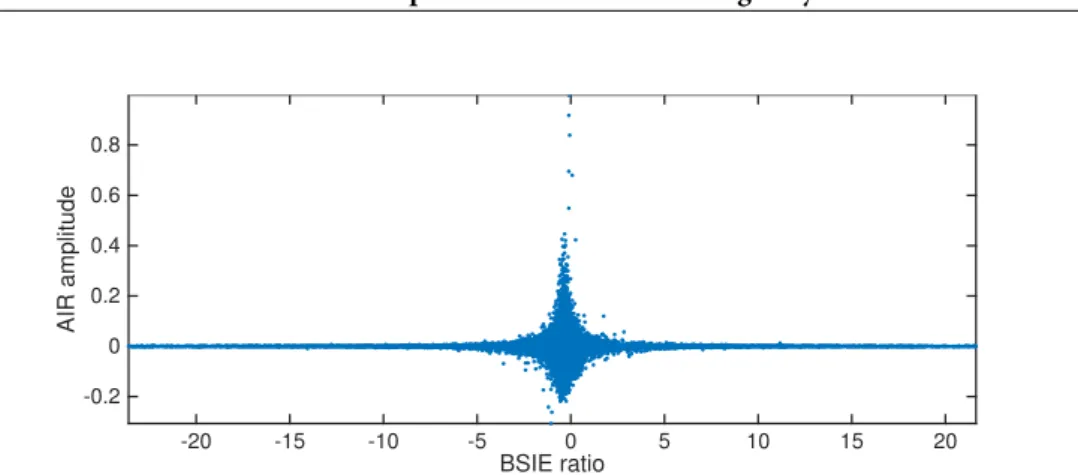
3.2 An example of the joint distribution between theAIRcoefficient amplitudes and their
BSIEratios. . . 66
3.3 Model selection metrics over a range ofNGGaussian mixture model (GMM) components
for four acoustic scenarios simulated using the image method: (a) Bayesian information criterions (BICs) and (b) log-likelihood of theGMMparameters averaged overC = 5
cross-validation sets. . . 69
3.4 Model selection metrics over a range ofNGGMMcomponents for MARDYAIRs: (a)
BICs and (b) log-likelihood of theGMMparameters averaged overC=5 cross-validation sets. . . 69
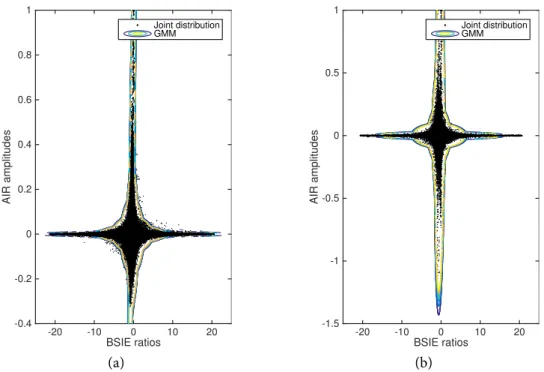
3.5 Example best-fitGMMmodels obtained withNG =20 for (a) image methodAIRs with
SNR=15 dB andT60=400 ms and (b) MARDYAIRs with SNR=15 dB. . . 70
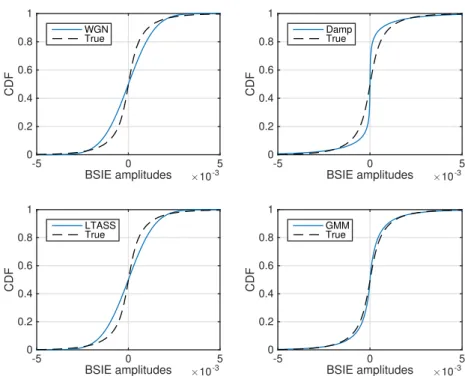
3.6 cumulative distribution function (CDF) plots for each of the system identification error (SIE) models considered, compared against the trueBSIEs. . . 71
3.7 Boxplots of the Kolmogorov-Smirnov statistic for the differentSIEmodels considered. . . 72
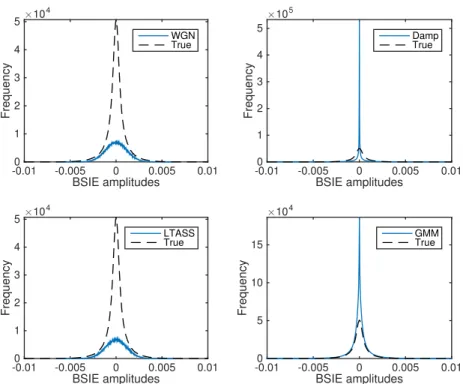
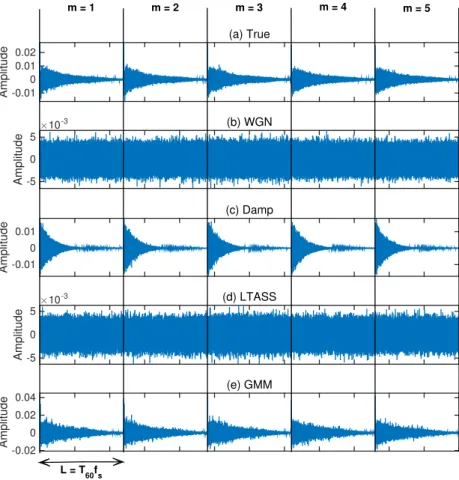
3.9 An example of the true multichannel concatenatedBSIEs against the four models con-sidered. . . 73
4.1 Example equalized impulse response (EIR) obtained from relaxed multichannel least squares (RMCLS) using perfect knowledge of theAIR. . . 81
4.2 The structure of the desired RMCLS with envelope constraint (R-EC) impulse response. . 83
4.3 AveragedEDCs for different values ofLcicfor RMCLS with constrained initial coefficients (R-CIC) with NPM= −33 dB,T60=250 ms. . . 90
4.4 ∆Iand ∆PforR-CICas a function ofLcicwith NPM= −33 dB andT60=250 ms. The
black dots in white circles indicate the median, the thick bars mark the lower and upper quartile, and the thin vertical line represents the range of the remaining data up to±1.5 times the interquartile range. In the case whereLcic=1, theRMCLSsolution is obtained. 90
4.5 AveragedEDCs for different values ofLcicforR-ECwith NPM= −33 dB,T60=250 ms. . 91
4.6 ∆Iand ∆PforR-ECas a function ofLcicwith NPM= −33 dB andT60=250 ms. . . 92
4.7 Comparing averagedEDCs for all algorithms. . . 94
4.8 Comparing ∆Iand ∆Pvalues for all algorithms. . . 95
4.9 EDCs, ∆Iand ∆Presults for long-term average speech spectrum (LTASS) shapedSIEs, with NPM= −33 dB andT60=400 ms. . . 96
4.10 White noise gain averaged in each octave band. . . 98
5.1 System diagrams for (a) a full-bandAIRfiltering process and (b) its subband approximation.103
5.2 System diagram for the design and application of multichannel equalizing filters in sub-bands. . . 107
5.3 AveragedEDCs for full-band multiple-input/output inverse theorem (MINT) andRMCLS, and their subband counterparts. ArtificialSIEs were generated by addition of white Gaus-sian noise (WGN) and scaled to NPM= −33 dB. . . 110
5.4 Condition numbers for full-bandMINTandRMCLS, and their subband counterparts. . . 111
5.5 Relationship between fullband signal-to-noise ratio (SNR) and averaged normalized pro-jection misalignment (NPM) between true and estimated channels given byRNMCFLMS. 112
5.6 Relationship between subbandSNRand subbandNPM. The subbandNPMvalues were computed from channels that have been estimated usingRNMCFLMS. . . 114
5.7 AveragedEDCs in different subbands for differentNPMvalues. TheLwvalues in the
List of Figures 21
5.8 AveragedEDCs for RMCLS in subbands (RMCLS-SB) with differentNPMvalues. . . 118
5.9 AvaragedEDCs forRMCLSfull-band,RMCLS-SBand gated subband RMCLS (G-RMCLS). The gating threshold value of NPMt= −11 dB was used forG-RMCLSand oracle
knowl-edge of the subbandNPMvalues was assumed. . . 119
5.10 ∆P results for RMCLSfull-band, RMCLS-SBand G-RMCLS. The value of NPMt = −11 dB was used forG-RMCLSand oracle knowledge of the subbandNPMvalues was
assumed. . . 120
5.11 AveragedEDCs forRMCLSfull-band,RMCLS-SB,G-RMCLSand variable relaxation RMCLS (VR-RMCLS). . . 122
5.12 ∆Presults forRMCLSfull-band,RMCLS-SB,G-RMCLSandVR-RMCLS. . . 123
6.1 Acoustic setup, where the black crosses (×) denote the microphones, the blue circles (○) are the source locations and the filled blue circle (●) is the desired source. . . 137
6.2 The blue solid lines indicate the white noise gain (WNG) of MINTFormer filters designed with a minimumWNGconstraint of−40 dB. The orange dashed lines indicate theWNG
of equalizing filters designed withoutWNGconstraints. Settingγ=0 yields theMINT
filters and settingγ=1 gives the filter-and-sum beamformer (FSB) filters. . . 138
6.3 MINTFormer beampatterns, in dB. Settingγ=0 yields theMINTfilters and settingγ=1 gives theFSBfilters. . . 139
6.4 NPM(dB) of theAIRs at perturbed source locations. The black crosses (×) mark the location of the microphones. . . 140
6.5 MINTFormer perceptual evaluation of speech quality (ITU-T P.862) (PESQ) scores for perturbed source locations. Settingγ=0 yields theMINTfilters and settingγ=1 gives
23
List of Tables
4.1 Final number of unconstrained coefficients in the early reflections region ofR-ECfor four different simulation setups. The length of the early reflections region isLw=50 ms,
or 400 coefficients at a sampling frequency of 8 kHz. . . 93
5.1 Averaged runtimes forRMCLS,RMCLS-SBandG-RMCLS, as measured by MATLAB’s
cputimefunction. . . 118
5.2 Example of trained subband relaxed window lengths forVR-RMCLSwhen NPM= −30 dB. 121
5.3 Averaged runtimes forRMCLS,G-RMCLSandVR-RMCLS, as measured by MATLAB’s
25
List of symbols
Notation
x scalar quantity x vector quantity X matrix quantity ˆ x estimate ofxOperators
x∗y linear convolution {⋅}∗ complex conjugate {⋅}H Hermitian transpose{⋅}T non-conjugate vector/matrix transpose {⋅}+ Moore-Penrose pseudo-inverse {⋅}↓K K-factor downsampling operation
⌈⋅⌉ ceiling operator
⌊⋅⌋ floor operator
diag{⋅} diagonal operator
∖ exclusion operator
⊂ subset operator
∥⋅∥p ℓp-norm operator
⊙ element-wise multiplication
⊗ Kronecker product operator
F {⋅} discrete Fourier transform (DFT) operator
F−1{⋅} inverse discrete Fourier transform (IDFT) operator
L(⋅) likelihood function
P (x) probability ofx
Symbols and variables
a EIRenvelope constraint
b subband index
B number of subbands
cs speed of sound
c channel shortening linear combination vector
C number of cross-validation sets
dm distance betweeen the first andm-th sensor in a uniform linear array d desiredEIRwith an arbitrary direct path delay
dτ=0 desiredEIRwithout any direct path delay
drc desiredEIRwith constrained initial coefficients
d′ subband desiredEIR
d
(f) desiredEIRin the frequency domain emm′(n) cross-relationBSIEerroremm′(nb) block error signal cross-relationBSIEerror at block time indexnb
e
mm′(n) DFTof the cross-relationBSIEerrorf frequency index
fs sampling frequency
F number ofDFTpoints
gm equalizing filter at channelm
g stacked multichannel equalizing filters g′
b subband multichannel equalizing filters at subbandb
g
m(f) equalizing filter at channelmin the frequency domaing
(f) stacked multichannel equalizing filter in the frequency domainGm convolution matrix of the equalizing filter at channelm G convolution matrix of the multichannel equalizing filters
List of Symbols 27
hm AIRat channelm
h stacked multichannelAIRs
ˆ
h′m,b approximate subbandAIRat channelmand subbandb
h⇣m
,b true subbandAIRat channelmand subbandb
⃗
hq,m anechoicAIRfrom directionqat channelm ˇ
hq,m reverberantAIRfrom directionqat channelm
ˆ
h
m(n) DFTof theAIRat channelmˆ
h
(n) DFTof theAIRstacked over all channels ⃗h
q(f) anechoic multichannelAIRs from directionqin the frequency domainˇ
h
q(f) reverberant multichannelAIRs from directionqin the frequency domain Hm(z) AIRat channelmin thez-domainH′m,b(z) approximate subbandAIRat channelmand subbandbin thez-domain
Hm convolution matrix of theAIRat channelm
H convolution matrix of the multichannelAIRs
Hd,Hu desired and undesired partitions of the multichannelAIRconvolution matrix ˆ
H′m
,b convolution matrix of the approximate subbandAIRat channelmand subbandb ˆ
H′b convolution matrix of the multichannel approximate subbandAIRat subbandb ⃗
Hq convolution matrix of the multichannel anechoicAIRs from directionq
ˇ
Hq convolution matrix of the multichannel reverberantAIRs from directionq ⃗
H convolution matrix of the multichannel anechoicAIRs stacked over all look direc-tions
ˇ
H convolution matrix of the multichannel reverberantAIRs stacked over all look di-rections
˚
H MINTFormer hybrid convolution matrix stacked over all channels and look direc-tions
ˇ
H
(f) reverberant multichannelAIRs stacked over all directions in the frequency domain ⃗H
(f) anechoic multichannelAIRs stacked over all directions in the frequency domain˚
H
MINTFormer hybrid convolution matrix stacked over all channels and look direc-tions in the frequency domaini discrete index
j complex number (j2
= −1)
l iteration number
L AIRlength
Lcic number of constrained initial coefficients
Li equalizing filter length
Luic number of unconstrained initial coefficients in anAIR
Lw relaxed window length
Lpr prototype filter length for the generalized discrete Fourier transform (GDFT) filter-bank
L′ approximate subbandAIRlength
L⇣ true subbandAIRlength
L′i subband equalizing filter length
L′w,b subband relaxed window length at subbandb L′w
o,b
pre-trained subband relaxed window length at subbandb m acoustic channel or microphone index
M number of acoustic channels or microphones
n time index
nb time block index
NPMt NPMthreshold for theG-RMCLSalgorithm
om joint observations betweenhmand the correspondingBSIEs at channelm
O multichannel joint observations betweenhand the correspondingBSIEs
q look direction index
Q number of look directions
r EIR
r′
b subbandEIR
⃗
r anechoicEIRs stacked over all look directions ˇ
r reverberantEIRs stacked over all look directions
⃗
r
(f) anechoicEIRs stacked over all look directions in the frequency domainˇ
r
(f) reverberantEIRs stacked over all look directions in the frequency domains(n) clean speech
T60 reverberation time
ub(i) GDFTfilterbank analysis filters at subbandband samplei ub(i) GDFTfilterbank synthesis filters at subbandband samplei
List of Symbols 29
upr(i) prototype filter for theGDFTfilterbank at samplei
Ub(z) GDFTfilterbank analysis filters at subbandbin thez-domain
Ub(z) GDFTfilterbank synthesis filters at subbandbin thez-domain Upr(z) prototype filter for theGDFTfilterbank in thez-domain
Ub convolution matrix of the downsampled analysis filters at subbandb vm(n) background noise at microphonem
v(n) multichannel background noise
w weighting function applied to the designedEIR
wd,wu window function for the desired and undesired regions of theAIR
wrc weighting function applied to the designedEIRwith constrained initial coefficients
w′ subband weighting function
Wb
B frequency shift term for subband channel shortening W diagonal matrix of the weighting functionw
Wrc diagonal matrix of the weighting functionwrc W′ diagonal matrix of the subband weighting functionw′ xm(n) captured signal at microphonem
x(n) stacked multichannel microphone signals x′m
,b(n) subband clean reverberant signal at microphonemand subbandb
Xm(nb) circulant matrix of the captured signal at microphonem
ymm′ circular convolution signal between the captured signal at microphonemand the
AIRat channelm′
y′m,b(n) subband noisy and reverberant signals at microphonemand subbandb
z z-domain index
α(i) exponentially decaying envelope of anAIR β scaling factor for theEIRenvelope constraint
βNPM NPMscaling factor
γ independent mixing parameter for MINTFormer Γ(i) zero-mean stationary Gaussian random process
∆I difference between the Itakura distances of equalized speech and reverberant speech ∆P difference between thePESQscores of equalized speech and reverberant speech
εω transition bandwidth of theGDFTfilterbank prototype filter
θq angle of arrival
θGMM GMMparameters
κ arbitrary scale factor at the output of aGDFTfilterbank with perfect reconstruction
λ eigenvalues for the channel shortening generalized eigenvalue problem ΛFSB Lagrange multiplier for theFSBin the time domain
ΛFSB Lagrange multiplier for theFSBin the frequency domain
µ adaptation step-size
ξm normalizedSIEs at channelm
ξ multichannel normalizedSIEs
Ξm BSIEratios at channelm
Ξ multichannelBSIEratios
ρ MINTFormer regularization parameter
σ2
v variance ofWGN
¯
Σi covariance of thei-thGMMcomponent
τ0 direct path delay in theAIR
τ arbitrary delay in theEIR
τsb arbitrary delay at the output of aGDFTfilterbank with perfect reconstruction
Υ Fourier transform vector
φ MINTFormer tolerance factor
Ψ WNGconstraint
ωf frequency at indexf
0[L×1] vector of zeros of lengthL
33
Chapter 1
Introduction
1.1
Motivation
The use of speech-based technology in communication systems has increased signficantly in recent years, fueled by a rapid growth in the market for consumer communication devices and global investments in telecommunication infrastructure. The use of portable devices, such as smartphones, tablets and laptops, for phone or conference calls is now taken for granted in most parts of the world. Human interaction with machines through the natural medium of speech is becoming increasingly commonplace as a result of advances in speech recognition and natural language processing algorithms. Practical implementations have already made their way into home entertainment and automation systems, in-car control systems, personal digital assistants and increasingly, robots.
In many of these systems, the speaker is at some distance from the microphones and the captured speech signals are degraded by the surrounding acoustic environment. This can be in the form of back-ground noise, interfering speakers or acoustic reverberation. The further the speaker is from the mi-crophone, the more significant the degradation becomes. Consequently, the perceived quality of speech suffers and in severe cases of degradation, speech intelligibility is reduced, particularly with the addi-tion of noise. The key interest to this thesis is the effect of acoustic reverberaaddi-tion on the captured speech signals, and how this reverberation may be reduced.
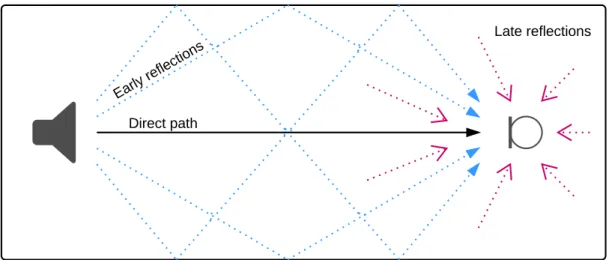
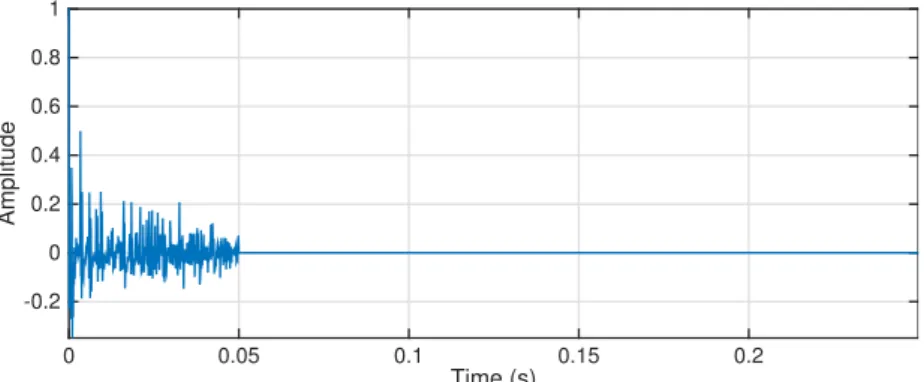
Acoustic reverberation is caused by the propagation of sound waves through a multipath acoustic channel and reflection off surfaces within the environment, as shown in Fig.1.1. The resultant signal cap-tured at the microphone is a superposition of delayed and attenuated copies of the clean speech signal, causing temporal smearing. Additionally, spectral smearing occurs due to the frequency-dependent
re-Figure 1.1: Reverberation process in a room. The reflections can be considered in three parts – the direct path signal between the source and microphone, the early reflections and the subsequent late reflections1.
flectivity of surfaces, quantified by their reflection coefficients, and the sound-absorbing properties of air. These give rise to a perception of space and distance in audio recordings and can be described as [1]:
1. The box effect– where the apparent arrival of the source from multiple directions at different times with different intensities creates a sense of space and gives the impression of the speaker being “inside a box”.
2. The distant talker effect– where the speaker is perceived to be far away from the microphone.
In music audio processing, carefully controlled reverberation (whether naturally occurring or artifi-cially added) is desirable as it creates a sense of natural space and realism, improving the music listening experience. In speech-related applications for the human listener, early reflections arriving immediately after the direct path have been shown to improve speech intelligibility by perceptually reinforcing the di-rect path [1]. However, the late reflections negatively impact the perceived quality of speech. When severe reverberation is present in conjunction with background noise, the positive effect of the early reflections is no longer dominant and the severe distortion of the speech signal results in reduced intelligibility, es-pecially for hearing-impaired or elderly people [2]. Additionally, automatic speech recognition (ASR) algorithms perform worse in reverberant environments [3], which is detrimental to speech-based sys-tems that are dependent on them for human-to-machine interaction. It is therefore desirable to design robust dereverberation algorithms to suppress or compensate the reverberation effect such that the orig-inal clean speech can be recovered.
1.2 Research statement 35
1.2
Research statement
The aim of this thesis is to develop multichannel dereverberation algorithms that exploit specific acous-tic parameters, but which are robust to estimation errors in those acousacous-tic parameters, with the aim of improving scores from objective measures of perceived speech quality.
1.3
Original contributions
To the best knowledge of the author, the original contributions in this thesis are:
1. Development of two statistical model for system identification errors (SIEs) to enable more realistic evaluation of robust multichannel equalization algorithms.
• Investigation into the statistics ofSIEs using both supervised and unsupervised system iden-tification algorithms.
• Development of two different models to describe theSIEs associated with the system identi-fication algorithms investigated.
• Development of an artificial blind system identification error (BSIE) generator with statistics trained from a state-of-the-art cross-relation based blind system identification (BSI) algo-rithm.
2. Development of two acoustic channel equalizing filters that are robust to blind channel identifica-tion errors, such that the equalizing filters can be convolved with reverberant speech to derever-berate it without introducing excessive distortion or colouration.
• Development of an algorithm to control the early coefficients in the equalized acoustic im-pulse response.
• Development of an algorithm to control the temporal envelope of the equalized acoustic im-pulse response.
3. Study and development of channel equalization methods in subbands for finer control of robust-ness to parameter estimation errors and reduced computational complexity.
• Development of techniques for applying gating or variable relaxation of constraints for equal-ization in subbands using acoustic parameter estimates that are related to signal-to-noise ra-tio (SNR). These aim to control the trade-off between improved dereverberation performance and the distortion introduced in environments with very lowSNR.
4. Development of a unified framework between channel equalization and beamforming.
• Formulation of a joint cost function between a multichannel equalizer and a filter-and-sum beamformer in both time and frequency domains. In addition, white noise gain (WNG) constraints are introduced to improve robustness to spatially uncorrelated noise.
1.4
Publications
The following publications were produced during the course of this work:
Journal publications
J1 F. Lim, W. Zhang, E. A. P. Habets, P. A. Naylor, “Robust multichannel dereverberation using relaxed multichannel least squares,”IEEE/ACM Trans. Audio, Speech, Lang. Process., vol. 22, no. 9, pp. 1379–1390, Sep. 2014.
Conference and workshop publications
C1 F. Lim and P. A. Naylor, “Statistical modelling of multichannel blind system identification errors,” inProc. Intl. Workshop Acoust. Signal Enhancement (IWAENC), Juan-les-Pins, France, Sep. 2014.
C2 M. R. P. Thomas, F. Lim, I. J. Tashev, and P. A. Naylor, “Optimal beamforming as a time domain equalization problem with application to room acoustics,” inProc. Intl. Workshop Acoust. Signal Enhancement (IWAENC), Juan-les-Pins, France, Sep. 2014.
C3 F. Lim, M. R. P. Thomas, and P. A. Naylor, “MINTFormer: A spatially aware channel equalizer,” in
Proc. IEEE Workshop on Applications of Signal Processing to Audio and Acoustics, New Paltz, USA, Oct. 2013.
C4 F. Lim and P. A. Naylor, “Robust speech dereverberation using subband multichannel least squares with variable relaxation,” inProc. European Signal Processing Conf. (EUSIPCO), Marrakech, Mo-rocco, Sep. 2013.
C5 F. Lim and P. A. Naylor, “Robust low-complexity multichannel equalization for dereverberation,” inProc. IEEE Intl. Conf. on Acoustics, Speech and Signal Processing (ICASSP), Vancouver, Canada, May 2013.
1.5 Thesis outline 37
C6 F. Lim and P. A. Naylor, “Relaxed multichannel least squares with constrained initial taps for multi-channel dereverberation,” inProc. Intl. Workshop Acoust. Signal Enhancement (IWAENC), Aachen, Germany, Sep. 2012.
1.5
Thesis outline
The content of this thesis is structured as follows:
• Chapter2provides a background overview of acoustic reverberation and conducts a literature review of existing dereverberation techniques. The background overview includes a formal for-mulation of the blind multichannel dereverberation problem and a review of relevant room acous-tic concepts and objective evaluation measures used in this thesis. In the literature review, both channel-independent and channel-based dereverberation techniques are discussed, as well as blind system identification algorithms that are crucial for the latter.
• Chapter3investigates the statistical characterization of channel estimation errors associated with a state-of-the-art blind system identification algorithm. A model is developed for generating arti-ficial channel estimation errors based on statistics trained on real estimation errors. This work is motivated by the mismatch between the accuracy achieved by state-of-the-art blind system identifi-cation algorithms and the required accuracy for state-of-the-art channel equalizers. The developed model is therefore useful for evaluating the robustness of channel equalizers to different levels of channel estimation errors that are statistically realistic.
• Chapter4reviews the channel shortening paradigm for improving the robustness of channel equal-izers to channel estimation errors. The RMCLS with constrained initial coefficients (R-CIC) and RMCLS with envelope constraint (R-EC) algorithms are proposed to extend the relaxed multi-channel least squares (RMCLS) in a manner that improves the perceived quality of speech while maintaining acceptable levels of reverberant tail suppression. The first imposes a constraint on the largest initial coefficients of the equalized impulse response, while the second controls its temporal envelope shape. Experiments show that both reduce colouration in the equalized signals without significantly impacting the dereverberation capabilities ofRMCLS.
• Chapter5builds upon Chapter4by investigating the use of channel equalizers in subbands. The gated subband RMCLS (G-RMCLS) and variable relaxation RMCLS (VR-RMCLS) algorithms are developed to control the level of dereverberation applied depending on the expected levels of
chan-nel estimation errors. In frequency subbands where there are large estimation errors, these algo-rithms back off dereverberation to avoid introducing additional distortion in the equalized signal. In other frequency subbands where there are small estimation errors, the amount of dereverbera-tion applied is varied in different subbands. It is shown that the proposed algorithms can increase suppression of both the early reflections and late reverberant tail, leading to overall improved dere-verberation performance and perceived speech quality.
• Chapter6proposes a unified framework for channel equalization and spatial filtering. While these approaches are conventionally considered separately, both can be formulated as a filtering-and-sum operation with different criteria. Using the illustrative examples of the multiple-input/output in-verse theorem (MINT) algorithm for channel equalization and the filter-and-sum beamformer for spatial filtering, a common notation is formulated in both time and frequency domains. A pro-posed hybrid solution introduces an independent mixing parameter to control the trade-off be-tween the potential dereverberation performance ofMINTand the robustness of the beamformer. Additionally,WNGconstraints are introduced, as is common in beamforming literature, to im-prove robustness to sensor noise. It is shown that the proposed hybrid algorithm imim-proves the perceived quality of speech within a small spatial region around the true speaker location com-pared to bothMINTand the beamformer when operating alone.
39
Chapter 2
Background and literature review
In this chapter, the background for the work presented in this thesis is provided. Firstly, a formulation of the reverberant acoustic system is given, followed by an overview of room acoustics and performance evaluation metrics used in this work. A literature review of dereverberation andBSIapproaches is then conducted to provide context for the algorithms developed in this thesis.
2.1
A reverberant system
Consider a speech signals(n)propagating in an acoustic space such as a room from the sound source
toMmicrophones, wherenis the discrete time index. This scenario can be modelled as anM-channel acoustic single-input multiple-output (SIMO) system. In this work, the acoustic impulse responses (AIRs) between the sound source and the microphones are assumed to be time-invariant. The reverberant and noisy signal captured at them-th microphone, form=1, 2, . . . ,M, is denoted as
xm(n) = hm(i) ∗s(n,i) +vm(n) (2.1) = L−1 ∑ i=0 hm(i)s(n−i) +vm(n) (2.2)
wherehm(i)is theAIRof lengthLsamples,iis the sample index,∗is the linear convolution operator andvm(n)is the background noise. Dereverberation algorithms aim to find equalizing filtersдm(i)that recover the clean speech signal as much as possible by removing or reducing the effects of the room such that
whered(i)is a designed equalized impulse response1andτis some delay.
In vector form, theAIR, segments of the microphone, speech and noise signals, and the equalizing filter can be denoted respectively as
hm = [hm(0)hm(1). . . hm(L−1)]T, (2.4)
xm(n) = [xm(n)xm(n−1) . . . xm(n−Li+1)]T, (2.5)
s(n) = [s(n)s(n−1) . . . s(n−L−Li+2)]T, (2.6) vm(n) = [vm(n)vm(n−1) . . . vm(n−Li+1)]T, (2.7)
gm = [дm(0)дm(1) . . . дm(Li−1)]T, (2.8)
whereLis theAIRlength andLiis the equalizing filter length. The microphone signal from (2.2) can
then be reformulated as
xm(n) =HTms(n) +vm(n), (2.9)
whereHmis the(L+Li−1) ×Lifiltering matrix ofhmdefined as
Hm = ⎡ ⎢ ⎢ ⎢ ⎢ ⎢ ⎢ ⎢ ⎢ ⎢ ⎢ ⎢ ⎢ ⎢ ⎢ ⎢ ⎢ ⎢ ⎢ ⎢ ⎢ ⎢ ⎢ ⎢ ⎢ ⎣ hm(0) 0 . . . 0 hm(1) hm(0) . . . 0 ⋮ ⋱ ⋱ ⋮ hm(L−1) . . . ⋮ ⋮ 0 hm(L−1) ⋱ ⋮ ⋮ ⋮ ⋱ ⋮ 0 . . . 0 hm(L−1) ⎤ ⎥ ⎥ ⎥ ⎥ ⎥ ⎥ ⎥ ⎥ ⎥ ⎥ ⎥ ⎥ ⎥ ⎥ ⎥ ⎥ ⎥ ⎥ ⎥ ⎥ ⎥ ⎥ ⎥ ⎥ ⎦ . (2.10)
The stacked multichannel system can then be represented as
x(n) =HTs(n) +v(n), (2.11)
where
x(n) = [x1T(n)x2T(n). . . xTM(n)]T, (2.12) v(n) = [vT1(n)v2T(n) . . . vTM(n)]T, (2.13)
H = [H1H2 . . . HM]. (2.14)
2.2 Room acoustics 41
Given the equalizing filtersgm, the equalized speech is obtained as
ˆ s(n) =Gx(n), (2.15) whereG = [GT1 G T 2 . . . G T
M]andGm is formed in a similar fashion to (2.10). For completeness, the stacked multichannelAIRs and equalizing filters are additionally defined as
h= [hT1 hT2 . . .hTM]T, (2.16)
g= [gT1 gT2 . . . gTM]T. (2.17)
The aim of dereverberation algorithms is to designgto recover the clean speech signal, possibly with some delay, such that in the ideal scenario, ˆs(n) =s(n−τ)is obtained, whereτis the delay.
2.2
Room acoustics
Signal distortion introduced by reverberation is dependent on the properties of the room andAIRs. In this section, an overview ofAIRconcepts and metrics that underpin the work in this thesis are given.
2.2.1
Acoustic impulse response structure
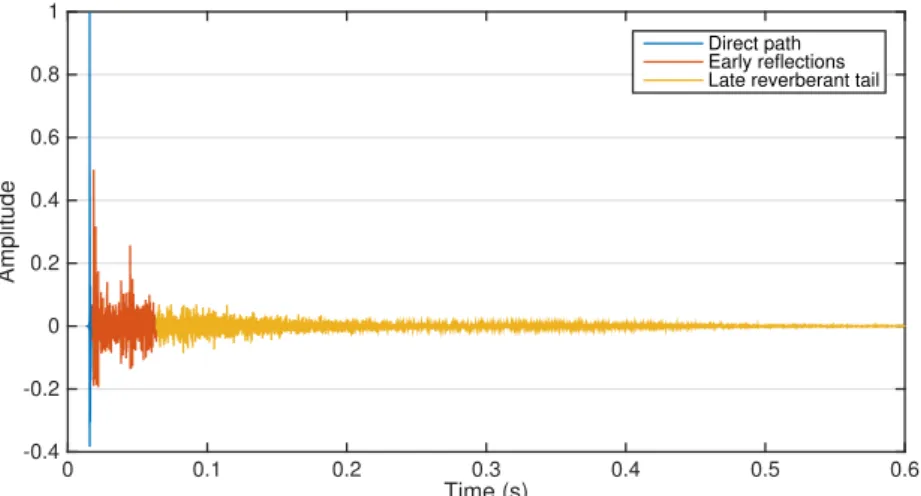
Based on psychoacoustic theories that human perception of reflected sounds with short and long delays are different [4,5], the structure of anAIRcan be described in three parts: the direct-path component, early reflections, and late reflections, as shown in Fig.2.1.
The direct path corresponds to the acoustic propagation path between the source and microphone along the shortest path. Its coefficients are usually the largest in anAIR, but can also be smaller than subsequent reflection coefficients depending on the source-microphone geometry and reflectivity of the surrounding surfaces.
Early reflections arriving shortly after the direct path are not perceived as separate echoes if they are below a masking limit introduced by the direct sound [6]. Instead, they have been shown to contribute positively to speech intelligibility as they increase the apparent loudness of the direct sound [1]. This is also known as the Haas effect and is useful for dereverberation algorithms as it motivates partial channel equalization techniques (see Chapter4). However, early reflections are not entirely desirable; the presence of a separate strong impulse in addition to the direct path causes spectral distortion, which manifests itself perceptually as colouration and therefore also contributes to the degradation of perceived speech quality.
Time (s) 0 0.1 0.2 0.3 0.4 0.5 0.6 Amplitude -0.4 -0.2 0 0.2 0.4 0.6 0.8 1 Direct path Early reflections Late reverberant tail
Figure 2.1: Structure of anAIRdepicting the three regions: direct path, early reflections and late rever-berant tail.
The region of early reflections is often taken to be between 50 to 100 ms after the direct path [6]. Late reflections arriving with longer delays, also known as the reverberant tail, consist of coefficients with seemingly random values. They are perceived as very closely spaced echoes that cause the source to sound ‘distant’ and ‘echo-ey’ [1]. In automatic speech recognition, word-error rate suffers as reverberation causes the information captured by a feature vector within a time frame to smear into subsequent time frames [7]. It is therefore desirable to suppress the reverberant tail in the equalized impulse response for speech dereverberation.
2.2.2
Energy decay curve
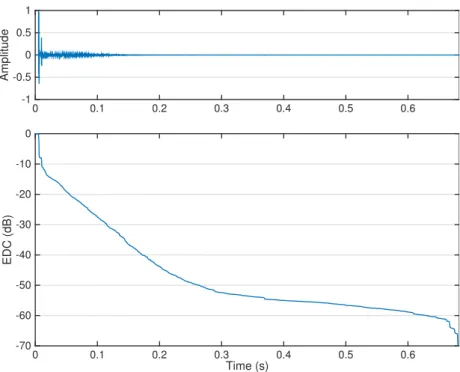
The energy decay curve (EDC) measures the remaining energy in anAIRat each time or sample, and is defined for the discreteAIR,hm(i), as
EDC(i) = L−1 ∑ i′=i h2 m(i′). (2.18)
An example of anEDCnormalized with respect to the total energy in theAIRis given in Fig.2.2. It can be seen that there is initially a sharp drop due to the transition from the regions of direct path and strong early reflections into the region of free decay2. In the subsequent region of free decay where theEDC
gradient is near-constant, the sound field is diffuse, i.e. there is a uniform distribution of energy in the late reflections arriving from all directions. This region corresponds to the reverberant tail of theAIR. TheEDCthen flattens out towards the end as it hits the noise floor, which arises from background and/or
2
This drop is only visible when the distance between the source and microphone is smaller than thecritical distance(see Sec-tion2.2.4), where there is a strong direct path component.
2.2 Room acoustics 43 0 0.1 0.2 0.3 0.4 0.5 0.6 Amplitude -1 -0.5 0 0.5 1 Time (s) 0 0.1 0.2 0.3 0.4 0.5 0.6 EDC (dB) -70 -60 -50 -40 -30 -20 -10 0
Figure 2.2: Example of anAIR(top) and its correspondingEDC(bottom).
equipment noise in real measurements.
TheEDCis important for the computation ofreverberation time, detailed in Section2.2.3. In this work, it is additionally used as a performance metric as it provides an overview of the energy decaying process inAIRs and equalized impulse responses (EIRs).
2.2.3
Reverberation time
An acoustic space can be characterized by its reverberation time, orT60, defined as the time taken (in
seconds) for the energy of a steady-state sound field to decay by 60 dB after the excitation source signal has been switched off [6]. In Sabine’s pioneering room acoustics research [8], reverberation time was determined to be a function of the room geometry and absorptivity of the surfaces but independent of the source and microphone(s) geometry. It can be estimated as [8]
T60= 24 ln(10) cs V αSabineAtot , (2.19)
wherecsis the speed of sound,Vis the volume of the room,αSabineis the average absorptivity andAtot
is the total surface area. TheT60of a typical office or meeting room can range from 100 to 600 ms [9].
Given knowledge of theAIRof a room, itsT60can also be measured directly from itsEDCin the
source-microphone distance that is greater than thecritical distance(see Section2.2.4). As the noise floor is usually above−60 dB in real measurements, a linear fit is typically applied between−5 and−35 dB, de-pending on the start and end points of the free decay region, and extrapolated to approximate theT60.
2.2.4
Critical distance
The critical distance is defined as the distance where the energy in the direct path is equal to the energy in the reverberant components [1]. It can be approximated (in metres) as [10]
dcrit≈0.1 √ ( SDV πT60 ), (2.20)
whereSD is the directivity of the source3. The effects of reverberation will be more pronounced for a listener outside of the critical distance from the source compared to a listener within the critical distance. As such, dereverberation algorithms will be most useful in cases where the source-microphone distance is greater thandcrit.
2.2.5
Acoustic impulse response models
AnAIRcan be modelled with an acoustic transfer function using various models – pole-zero, all-zero, all-pole or common pole-zero [11,12]. As is common practice in literature relating to acoustic system iden-tification and equalization [9], the all-zero finite impulse response (FIR) model is employed throughout this thesis.AIRs can be simulated using the image method [13] as implemented in [14]. This method is applicable only for shoe-box rooms and is useful for controlled study and evaluation.
An alternativeAIRmodel is Polack’s model, which is based on the statistics of the late reverberant tail. It models anAIRas an exponentially decaying process proportional toT60, given as [10]
h(i) =Γ(i)e−ζ i fori≥0, (2.21)
where Γ(i)is a zero-mean stationary Gaussian random process,ζis a damping constant given by
ζ= 3 ln(10) T60fs
, (2.22)
and fsis the sampling frequency in Hz.
3An omnidirectional source hasS D=1.
2.3 Subjective dereverberation measures 45
2.2.6
Normalized projection misalignment
The channel-equalization based dereverberation algorithms developed in this thesis require estimates of the trueAIRs,h, which can be obtained usingBSIalgorithms (see Section2.5.6). The estimatedAIRs, ˆh, often have a scaling ambiguity as this is not an explicit constraint or design aim in manyBSIalgorithms. Therefore, it is necessary to normalize ˆhbefore evaluating its accuracy. A commonly used measure for quantifying the estimation error in ˆhis the normalized projection misalignment (NPM), defined as [15]
NPM=10 log
10(
∥h−βNPMhˆ∥22
∥h∥22
) dB, (2.23)
whereβNPMis a scaling factor computed as
βNPM=
hThˆ ˆ hThˆ
, (2.24)
such thatNPMis a measure of the squared distance betweenhand the projection ofhonto ˆh.
The scaling ambiguity is irrelevant to channel equalizer design as a compensating gain factor can simply be applied to the equalized speech in order to achieve a desired level. Nevertheless, knowledge of the estimation error levels in ˆhis useful when evaluating the robustness of dereverberation algorithms to such errors.
2.3
Subjective dereverberation measures
The performance of dereverberation algorithms can be evaluated by comparing speech quality before and after processing. Since perceived quality of speech cannot exist independently of the human listener, it is intrinsically a subjective measure. It can be assessed by conducting subjective listening tests, where human participants rate the quality of a given speech sample. The International Telecommunications Union (ITU-T) offers recommendations for conducting such tests and a five-level impairment measure-ment scale for listening quality [16]. The mean opinion score (MOS) can then be found to indicate the subjective perceived quality of the processed signal under evaluation.
The main disadvantages with subjective measurements are cost and availability of suitable subjects [17]. Large numbers of trials are required as the nature of subjective measurements leads to highly vari-able results dependent on individual listeners, fatigue and any pre-conceived expectations of the algo-rithms or system under test [1,18]. In some cases, trained listeners, also known asGolden Ears, might be desirable as they can enable better detection of subtle differences between similar speech signals.
How-ever, the number and availability of such trained listeners are very limited. Finally, it has been shown that even short exposure to reverberant speech can desensitise listeners [19] as the human auditory system’s compensation mechanism kicks in.
Given the above limitations, objective measures are more desirable for consistent evaluation of mul-tiple dereverberation algorithms over a wider range of acoustic scenarios.
2.4
Objective dereverberation measures
A reliable and unanimously accepted objective measure to wholly quantify the level of reverberation and the effect on perceived quality of speech remains an area of open research [10,20]. It is a difficult problem considering that the human perception of just the distance component of reverberant speech is affected by multiple cues including sound intensity, binaural cues, frequency spectrum and direct-to-reverberant sound energy [21].
Existing objective measures can be classified as [1] channel-based, applicable in cases when theAIR
is available, and signal-based, applicable in cases where theAIRis not available and/or it is desirable to evaluate the equalized speech directly. In [22,23], studies were carried out to determine the correlation between a range of such objective measures and subjective listening scores, however, there is no clear single winning metric.
Instead, these measures can be used independently to assess different types of degradations, as follows:
1. Perception of space and distance caused by reverberant late reflections
To reduce the degradation introduced by reverberant late reflections, it is desirable to suppress theAIRcoefficients in this region to zero. Evaluation can be performed using two channel-based metrics. The first isEDC, which can provide an understanding of the energy remaining in anAIR
at different points. The second metric, direct-to-reverberant ratio (DRR), compares the energy in the direct-path and early reflections to the energy in the reverberant tail (see Section2.4.1).
2. Perception of speech colouration caused by strong early reflections
Colouration is the perceived degradation of speech quality caused by spectral smearing in the re-verberant speech signal. When evaluating the perceived quality of the equalized speech signal, it is therefore useful to be able to determine the level of spectral deviation from both clean and rever-berant speech. The log-spectral distance is a commonly used metric in literature and is detailed in Section2.4.2. In this thesis, the Itakura distance is used as it is gain-independent and is detailed in Section2.4.3.
2.4 Objective dereverberation measures 47
3. Overall perceived quality of speech
Although there is no single measure that can completely quantify the degradation of speech due to reverberation, it is nevertheless desirable to have some assurance that overall perceived quality of speech has not degraded after processing. In this thesis, perceptual evaluation of speech quality (ITU-T P.862) (PESQ) [24] is used, and is detailed in Section2.4.4.
The ability to evaluate the dereverberation performance under different criteria is particularly useful when developing algorithms that seek to specifically improve one aspect of speech quality degradation. Throughout this work, a combination of objective metrics is used to support a holistic view of the dere-verberation performance. While non-intrusive measures of redere-verberation such as the speech to reverber-ation modulreverber-ation energy ratio (SRMR) [25] have been developed, intrusive measures have been used in this work as the clean signals and trueAIRs are available in the experiments carried out.
2.4.1
Direct-to-reverberant ratio
TheDRRis a channel-based objective measure defined as
DRR=10 log10 ⎛ ⎜ ⎜ ⎜ ⎜ ⎝ nd ∑ i=0 h2 m(i) L−1 ∑ i=nd+1 h2 m(i) ⎞ ⎟ ⎟ ⎟ ⎟ ⎠ dB, (2.25)
where the samples indexed 0 up tondrepresent the direct path only. In cases where the source-microphone propagation time is an integer number of samples,nd is simply the sample index with the largest coef-ficient in the early region of theAIR. In general, however, the discreteAIRcoefficients are samples of a sinc function that corresponds to the sampling kernel. Therefore, it is difficult to identify the direct path samples precisely. In the literature, it is common to specify the direct path region as 8 to 16 ms after the approximate arrival of the direct sound [1].
TheDRRis useful in evaluating how closely anEIRapproaches a perfect impulse, which is the ideal outcome for dereverberation algorithms targeting complete channel equalization.
2.4.2
Log spectral distance
The log spectral distance is an Euclidean distance measure between the log spectra of a reference signal
respectively, where f is the frequency index. Theℓp-norm of their differences can be found as [27] LSDp(S, ˆS) =⎛ ⎝ 2 F F 2−1 ∑ f=0 ∣logS(f) −log ˆS(f)∣ p⎞ ⎠ 1 p dB, (2.26)
whereFis the number of discrete Fourier transform (DFT) points. In speech processing systems, it is common to takep=2 [26], giving the root mean square log spectral distance. It should be noted that the log spectral distance is a symmetric measure, i.e. LSDp(S, ˆS) =LSDp(Sˆ,S).
2.4.3
Itakura-Saito and Itakura distances
The Itakura-Saito and Itakura distances are spectral distance measures that are independent of signal gain. The Itakura-Saito distance is defined in terms ofS(f)and ˆS(f)as [27,28]
ISS, ˆS≐IS(S(f), ˆS(f)) = 2 F F 2−1 ∑ f=0 [ S(f) ˆ S(f)−log S(f) ˆ S(f)−1] dB. (2.27)
The all-pole model ofS(f)can be used, given as
S(f) = є ∣A(ejωf)∣2
, (2.28)
whereωf =2π f/Fis the frequency in radians,єis the one-step predictor error,
є=exp ⎧ ⎪ ⎪ ⎨ ⎪ ⎪ ⎩ 2 F F 2−1 ∑ f=0 logS(f) ⎫ ⎪ ⎪ ⎬ ⎪ ⎪ ⎭ , (2.29)
andA(ejωf)is aP-th order polynomial,
A(ejωf ) =1+ P ∑ i=1 ¯ aie−i jωf. (2.30)
Reformulating (2.27) in terms of the all-pole model yields
IS( є ∣A(ejωf)∣2 , ˆ є ∣Aˆ(ejωf)∣2 ) = є ˆ є⋅ 2 F F 2−1 ∑ f=0 ∣Aˆ(ejωf)∣2 ∣A(ejωf)∣2 −log є ˆ є−1. (2.31)
2.4 Objective dereverberation measures 49 shapes, i.e. 1/∣A(ejωf )∣2, and is shown in [27] to be I( 1 ∣A(ejωf)∣2 , 1 ∣Aˆ(ejωf)∣2 ) =log ⎧ ⎪ ⎪ ⎨ ⎪ ⎪ ⎩ 2 F F 2−1 ∑ f=0 ∣Aˆ(ejωf)∣2 ∣A(ejωf)∣2 ⎫ ⎪ ⎪ ⎬ ⎪ ⎪ ⎭ . (2.32)
Introducing the multiplicative factor(є/єˆ)(єˆ/є), (2.32) can be rewritten as
I( 1 ∣A(ejωf)∣2 , 1 ∣Aˆ(ejωf)∣2 ) = log ⎧ ⎪ ⎪ ⎨ ⎪ ⎪ ⎩ ˆ є є є ˆ є⋅ 2 F F 2−1 ∑ f=0 ∣Aˆ(ejωf)∣2 ∣A(ejωf)∣2 ⎫ ⎪ ⎪ ⎬ ⎪ ⎪ ⎭ (2.33) = log ⎧ ⎪ ⎪ ⎨ ⎪ ⎪ ⎩ є ˆ є⋅ 2 F F 2−1 ∑ f=0 ∣Aˆ(ejωf)∣2 ∣A(ejωf)∣2 ⎫ ⎪ ⎪ ⎬ ⎪ ⎪ ⎭ −log( є ˆ є). (2.34) Noting that [27] log(є ˆ є) = 2 F F 2−1 ∑ f=0 log(S(f) ˆ S(f)), (2.35)
the Itakura distance can be formulated in terms ofS(f)and ˆS(f)by substituting (2.28) and (2.35) into (2.34) to yield [29] Is, ˆs≐I(S(f), ˆS(f)) =log ⎧ ⎪ ⎪ ⎨ ⎪ ⎪ ⎩ 2 F F 2−1 ∑ f=0 S(f) ˆ S(f) ⎫ ⎪ ⎪ ⎬ ⎪ ⎪ ⎭ − 2 F F 2−1 ∑ f=0 log(S(f) ˆ S(f)). (2.36)
The Itakura-Saito and Itakura distances are asymmetric measures, i.e. ISs, ˆs≠ISˆs,sand Is, ˆs≠Iˆs,s.
When evaluating dereverberation algorithms, it is desirable to compare both reverberant speech,
x(n), and equalized speech signals, ˆs(n), to clean speech to ensure that the dereverberation algorithm has not introduced additional distortion. The ∆Imeasure is introduced as the difference between these two Itakura distances,
∆I=Is, ˆs−Is,x, (2.37)
where a smaller ∆Iis desirable and ∆I<0 indicates a smaller distortion between the equalized and clean
speech spectra, compared to the distortion between the reverberant and clean speech spectra.
2.4.4
Perceptual evaluation of speech quality (PESQ)
The perceived quality of speech can be estimated using the objectivePESQscore [24] that provides a predicted mean opinion score (PMOS) ranging from 1−4.5. In order to compare the quality of the processed speech against the reverberant speech captured at the microphone array, the difference in their
PESQscores can be calculated as
wherePs, ˆsandPs,xare thePESQscores of the processed speech and reverberant speech, both computed
as [24] with reference to the clean speech. A positive ∆Pindicates that the equalized signal has improved perceived quality compared to the microphone signal, while a negative ∆Pindicates otherwise. In the context of evaluating dereverberation algorithms, thePESQmeasure must be considered with care since it is not recommended for use with reverberant or dereverberated speech [24], and investigations into correlations with subjective ratings have yielded mixed results [22,23,30]. Additionally, this work con-siders dereverberation algorithms that target both complete and partial equalization. Since the clean speech signal is used as the reference signal for computing thePESQscores, the results may favour al-gorithms that target complete equalization. An alternative reference signal that can be used is the clean speech signal convolved with the early reflections of the trueAIR[31]. In this work, a result of ∆P>0 is selected as a sufficient condition to provide some assurance that the dereverberation algorithm has not introduced any measurable degradation in overall speech quality.
2.5
Overview of dereverberation approaches in the literature
Blind speech dereverberation is a difficult problem since neither the source signal nor the acoustic chan-nels are known. Many approaches have been developed over the last few decades employing both single and multiple microphones. Some approaches require an estimate of theAIRs, while others rely on mod-els of the source signals. In this section, an overview of dereverberation approaches in the literature will be given.
2.5.1
Linear-prediction residual enhancement
The linear prediction (LP) residual enhancement approach to dereverberation exploits the source-filter model of speech production, which describes speech as an excitation sequence (generated by the vocal cords) that is filtered by a time-varying all-pole filter (corresponding to the vocal tract). ApplyingLP
analysis to the reverberant speech yields an estimate of the all-pole filter coefficients, also known as the
LPcoefficients. The corresponding excitation sequence, also known as the residual signal, is then found by inverse filtering the microphone signals. The fundamental assumption of this approach is that rever-beration and noise primarily affects the excitation sequence and not the all-pole filter coefficients [32–34]. Dereverberation can then be carried out by enhancing the residual signal and reconstructing the speech signals using the estimatedLPcoefficients. Various methods have been proposed in the literature for identifying coefficients in the residual signal that are present due to the original speech signal, and for removing the effects of reverberation. An early work described in [32] employed a voiced and unvoiced
2.5 Overview of dereverberation approaches in the literature 51
speech detector, gain estimator and pitch estimator to help enhance theLPresidual. In [33], event-based processing in the wavelet domain is proposed instead to identify impulses in theLPresidual that cor-respond to the desired speech, rather than due to the channel effects. In [35], analysis is carried out in very short (2 ms) segments to coarsely estimate the level of signal-to-reverberation ratio. Based on these estimates, theLPresidual is accordingly weighted such that enhancement is focused on regions with high signal-to-reverberation ratio instead of regions where the reverberant component dominates. Another technique proposed in [36] aims to maximize the kurtosis of the residual signal, as it was shown that reverberation causes the residual signal to become more Gaussian, which in turn reduces its kurtosis. A drawback of the algorithms proposed in [33] and [36] is that the underlying structure of speech is not con-sidered, resulting in dereverberated speech that sound less natural. In [37], a spatio-temporal averaging approach was proposed to preserve the structure of the clean speech residual. It was noticed that theLP
residual in clean speech changes slowly between adjacent larynx cycles with high inter-cycle correlation while theLPresidual in the output of a delay-and-sum beamformer contain seemingly random peaks. A moving-average type operation was proposed where each larynx cycle was replaced by an average of itself and its nearest neighbouring cycles, resulting in a suppression of spuriousLPresidual peaks caused by reverberation. In informal listening tests, this approach yielded signals with reduced reverberation, but without introducing artifacts.
2.5.2
Prediction based dereverberation
A myriad of prediction based approaches to dereverberation have been proposed in the literature. In [38,39], multichannel linear prediction is employed where at each time frame, the late reverberation is predicted from previous frames and subtracted from the current frame to yield an estimate of the dere-verberated speech. This method is also referred to as the weighted prediction error (WPE) technique. In [40], the multichannel generalized weighted prediction error (GWPE) algorithm is proposed that in-corporates a new cost function for estimating the prediction coefficients, where the aim is to minimize temporal correlation in speech signals without enforcing spatial uncorrelatedness. As the algorithm ef-fectively conserves the time differences of arrival at the multichannel microphones, spatial information is conserved and a beamformer can additionally be applied as a post-processing step. This combination was shown to be effective forASRin [41]. More recently, the work in [42] generalizes theWPEapproach by incorporating a sparse prior for modelling the speech signals and reformulating the problem as an
ℓp-norm optimization problem. It was shown that the conventionalWPEis a specialℓ0-norm case of the