© Universiti Tun Hussein Onn Malaysia Publisher’s Office
JEVA
Journal homepage: http://penerbit.uthm.edu.my/ojs/index.php/jeva
Journal of
Electronics
Voltage and
Application
*Corresponding author: [email protected]
Sentiment Analysis on UTHM Issues with Big Data
Noor Suhaida Suhaimi
1, Abd Kadir Mahamad
2*, Sharifah Saon
2,
Mohd
Anuaruddin Ahmadon
3, Shingo Yamaguchi
3,
Hakkun Elmunsyah
4 1Independent Researcher, 23100 Paka, Dungun, Terengganu, MALAYSIA2Faculty of Electrical and Electronic Engineering,
Universiti Tun Hussein Onn Malaysia, Parit Raja, Batu Pahat, Johor, 86400, MALAYSIA
3Graduate School of Science and Technology for Innovation,
Yamaguchi University, JAPAN
4Universitas Negeri Malang,
Jalan Semarang, No. 5, INDONESIA *Corresponding Author
DOI: https://doi.org/10.30880/jeva.2020.01.01.003
Received 00 Month 2000; Accepted 01 Month 2000; Available online 02 Month 2000
1.
Introduction
Social media is one of the most popular platforms that not only allow users to share their personal interest in term of communicating, chatting, or sharing their interested topics at any time and any place, but also a good platform for others activities such as online business, education such as full online classes (FOC), Massive Open Online Courses (MOOC), and e-newsletter. Information can be generated and managed easily through either computer or mobile devices by one person and disbursed by many other persons. Different individuals could prompt different opinions on the same matter. Variety of matters, ranging from contemporary events and political issues, to sports and entertainment are being enthusiastically used by administrations, major society, universities and other groups to efficiently and
Abstract: Nowadays, social media platform such as Twitter, WhatsApp, Facebook and it Messenger, as well as
Instagram plays a very importance role to the society. Twitter is a micro-blogging platform that is able to provide a remarkable amount of data that can be used in several number of sentiment analysis applications such as predictions, reviews, and elections. Sentiment Analysis is a process of extracting information of issues or specific topic from enormous amount of data and categorizes it into different classes. The main target of this project is to classify Twitter data into sentiments value either positive, neutral or negative on data collected regarding Universiti Tun Hussein Onn Malaysia (UTHM) issues. This sentiment was classified using sentiment classifier, while data is trained on a Naïve Bayes Classifier, on TextBlob Python library. Lastly, results were displayed to the user, through a web application using Jupyter Notebook. This study found out that the percentage for positive, neutral and negative tweets regarding UTHM issues were 74%, 26% and 0% in English tweets, meanwhile 17%, 82% and 1 % of Bahasa Melayu tweets, respectively. Positive and neutral sentiments analysis shows positive perception of the products and services, thus promoting and branding UTHM worldwide.
quickly communicate with enormous numbers of people. Social media is one of the main source of contributor of a large amount of data, increasing every second and it is growing very quickly.
Twitter is a virtual social networking that can post real time short messages limited to 280-characters. Those short posts are named “tweets”. Registered users are allowed to read and post tweets at any time while the unregistered users can only read the tweets for those unpublicized twitter account [1]. Twitter not just influence to the communication, yet cover a variety of application including culture, politics and elections, ambient news, crisis communication in natural disasters and the influence toward academia field [1]. Actually, information in the tweets are highly unstructured, mixed and it can be either positive, neutral or negative in cases the sentiment analysis of twitter data is very helpful. This positive, neutral or negative tweets are called as power to impose sanctions [2]-[4]. However, validity of the results should be checked, since Twitter may contains spam or irrelevant tweets.
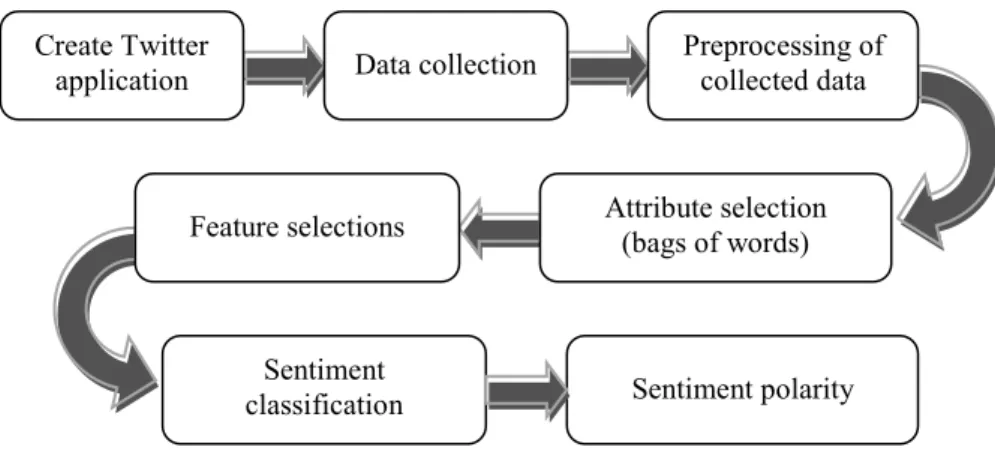
Sentiment analysis is well-defined as the investigation by discussing computationally of public view and partiality in a text specifically text accomplished from social media. This analysis can be used to know the decision of user with esteem to the definite issue, matter or being used for investigate problem. In some cases this analysis, can be used for decision either success or failure of the product in persuading the crowd when the new or updated version to be released into the market. It also known as view mining that can be defined as analysis of word-based data particularly social media information [2] [5]. Generally, basic sentiment analysis of Twitter consist of several phases, including pre- processing of datasets, feature extraction of text, training and classification [4] [6], as shown in Fig. 1. This analysis phases are considered in this paper to ensure the successfulness of the perception prediction toward UTHM issues.
Fig. 1 - Genaral flow of basic sentiment analysis
As per discussed, Twitter is one of social media that contribute to the huge amount of data daily. Big data is defined as data sets whose size is beyond the volume of typical database software tools to manage, store, capture, and analyze. Those datasheets are created mostly from the internet usage, mobile devices, sensors and enterprise system organization [7]. Big data generated can be categorized into three categories, which are (i) structured: stored most corporate information, (ii) unstructured: not organized database, and (iii) semi structured [8] [9]. While, Big data can be grouped in 5V’s key elements which are volume, variety, veracity, velocity and value [7] [10].
However, Big data is not only about volume, extracts business value by analyzing a huge volume of data for improving modeling and analytics capabilities. With contemporary technologies such as machinery, devices, vehicles equipped with sensors and increase data usage among mass media especially social media such as Twitter, Facebook and also GPS devices. It actually generates a huge amount of unstructured information which become more intricate. Big data can be excellently utilized by merging with structured data from traditional commercial applications. Big data has made reference system more vital for the users as it foresees correct piece of data out of huge amount of information. However, it also leads to the problem of scalability of algorithm and systems [11]. The main objective for the use of big data in industrial applications is to achieve a fault-free and cost-efficient running of the process, while understanding the anticipated performance levels, especially with esteem to superiority.
2.
Project Development
Development of the sentiment analysis is divided into two phases which are Phase 1: Fetching twitter data regarding UTHM issue using Twitter API, and Phase 2: Performing sentiment analysis to classify the polarity of the data fetched, thus the steps and procedures must be planned carefully and systematically.
Sentiment
classification Sentiment polarity Data collection
Create Twitter
application Preprocessing of collected data
2.1
Phase I: Fetching twitter data regarding UTHM issues using Twitter API
The Twitter API (application programming interfaces) has been gained by creating the Twitter application. An authorized twitter API client is developed to monitor the live streaming data regarding UTHM issues from Twitter by requesting the Twitter API to fetch tweets for a particular query.
2.2
Phase II: Performing sentiment analysis to classify the polarity of the data fetched
TextBlob library in the Python is used for processing textual data to do sentiment analysis of extracted (UTHM’s) tweets. It offers a consistent API for pitching into common natural language processing (NLP) tasks such as part-of-speech tagging, noun phrase extraction, sentiment analysis and many more. The data are classified into positive, neutral, or negative polarity depending on the words of each data.
Numpy is the vital package for technical computing with Python while Pandas is an open source library offer high- performance programming. The same goes to Tweepy. It is easy to use Python library for accessing the Twitter API. Matplotlib is used to create publication excellence figures in a variety of hardcopy formats and interactive environments across the platform. Matplotlib is a 2D plotting library in Python. Seaborn is a Python visualization library based on matplotlib. It provides a high-level interface for drawing attractive statistical graphics. Phase I and II can be simplified as in Fig. 2.
Fig. 2 - Flow of project development process
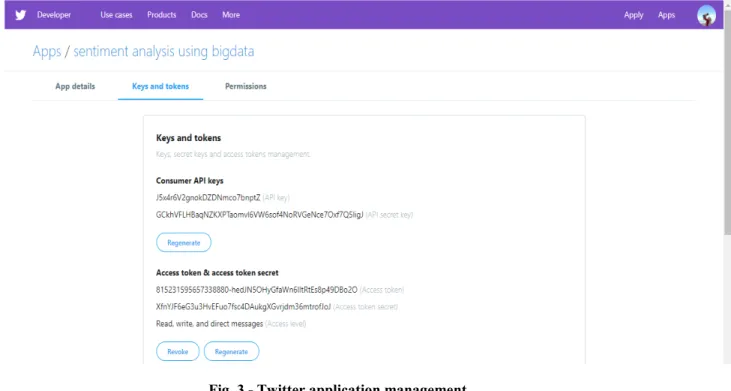
The first step before data can be retrieved from a social media platform such as Twitter is to register an application on the platform to access the APIs key of the application. By default, application only access public information on Twitter. Certain endpoints, such as those responsible for sending or receiving Direct Messages require extra consents from the user before other users can access to the information. Fig. 3 shows the view of the Twitter applications management on the sentiment analysis using big data, consist of applications details, keys and tokens, and permissions of the application.
Setting Twitter API Start
Extract Twitter data
Tweet information i) Maximum number of like ii) Maximum number of retweet
Apply the TextBlob
Analysis of Tweets: % of positive, neutral or negative
Save to CSV format
Fig. 3 - Twitter application management
The Twitter API platform offers three tiers of search APIs, which are standard, premium and enterprise. In this project, the standard search API is used to find the historical tweets instead of premium and enterprise. Twitter data was extracted in terms of the tweets, length of tweets, user ID, date, source, number of like and number of retweets of the posted tweets. Function “extractor.search” is used to extract the tweets regarding any keyword that have been set in the code. The number of the data been display according to the number set in the “display (data.head (50))”. Thus, all the Tweets, length of Tweets, user ID, date and time of Tweets posted, the sources of the Tweets, number of likes and number of retweets are extracted and displayed in form of table for the visibility, easier to be read and analyzed.
Fig. 4 shows the tweets that have four and 372 of the maximum number of likes and retweets, respectively. Usually, the tweet with an extra number of likes is the tweets with extra retweets. Thus, by using the maximum number of likes from the ‘likes’ column and the maximum number of retweets from the ‘RTs’ column using numpy’s max function.
Fig. 4 - Output for tweets with maximum number of likes and retweets
TextBlob is used to execute the sentiment analysis in a very simple way. Any symbols separate to an alphanumeric value are remapped into a new one that fulfils all the condition listed. Classifier “def analize_sentiment(tweet)” is used to classify sentiment of a tweet using TextBlob after cleaning the text in it. A new column sentiment analysis is added to the earlier data frame. This column contains the sentiment analysis.
To have a simple way to verify the results, the number of positive, neutral, and negative tweets are counted and the percentages have been extracted. While, the fetched data of retrieved data are saved into csv file format and apart of output data in comma-separated value (CSV) format in Microsoft Excel.
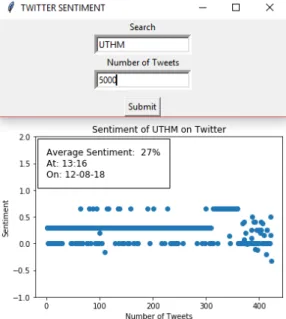
to make a simple GUI which handles user input and output. Fig. 5 shows the pop-up windows to ask the input for twitter sentiment and the output graph of the sentiment.
Fig. 5 - GUI for Twitter average sentiment
3.
Result and Analysis
Fig. 6 shows the results of the percentage for positive tweets regarding UTHM issues tested for the seven days that were 74%, 26% for neutral tweets, meanwhile 0% for negative tweets when language used to retrieve tweet was set to en (English) as in Fig. 7. Meanwhile the percentages changed to 17% positive sentiment, 82% neutral sentiment and 1% negative sentiment tweets when the language was set to in (Indonesian), representing language of Bahasa Melayu, as shown in Fig. 9. The TextBlob comes pre-packaged with a trained classifier and the training data was trained on a Naïve Bayes Classifier which a user does not need to train, code or label any data. The tweet sentiment was classified as positive, neutral or negative by assigning it a polarity between -1 to 1 which -1 for negative sentiment, 0 for neutral sentiment and 1 for positive sentiment.
Fig. 6 - Percentage results of English tweets
Fig. 7 shows the output examples of neutral and positive sentiment tweets based on the written code in Python when the language was set to English language with a sentiment analysis (SA) info highlighted at the last column. While Fig. 8 shows one of the positive tweet in the Twitter application itself.
Fig. 8 - Example of positive and neutral tweets in the Twitter application
For the positive sentiment, a user posted a tweet “Symbolic of Uthm on golden hour #sunset” and posted two pictures of UTHM views while for the neutral sentiment, a user posted about PROTON and DRB-HICOM University: Creative Car Concept (PD3C 2018) to gain support for them to win the contest. In this seven days of sentiment analysis, there was no user who post any negative tweets regarding UTHM. There were only positive and neutral tweets posted by the users.
Fig 9 shows the example output of positive, neutral, and negative sentiment tweets based on the written code in Python when the language was set to in Malay language while Fig. 10 shows one of the positive, neutral and negative tweets in the Twitter application itself. This tweets counted as a positive, neutral and negative sentiment referring to Naïve Bayes Classifier in TextBlob. This results show that both of the first and second objectives of this project were achieved.
4.
Conclusion
Discussion in previous sections described how to retrieve tweets and classify it accordingly to its sentiment. The development method was based on the sentiment classifier in an open source which was Jupyter Notebook to develop a system to perform sentiment analysis of live Twitter data and directly classify it based on it sentiment using TextBlob in Python library. However, the Twitter API does not allow to search by time, thus there is the limitation in getting the old data from Twitter.
As for the conclusion, this work is able to determine the polarity of the tweets in favor of each public opinion views on any issues involving UTHM. All the retrieved tweets from Twitter application have been classified it into positive, neutral or negative sentiment, with 74%, 26% and 0% in English tweets, while 17%, 82% and 1 % for Bahasa Melayu tweets, respectively. Thus it is important to have a positive post, or else neutral post, in order to shows positive perception of the products and services, thus promoting and branding UTHM worldwide. Moreover, negative perception should be considered if it is applicable to increase the quality of products and services.
Acknowledgement
This work was partially supported by the Faculty of Electrical and Electronic Engineering (FKEE), and Research Management Center (RMC), Universiti Tun Hussein Onn Malaysia.
References
[1] Katrin, W., Axel, B., Jean B., Merja, M., Cornelius, P., (2014) Twitter and Society. Digital Formations, 89. New York, Peter Lang Publishing, Inc
[2] Pereira-Kohatsu, J.C., Quijano-Sánchez, L., Liberatore, F., Camacho-Collados, M. (2019) Detecting and monitoring hate speech in twitter. Sensors (Switzerland), 19(21), 4654.
[3] Mike, T. (2014) Sentiment Analysis and time Series with Twitter. In Twitter and Society. Digital Formations, 89. New York, Peter Lang Publishing, Inc. 83-95.
[4] Vishal, A.K., Sonawane, S.S., (2016) Sentiment Analysis of Twitter Data: A survey of Techniques. International Journal of Computer Applications, 139(11), 5-15.
[5] Michal, S. and Andrzej R. (2015) Sentiment analysis of Twitter data within big data distributed enviroment for stock prediction. Federated Conference on Computer Science and Information Systems (FedCSIS), 13-15. [6] Anusha, N., Divya, G., Ramya, B. (2017) Sentiment analysis of Twitter data through Big Data. International
Journal of Engineering Research & Technology (IJERT), 6(6), 307-309.
[7] John, E.G., Angela, C.L. (2018) An introduction to Big data. Journal of Financial Service Professionals, 72(5), 17-20.
[8] Chauhan, S.S., Sharma, I., Kanungo, I., Singh, G. (2019) Healthcare data management and analytics using big data tools. International Journal of Innovative Technology and Exploring Engineering, 8(12), 3725-3728. [9] Sasikumar, C.S., Kumaravel, A. (2019) Supervised models for measuring performance at e-learning
environment. International Journal of Innovative Technology and Exploring Engineering 8(11), 2792-2797. [10] Shen, Y., Okyay, K. (2015) Big Data for Modern Industry: Challenges and Trends. Procedding of IEEE, 103(2),
143-146.
[11] Sharma, S. and Sethi, M. (2015) Implementing collaborative filtering on large scale data using Hadoop and Mahout. International Research Journal of Engineering and Technology (IRJET), 2(4), 103-106.