European Online Journal of Natural and Social Sciences 2015; www.european-science.com Vol.4, No.4 pp. 865-874
ISSN 1805-3602
Factors Affecting the Self-directed Learning Readiness
Hadiseh Monkaresi*, Asadollah Abbasi, Reshvan RazyaniSouth Tehran branch, Islamic Azad University, Tehran, Iran *E-mail: [email protected]
Received for publication: 03 July 2015. Accepted for publication: 29 October 2015. Abstract
This study aimed to investigate the factors affecting self-directed learning readiness among students. The study population consisted of all M.A students majoring in instructional curriculum and technology in Islamic Azad University, Faculty of Psychology. 210 students were selected as the sample size of the study through Cochran sampling and using stratified random sampling. The method of present study was correlational. The data collected were analyzed using SPSS software. The results showed that although the self-directed learning readiness in female students was slightly more than in male students, yet this difference is not statistically significant. Self-directed learning readiness in students less than 25 years is more than other students. The self-directed learning readiness of students based on their GPA was almost the same and self-directed learning readiness of students in the sample was higher than expected. By increasing students' learning approach, their self-directed learning readiness will be increased and by increasing the students’ accessible targets their self-directed learning readiness will be increased. The correlation between students' perception of the learning environment with self-directed learning readiness was positive but this relationship was not statistically significant.
Keywords: self-directed learning, learning approaches, accessible targets, the process of study, Iranian students.
Introduction
Trained graduates capable of rational decision-making and community leadership roles, is among the serious missions and responsibilities of higher education. However, living in the age of knowledge and effective operation of such a society requires social capital and skills of twenty-first century including readiness for directed learning. Creating and developing the skills of self-directed learning has become one of the most important goals of higher education institutions. Also, with the development of academic majors and universities, self-directed is the reqirenment of success and satisfaction in this field that it has turned self-directed learning into one of the most interesting topics in the field of adult education and learning (Raberson, 2005; Teo et al., 2010). Self-directed learning creates special domain in knowledge and the ability to transfer conceptual knowledge to new situations. Self-directed learning is to fill the gap between scientific knowledge and real-world problems through considering people’s learning styles in real life (Bolhoys, 1996). Many factors affecting learners’ satisfaction and ability to encourage self-directed learning have been introduced. The impacts of educational institutions as an external factor for self-directed learners, creation of structured learning environments, conducting relevant training, learning strategies and access to appropriate resources have been observed. Internal factors stated in the self-directed learning, especially learning styles that learners prefer rlate to personality traits, motivation and readiness to take responsibility for their own learning (Akaranithi, 2007).The benefits of self-directed learning include increasing the power of choice, self-esteem, autonomy, motivation and development of lifelong learning skills. This type of learning encourages students to develop their Openly accessible at http://www.european-science.com 865
Hadiseh Monkaresi, Asadollah Abbasi, Reshvan Razyani
ability to evaluate their deficits then searches the resources that could contribute to solve the above defects. Therefore, the students use their knowledge to explore available resources and implementation of informed judgment to solve problems (Karimi et al., 2009). Creating and developing self-directed learning is one of the most important goals of higher education in the country because students are expected reach a level of individual capabilities that without being in a special education system, they identify their training needs and try to meet them and eventually evaluate their own learning. The present study, by regarding the nature of self-directed learning compared the factors affecting self-directed learning readiness among students in curriculum and instuctional technology in Islamic Azad University, Tehran South Branch.
Review of literature
Self-directed learning is one of the most important aspects in the field of adult education and learning. Yuan et al. (2011) in the definition of self-directed learning expressed that students, through self-directed learning, get familiar to the human and material resources, their learning needs, setting goals, learning strategy and evaluating the results of the learning process. According to Chang (2007) Readiness for self-directed learning is considered as a learning behavior allowing students to rely on their own initiatives to continue learning. According to Merriam and Caffarella (2000), self-directed learning (SDL) is the most common form of adult education. Many researchers, such as the Houle (1993) Long and Morris (1996), Tough (1973) estimated that more than 70 percent of adults have participated in self-directed learning projects. Cross (1981) stated that SDL is a global concept. Caffarella expressed that self-directed is a process in which learners are responsible for the design, implementation and evaluation of their learning experiences. Many studies have indicated that students who choose mastery orientation apply more adaptive and appropriate learning strategies. For example, Pintrich and De Groot (1990) found in a study that there is a positive relationship between the acceptance of mastery goals and use of cognitive learning strategies. This finding is consistent with several other studies which have shown that there is a positive relationship between students’ accepted mastery goals and cognitive learning strategies or their self-regulation, (Elliott et al., 1999; Green and Miller, 1996; Miller et al., 1993; Pintrich, 2000). Long (2007) in his article entitled skills for SDL concluded that SDL is a continueous process that every one needs in their life and they need training for this purpose and need to achieve the required skills. Self-directed learning is a process in which the learners are responsible for planning, implementation, and evaluating their learning and are expected to work independently in order to achieve the learning objectives determined. Naimi et al. (2012) in a study entitled the rate of self-directed learning in med-students confirmed that self-directed learning is essential for learners in medical occupation. The findings of the study indicated that boy students in compare with girl students had better management skills and better self-directed learning scores. No significant relationship between the students’ individual and professional traits and self-directed learning skills was seen. According to the conclusion self-directed skills as well as self-directed learning between girls and boys students were different and of course boys had better results. Students’ individual and professional traits had no impacts on their self-directed learning skills and they prefer to learn the educational materials through activities with the help of their teachers. Shahrabadi et al. (2013) in a research entitled predicting the results of learning based on the experiences of students Rafsanjan University of Medical Sciences stated that the students’ attitude from the environment of learning-teaching on their skills and performances during university and their satisfied profession after graduation are regarded really important. The findings of the study show the necessity of professors’ attention to teach well as the most powerful predictors of longlife learning skills and their satisfaction from the course.
Social science section
Research hypotheses
The present study consisted of 5 hypotheses as follow:
H1: There is a significant and positive relationship between students’ individual and self-directed learning readiness.
H2: Students’ self-directed learning readiness is more than 156.
H3: There is a significant and positive relationship between students’ learning approach and self-directed learning readiness.
H4: There is a significant and positive relationship between students’ accessible goals and self-directed learning readiness.
H5: There is a significant and positive relationship between students’ perception from learning environment and self-directed learning readiness.
Methodology
The research method used in this study was functional in terms of its objectives and it was descriptive in terms of ways to gather data and in terms of method is correlation. The statistical society in the study was all students of Islamic Azad University, Tehran Branch in academic year of 2013-2014. In this study, stratified random sampling method was used. Like the scale of continuous measurements, the research hypothesis of two domains of the samples at 95% confidence level will be determined based on Cochran formula as follow:
( )2 2 2 1 2 2 2/ 33 207 0/05 z n d α σ × − × = = = Sample=n 2
σ = population variance based on studies (Saadat, 2012) 𝐳𝐳𝟏𝟏−𝛂𝛂
𝟐𝟐 = for the oriented hypothesis at 95% confidence level is equal to 33.2. d2= acceptable error is 5%.
To generalize and prevent the loss more than 210 people were added to the sample. In this study, data collection was done through field method and information was gathered through questionnaire. In this study data was gathered by the use of four tools as follow: Self-directed Learning Readiness Scale Fisher (2001), two-factor questionnaire of the process of study, questionnaire of course experience, questionnaire of accessible targets.
Self-directed Learning Readiness Scale Fisher (2001): Demographic questionnaire of directed Learning Readiness Scale whose validity and reliability was identified by Fisher (2001) included three subscales of self-management, self-control and desire to learn. The scale was normalized first by Nadi and Sajadian (2006). To determine the reliability of self-directed learning readiness scale, Cronbach's alpha coefficient of 0.86 was obtained by Safavi et al (2010). Fisher et al. (2001) obtained reliability coefficient of 0.92 for the total scale through Cronbach's alpha and this coefficient for subscales of self-management, self-control and desire for learning reported vary from 0.85, 0.84, and 0.83.
Two-factor questionnaire of the process of study: In order to measure learning strategies, revised two-factor questionnaire of the process of study (R-SPQ-2F) Biggs (2001) was used. The questionnaire consisted of two approaches of deep approach (DA) and surface approach (SA) to study, each of which also includes two subscales of motivation and strategy (deep motivation, motivation level, deep strategy, strategy level). Internal consistency of 20 items was obtained 0.74 with Cronbach's alpha in the study conducted by siddiqui (2006), and internal consistency of deep approach (DA) and surface approach (SA), was 0.73 and 0.75 repectively, and in the study by Chan and Lai (2006), it was 0.75 and 0.66 respectively.
Hadiseh Monkaresi, Asadollah Abbasi, Reshvan Razyani
Questionnaire of course experience: the questionnaire was designed by By Ramsden and Vestel (1981) in Lancaster, England which refers to teachers’ behavior rather than focusing on the formation of learning and covers all important aspects of the quality of teaching, affecting the students' success. The questionnaire asks students to rank and score their ideas and perceptions about 6 domains of key aspects of the course that they passed. The six areas are: teaching, educational goals and standards, the volume of courses, course resources and materials, evaluation and overall satisfaction.
Questionnaire of accessible targets: This scale was designed and set by Archer (1994) to measure the 3 objectives: control, performance and self-alientment. The questionnaire was measured in Likert scale. Cronbach's alpha was 0.78 for control scale, 0.87 for performance scale, and 0.78 for self-alientment.
Findings of the study
First hypothesis: there is a significant and positive relationship between students’ individual and self-directed learning readiness.
Since characteristics such as gender, age and students’ grade point average in this semester were included on the questionnaire, this hypothesis consisted of 3 parts. So that in order to answer the hypothesis, independent t-test and analysis of variance (Anova) were used.
The relationship between gender and the level of self-directed learning readiness
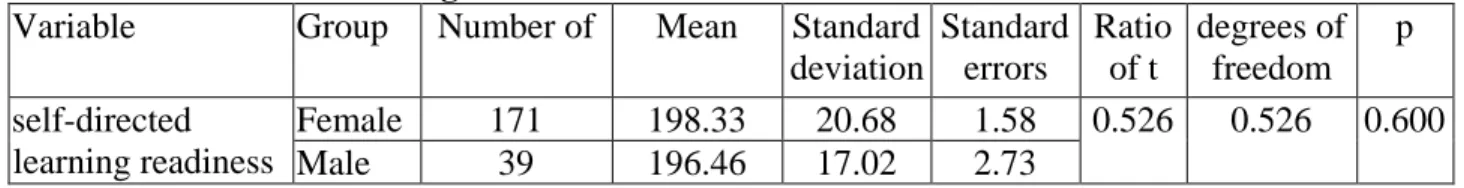
According to independent t-test statistics in table 1, since the calculated t (0.526) is less than the critical t-value (1.96) with smaller degrees of freedom of 208. Therefore, although the self-directed learning readiness in female students was slightly more than male students are, the difference was not statistically significant.
Table 1: self-directed learning readiness in both male and female students
p degrees of freedom Ratio of t Standard errors Standard deviation Mean Number of Group Variable 0.600 0.526 0.526 1.58 20.68 198.33 171 Female self-directed
learning readiness Male 39 196.46 17.02 2.73
The relationship between age and the level of self-directed learning readiness
In order to evaluate the difference of self-directed learning readiness among age groups, the analysis of variance (ANOVA) was used.
Table 2: the analysis of variance of self-directed learning readiness among students’ age groups Sig. F MS Df SS Changing source .000 6.519 2423.510 3 7270.529 Between groups 371.759 206 76582.429 Intergroup 209 83852.957 Total
According to the results in table 2, the self-directed learning readiness of students of different age groups is different (P <0.05). Therefore, Tukey test was used for this purpose and the result are shown in table 3 below.
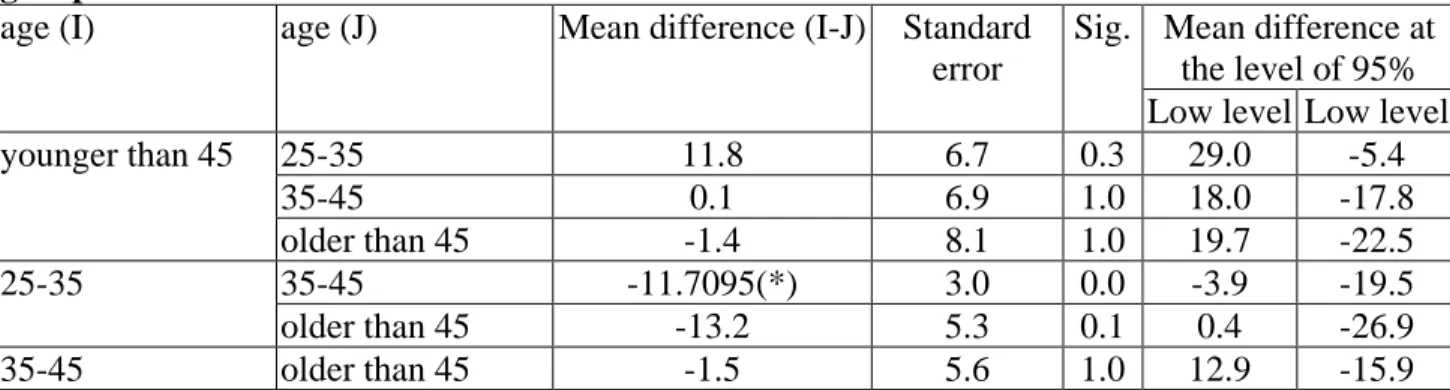
According to the results of Tukey test in table 3, the difference of self-directed learning readiness of students younger than 25 years and students between 25 and 35 years is statistically significant (P <0.05). Also, there is statistically difference between self-directed learning readiness of students aged 25 to 35 and students between 35 and 45 years (P <0.05).
Social science section
Table 3: Tukey test for the difference of self-directed learning readiness among students’ age groups
age (I) age (J) Mean difference (I-J) Standard error
Sig. Mean difference at the level of 95% Low level Low level
younger than 45 25-35 11.8 6.7 0.3 29.0 -5.4 35-45 0.1 6.9 1.0 18.0 -17.8 older than 45 -1.4 8.1 1.0 19.7 -22.5 25-35 35-45 -11.7095(*) 3.0 0.0 -3.9 -19.5 older than 45 -13.2 5.3 0.1 0.4 -26.9 35-45 older than 45 -1.5 5.6 1.0 12.9 -15.9
Based on the available evidence it can be concluded that self-directed learning readiness of students younger than 25 years is more than other students. However, the level of readiness decreases by the age of 35 years but after 35 years, again the self-directed learning readiness will increase.
The relationship between GPA of this semester and the level of self-directed learning readiness
Table 4: Self-directed learning readiness according to the students’ GPA GPA Number of Mean Standard
deviation
Standard errors
Mean difference at the level of 95%
The least The most Low level Low level
15 and younger 12 203.75 18.98 5.48 191.69 215.81 186 234 15-17 150 198.14 17.08 1.39 195.38 200.90 157 240 17-19.5 48 196.06 27.62 3.99 188.04 204.08 134 257 Total 210 197.99 20.03 1.38 195.26 200.71 134 257
According to table 4 the level of self-directed learning readiness of students younger with GPA 15 or less is more than other students. To clarify the difference between self-directed learning readinesses among students with different GPA, analysis of variance (ANOVA) was used.
Table 5: The analysis of variance of self-directed learning readiness among students with different GPA Sig. F MS Df SS Changing source 0.488 0.721 289.917 2 579.835 Between groups 402.286 207 83273.123 Intergroup 209 83852.957 Total
According to the results in table 5, the level of self-directed learning readiness based on students’ GPA is not statistically significant (P >0.05).
Second hypothesis: students’ self-directed learning readiness is more than 156.
In response to this hypothesis, the t-test (one sample) was used. Firstly, statistical indices were reported.
Table 6: Statistical characteristics of self-directed learning readiness
Standard errors Standard deviation Mean Number of statistical index component 1.38 20.04 197.98 210
Students’ self-directed learning readiness
Hadiseh Monkaresi, Asadollah Abbasi, Reshvan Razyani
Based on statistical sample, the mean of self-directed learning readiness of the students (197.9) indicates that in the level of 0.05 it is more than the expected average (156). To answer the hypothesis of Student single group t-test was used.
Table 7: T-test results of students’ self-directed learning readiness
Variable The expected value for the test = 156 Mean difference at the level of 95% self-directed learning readiness value t Degrees of freedom significance level
Mean difference The least The most
30.376 209 .000 41.9857 39.2608 44.7106
Based on findings obtained from t-test, calculated t (30.376) is more than critical t table (1.96). Therefore it can be concluded with 95% confidence that there is a significant difference betwen the level of self-directed learning readiness (197.9) with expected mean (156), based on the mean of samples’ opinions and it can be claimed that students’ self-directed learning readiness was higher than expected (P < 0.05).
Third hypothesis: there is a significant and positive relationship between students’ learning approach and self-directed learning readiness.
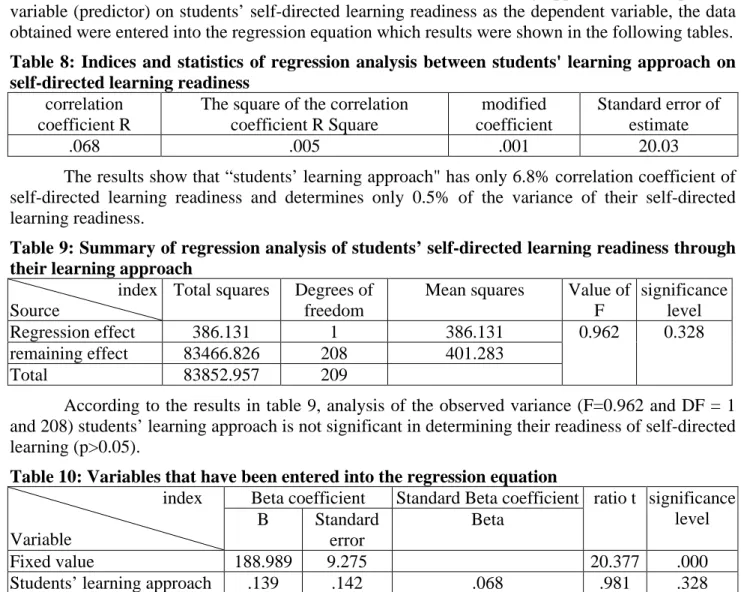
To determine as well as evaluate the role of "students’ learning approach" as independent variable (predictor) on students’ self-directed learning readiness as the dependent variable, the data obtained were entered into the regression equation which results were shown in the following tables. Table 8: Indices and statistics of regression analysis between students' learning approach on self-directed learning readiness
Standard error of estimate modified
coefficient The square of the correlation
coefficient R Square correlation coefficient R 20.03 .001 .005 .068
The results show that “students’ learning approach" has only 6.8% correlation coefficient of self-directed learning readiness and determines only 0.5% of the variance of their self-directed learning readiness.
Table 9: Summary of regression analysis of students’ self-directed learning readiness through their learning approach
index Source
Total squares Degrees of freedom
Mean squares Value of F significance level Regression effect 386.131 1 386.131 0.962 0.328 remaining effect 83466.826 208 401.283 Total 83852.957 209
According to the results in table 9, analysis of the observed variance (F=0.962 and DF = 1 and 208) students’ learning approach is not significant in determining their readiness of self-directed learning (p>0.05).
Table 10: Variables that have been entered into the regression equation index
Variable
Beta coefficient Standard Beta coefficient ratio t significance level B Standard
error
Beta
Fixed value 188.989 9.275 20.377 .000
Students’ learning approach .139 .142 .068 .981 .328
Social science section
According to the results in table 10, correlation and relation between students' learning approach and self-directed learning readiness is positive, however, due to the separation standard regression coefficient (Beta) in the table above it was concluded that this relationship was not statistically significant (p>0.05).
Fourth hypothesis: there is a significant and positive relationship between students’ accessible goals and self-directed learning readiness.
In order to explore and investigate the role of "students’ accessible targets," as an independent (predictor) variable on students’ self-directed learning readiness as a dependent variable, the data obtained were entered into the regression equation whose results were shown in the following tables.
Table 11: Indices and statistics of regression analysis between students' accessible targets on self-directed learning readiness
Standard error of estimate modified
coefficient The square of the correlation coefficient
R Square correlation coefficient R 19.52 .050 .054 .233
The results show that “students’ accessible targets" has 23.3 percent correlation with self-directed learning readiness and explain 5.4% of the variance in their self-self-directed learning readiness. Table 12: Summary of regression analysis of students’ self-directed learning readiness through their accessible targets
index
Source Total squares
Degrees of freedom Mean squares Value of F significance level Regression effect 4558.381 1 4558.381 11.957 0.001 remaining effect 79294.577 208 381.224 Total 83852.957 209
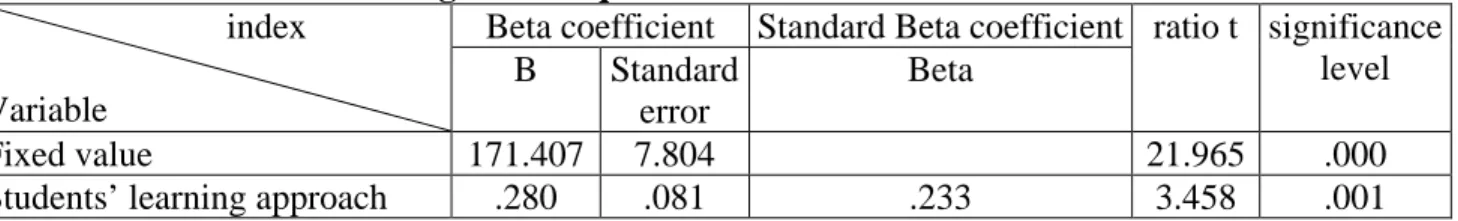
According to the results in table 12, analysis of the observed variance (F=11.95 and DF = 1 and 208) students’ accessible targets is significant in determining their readiness of self-directed learning (p>0.05).
Table 13: Variables for the regression equation index
Variable
Beta coefficient Standard Beta coefficient ratio t significance level B Standard
error
Beta
Fixed value 171.407 7.804 21.965 .000
Students’ learning approach .280 .081 .233 3.458 .001
According to the results in table 13, correlation and relation between students' accessible targets and self-directed learning readiness is positive, however, due to the separation standard regression coefficient (Beta) in the table above it was concluded that this relationship was statistically significant (p<0.05).
Fifth hypothesis: there is a significant and positive relationship between students’ perception from learning environment and self-directed learning readiness.
In order to explore and investigate the role of "students’ perception from learning environment," as an independent (predictor) variable on students’ self-directed learning readiness as a dependent variable, the data obtained were entered into the regression equation whose results were shown in the following tables.
Hadiseh Monkaresi, Asadollah Abbasi, Reshvan Razyani
Table 14: Indices and statistics of regression analysis between students' perception from learning environment on self-directed learning readiness
Standard error of estimate modified
coefficient The square of the correlation coefficient
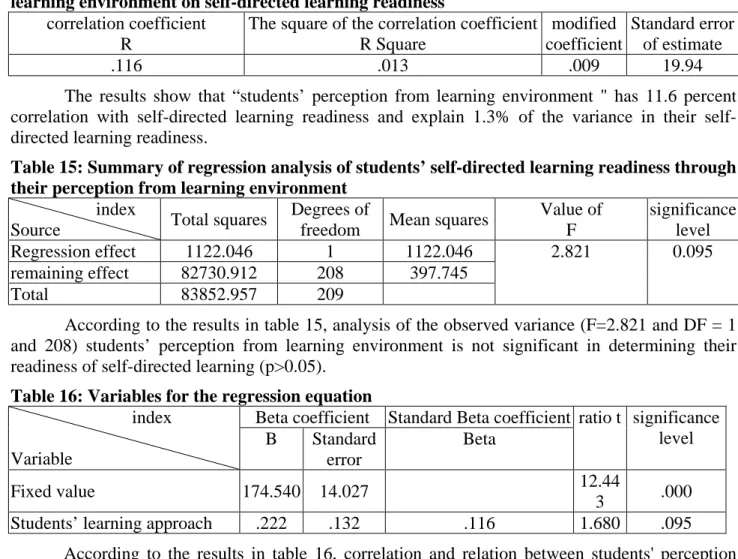
R Square correlation coefficient R 19.94 .009 .013 .116
The results show that “students’ perception from learning environment " has 11.6 percent correlation with directed learning readiness and explain 1.3% of the variance in their self-directed learning readiness.
Table 15: Summary of regression analysis of students’ self-directed learning readiness through their perception from learning environment
index
Source Total squares
Degrees of
freedom Mean squares
Value of F significance level Regression effect 1122.046 1 1122.046 2.821 0.095 remaining effect 82730.912 208 397.745 Total 83852.957 209
According to the results in table 15, analysis of the observed variance (F=2.821 and DF = 1 and 208) students’ perception from learning environment is not significant in determining their readiness of self-directed learning (p>0.05).
Table 16: Variables for the regression equation index
Variable
Beta coefficient Standard Beta coefficient ratio t significance level B Standard error Beta Fixed value 174.540 14.027 12.44 3 .000
Students’ learning approach .222 .132 .116 1.680 .095
According to the results in table 16, correlation and relation between students' perception from learning environment and self-directed learning readiness is positive, however, due to the separation standard regression coefficient (Beta) in the table above it was concluded that this relationship was not statistically significant (p>0.05).
Conclusion
This study aimed to investigate the factors affecting self-directed learning readiness among students. The study population consisted of all M.A students majoring in instructional curriculum and technology in Islamic Azad University, Tehran South Branch, and Faculty of Psychology. 210 students were selected as the sample size of the study through Cochran sampling and using stratified random sampling. The results indicated that:
1. Although self-directed learning readiness in female students was slightly more than male students but the difference is not statistically significant.
2. Self-directed learning readiness of students younger than 25 years is more than other students. However, the level of readiness decreases by the age of 35 years but after 35 years, again the self-directed learning readiness will increase.
3. Self-directed learning readiness of students was not different based on their GPA.
4. There is a significant difference betwen the level of self-directed learning readiness (197.9) with expected mean (156), based on the mean of samples’ opinions and it can be claimed that students’ self-directed learning readiness was higher than expected.
Social science section
5. Students’ learning approach has only 6.8% correlation coefficient of self-directed learning readiness and determines only 0.5% of the variance of their self-directed learning readiness. Therefore, correlation and relation between students' learning approach and self-directed learning readiness is positive, and by increasing students' learning approach, their self-directed learning readiness will be increased however, this relationship is not statistically significant.
6. “Students’ accessible targets" has 23.3 percent correlation with self-directed learning readiness and explain 5.4% of the variance in their self-directed learning readiness. In other word, correlation and relation between students' accessible targets and self-directed learning readiness is positive and this relationship is statistically significant which means by increasing students' accessible targets, their self-directed learning readiness will be increased.
7. Students’ perception from learning environment has 11.6 percent correlation with self-directed learning readiness and explains 1.3% of the variance in their self-self-directed learning readiness which means correlation and relation between students' perception from learning environment and self-directed learning readiness is positive and this relationship is not statistically significant.
The findings and results of the research corresponded to some parts of findings and results of domestic researchers. The researchers in their research results pointed out the relationship and effects of different variables on self-directed learning. Safavi et al (2010) in their study concluded that the rate of self-directed learning readiness, in the majority of units under study was in high level and accommodative style was the preferred learning style. Saeid et al (2010) in their study concluded that there is a relationship between students’ self-directed learning readiness in a virtual environment and their academic achievement. The results of the present study revealed that the level of self-directed learning among the students is higher and more than expected which certainly can significantly affect on the process of education and students’ academic achievement, and even other activities. In another part of this study, it turned out; however, self-directed learning rate among women is higher than men. The results also showed that the self-directed learning readiness in students younger than 25 years is more than other students. In another part of the results it was revealed that the higher the level of students’ accessible targets, the more their self-directed learning readiness, simply put there is a close correlation between students’ accessible targets and their self-directed learning readiness. In analyzing the results of this part of the research, it seems that prediction of self-directed learning through students’ accessible targets is considered a normal flow, because the main elements of self-directed learning can be achieved by designing the goals correctly and making them operational. In another part of the results of this study it was found that there is a positive relationship and correlation between the students' learning environment and the level of their readiness for self-directed learning. In analyzing the results, it can be said that learning environment generally plays an important role in students' learning. It seems that students' perceptions of learning environment with what exists in reality are different, and they are always looking for more desirable learning environment. Therefore, by considering all analysis and the issues presented briefly, it can be concluded that the factors affecting self-directed learning readiness include elements which are effective on the students’ self-directed learning readiness including the three main variables: the first variable is students’ accessible targets achieved when the students feel satisfied and successful by their own study. The second variable is the learning approaches which are students' attitudes toward studying and its common practice and their learning. Finally, the third variable is the learning environment which means major issues about the students' learning environment and their experiences in compared to self-directed learning activities.
Hadiseh Monkaresi, Asadollah Abbasi, Reshvan Razyani
References
Caffarella, R., & Merriam, S. B. (2000). Linking the individual learner to the context of adult learning. Handbook of adult and continuing education, 55-70.
Chang, C. C. (2006). Evaluating the effects of competency-based web learning on self-directed learning aptitudes. Journal of Computers in Mathematics and science Teaching, 26(3).
Elliott, E. S., & Dweck, C. S. (1988). Goals: An approach to motivation and achievement. Journal of personality and social psychology, 54(1), 5.
Fisher, M., King, J., & Tague, G. (2001). Development of a self-directed learning readiness scale for nursing education. Nurse education today, 21(7), 516-525.
Houle, C.O. (1961). The Inquiring mind: A study of the adult who continues to learn. Madison: University of Wisconsin Press
Karimi, R., Arendt, C. S., Cawley, P., Buhler, A. V., Elbarbry, F., & Roberts, S. C. (2010). Learning bridge: curricular integration of didactic and experiential education. American journal of pharmaceutical education, 74(3).
Long, H. B. (2009). Skills for self-directed learning. Retrieved, 2(22), 2010.
Long, H. B., & Morris, A. S. (1996). The relationship between self-directed learning readiness and academic performance in a nontraditional higher education program. H. Long & Associates, Current developments in self-directed learning, 139-156.
Kazemi, H., & Omidi Najaf Abadi, M. (2012). Factors affecting the level of readiness for self-directed learning (SDLR) of students of faculty of Agriculture, Science and Research Branch of Tehran. Journal of researches on agricultural extension and education, 5 (4), 19-26.
Nadi, M., & Sajadian, A. (2006). Standardizing the self-directed learning scale in the case of high school female students in Isfahan, Journal of Educational Innovations, 18.
Naeimi, L., Bigdeli, SH., & Soltani Arabshahi, K. (2012). The level of readiness of self-directed learning in medical students. Journal of training strategies, 5 (3): 177-181.
Pintrich, P. R. (1999). The role of motivation in promoting and sustaining self-regulated learning. Ramsden, P. and Entwistle, N. J. (1981). Effects of Academic Department on Students Approaches
to Studying. British Journal of Educational Psychology. 51, 368-383.
Saeid, N., Zareh, H., Moosapoor, N., Sarmadi, M., & Hormozi, M. (2010). Studying the relationship between students’ self-directed learning readiness in virtual environment and their academic achievement. Journal of Higher Education, 3.
Shahrabadi, A., Rezaian, M., & Haghdoost, A. (2013). Predicting the learning results based on learning course experiences at Rafsanjan University of Medical Sciences in 2013. Journal of Medical Science, 12 (11): 929-942.
Teo, Y. H., & Ting, B. H. (2010). Singapore education ICT masterplans (1997–2004). ICT for self-directed and collaborative learning, 2-14.
Tough, A. (1978). Major learning efforts: Recent research and future directions. Adult Education Quarterly, 28(4), 250-263.
Tough, A. (1979). The adult learning projects (2nd ed.). Toronto: OISE.
Yuan, H. B., Williams, B. A., Fang, J. B., & Pang, D. (2012). Chinese baccalaureate nursing students' readiness for self-directed learning. Nurse education today, 32(4), 427-431.