> REPLACE THIS LINE WITH YOUR PAPER IDENTIFICATION NUMBER (DOUBLE-CLICK HERE TO EDIT) < 1
Abstract— The SMAP (Soil Moisture Active Passive) mission
provides global surface soil moisture product at 36 km resolution from its L-band radiometer. While the coarse resolution is satisfactory to many applications there are also a lot of applications which would benefit from a higher resolution soil moisture product. In this paper the SMAP radiometer-based soil moisture product was downscaled to 1 km using MODIS (Moderate Resolution Imaging Spectroradiometer) data, and validated against airborne data from the PALS (Passive Active L-band System) instrument. The downscaling approach uses MODIS land surface temperature and normalized difference vegetation index to construct soil evaporative efficiency, which is used to downscale the SMAP soil moisture. The algorithm was applied to one SMAP pixel during the SMAP Validation Experiment 2015 (SMAPVEX15) in a semiarid study area for validation of the approach. The results showed that the approach had reasonable skill (root mean square difference of 0.053 m3/m3 for 1-km resolution and 0.037 m3/m3 for 3-km resolution) in resolving high resolution soil moisture features within the coarse scale pixel. The success benefits from the fact that the surface temperature in this region is controlled by soil evaporation, the topographical variation within the chosen pixel area is relatively moderate and the vegetation density is relatively low over most parts of the pixel. The analysis showed that the combination of the SMAP and MODIS data under these conditions can result in a high resolution soil moisture product with an accuracy suitable for many applications.
Index Terms— SMAP, MODIS, Soil Moisture, LST, NDVI,
PALS
I. INTRODUCTION
Soil moisture has a critical role in water and energy balance processes at the interface between the land surface and the atmosphere. It determines the partitioning of the incoming solar and atmospheric radiation into latent, sensible, and ground heat fluxes, and the partitioning of the precipitation into surface runoff and infiltration. It has an important impact on agricultural and irrigation management practices, food
The research described in this publication was carried out at the Jet Propulsion Laboratory, California Institute of Technology, under a contract with the National Aeronautics and Space Administration. It was supported in part by the JPL Advanced Earth Missions Program, the NASA SMAP project, and the NASA SUSMAP program (NNN13D503T).
A. Colliander, J.B. Fisher, G. Halverson, S. Misra, and S. Yueh are with the Jet Propulsion Laboratory, California Institute of Technology, Pasadena, CA 91109 USA (e-mail: [email protected]).
production and the organization of natural ecosystems and biodiversity. Low frequency passive microwave remote sensing has been established as the primary tool for global retrieval of soil moisture due to its sensitivity to subsurface soil moisture and relative insensitivity to vegetation [1]. The NASA Soil Moisture Active Passive (SMAP) [3] and European Space Agency Soil Moisture Ocean Salinity (SMOS) [2] missions utilize L-band radiometers to map global soil moisture every 2-3 days. Both missions use instrument technologies that result in aperture sizes that provide data with a spatial resolution of about 40 km [4], [5]. However, many applications would benefit from significantly finer spatial resolution (e.g. [6]). SMAP originally included also an L-band synthetic aperture radar at 1-3 km resolution, which was intended to downscale the radiometer-based soil moisture measurements to a 9 km resolution [7]. However, the radar failed after about 3 months of operation. In this paper, an alternative downscaling approach is applied to SMAP data.
Several approaches have been proposed for soil moisture downscaling. Some of them use fine resolution microwave measurements (e.g., [8], [9]) and some use measurements at optical wavelengths (e.g., [10], [11]). These algorithms include approaches where thermal infrared land surface temperature (LST) signatures are used as the main source of information to disaggregate the coarse resolution soil moisture pixels into finer ones. The algorithm applied in this paper to downscale the coarse resolution SMAP radiometer-based soil moisture product is based on the relationship between soil evaporative efficiency (SEE) and soil moisture [12]. In [13] an operational algorithm for SMOS downscaling with MODIS data using the SEE-soil moisture relationship was presented.
In order to assess the quality of the downscaled soil moisture values, reference soil moisture observations are required. In situ measurement networks are typically used in soil moisture validation. However, they are not optimal for assessing the spatial patterns that the downscaling approaches are set to
O. Merlin is with the Centre d'Etudes Spatiales de la Biosphère, Eco-hydrologie, Toulouse, 31401, France (email: [email protected]).
R. Bindlish is with the NASA Goddard Space Flight Center, Greenbelt, MD 20771 USA (email: [email protected]).
T. J. Jackson is with the USDA Agricultural Research Service, Hydrology and Remote Sensing Laboratory, Beltsville, MD 20705 USA (email: [email protected]).
Spatial Downscaling of SMAP Soil Moisture
using MODIS Land Surface Temperature and
Greenness during SMAPVEX15
Andreas Colliander, Joshua B. Fisher, Gregory Halverson, Olivier Merlin, Sidharth Misra, Rajat
Bindlish, Thomas J. Jackson, Simon Yueh
resolve. Problems arise from resolution cell representation, station to station biases and consistency of data records. A more robust approach is to use a higher resolution remote sensing instrument to capture the spatial patterns. Airborne microwave radiometers at L-band frequency can achieve much finer resolution than their spaceborne counterparts. A field experiment for soil moisture validation of SMAP was conducted in southern Arizona in August 2015 called SMAP Validation Experiment 2015 (SMAPVEX15). In this experiment, an airborne L-band instrument PALS (Passive Active L-band Sensor) was deployed to measure an area consisting of three SMAP pixels on seven days. The SMAPVEX15 data set offers a uniquely appropriate reference soil moisture data set for testing the algorithm for two reasons. First, the soil moisture disaggregation methods utilizing LST perform optimally when surface temperature is controlled mainly by soil evaporation. This is generally the case in the SMAPVEX15 domain. Second, testing a downscaling algorithm requires at some spatial heterogeneity in the measured soil moisture fields. The experiment was designed to coincide with North American Monsoon, which resulted in small scale convective precipitation events that created very heterogeneous scenes in terms of soil moisture [14].
Here we present results of SMAP soil moisture product downscaling using MODIS data over the SMAPVEX15 domain and validation with the PALS 1-km soil moisture measurements.
II. DISAGGREGATION ALGORITHM
The higher resolution soil moisture is estimated by using the difference between the high resolution SEE and the average SEE within the coarser scale pixel. This difference is multiplied by the relationship of soil moisture and SEE before adding to the soil moisture retrieved with SMAP:
𝑆𝑀 = 𝑆𝑀𝑆𝑀𝐴𝑃+ 𝜕𝑆𝑀
𝜕𝑆𝐸𝐸(𝑆𝐸𝐸 − ⟨𝑆𝐸𝐸⟩𝐶)
(1)
where 𝑆𝑀𝑆𝑀𝐴𝑃 is the SMAP soil moisture for the pixel (coarse
resolution) [m3/m3]; 𝜕𝑆𝑀 𝜕𝑆𝐸𝐸⁄ is the partial derivative of soil
moisture evaluated with respect to SEE [m3/m3]; SEE denotes
SEE at the 1-km resolution [-], and ⟨𝑆𝐸𝐸⟩𝐶 is the spatially averaged SEE [-], in which C stands for coarse scale. SEE is estimated as follows:
𝑆𝐸𝐸 = 𝑇𝑠,𝑚𝑎𝑥− 𝑇𝑠 𝑇𝑠,𝑚𝑎𝑥− 𝑇𝑠,𝑚𝑖𝑛
(2)
where the soil skin temperature [K] is defined as: 𝑇𝑠=𝑇𝑀𝑂𝐷𝐼𝑆− 𝑓𝑣(𝑇𝑣,𝑚𝑖𝑛+ 𝑇𝑣,𝑚𝑎𝑥) 2
⁄ 1 − 𝑓𝑣
(3)
and the end members of soil (subscript s) and vegetation (subscript v) temperature Ts,min, Ts,max, Tv,min, and Tv,max are estimated as described below. TMODIS stands for the altitude corrected land surface temperature from MODIS [K], and fv is the fractional vegetation cover [-] estimated as follows:
𝑓𝑣=𝑁𝐷𝑉𝐼𝑁𝐷𝑉𝐼𝑀𝑂𝐷𝐼𝑆− 𝑁𝐷𝑉𝐼𝑠 𝑣− 𝑁𝐷𝑉𝐼𝑠
(4)
where NDVIMODIS is the normalized difference vegetation index from MODIS [-], and NDVIs and NDVIv stand for NDVI fraction for bare and full vegetation cover, respectively. The altitude effect on the surface temperature is accounted for within each pixel by using a coefficient of 6°C/km as given in [15].
The end members of the temperature range are determined within the coarse scale pixel following the approach presented in [15] accounting for the fact that the selected pixel in the SMAPVEX15 domain has a generally low amount of vegetation with fv < 0.5: 𝑇𝑠,𝑚𝑖𝑛= min(𝑇𝑀𝑂𝐷𝐼𝑆) 𝑇𝑣,𝑚𝑖𝑛= min(𝑇𝑀𝑂𝐷𝐼𝑆) 𝑇𝑠,𝑚𝑎𝑥= max(𝑇𝑀𝑂𝐷𝐼𝑆) 𝑇𝑣,𝑚𝑎𝑥= max( 𝑇𝑀𝑂𝐷𝐼𝑆− 𝑇𝑠,𝑚𝑎𝑥(1 − 𝑓𝑣) 𝑓𝑣 ) (5)
A critical part in the algorithm is the estimation of𝜕𝑆𝑀 𝜕𝑆𝐸𝐸⁄ . In this study, the following approximation was used: 𝜕𝑆𝑀 𝜕𝑆𝐸𝐸⁄ = 𝑎1 𝑁∑ 𝑆𝑀𝑆𝑀𝐴𝑃,𝑖 ⟨𝑆𝐸𝐸⟩𝐶,𝑖 𝑁 𝑖=1 (6)
where N is the number of days and a is an experimental tuning parameter. In this study, a=0.5 was used.
III. DATA
A. SMAPVEX15 and PALS Soil Moisture Data
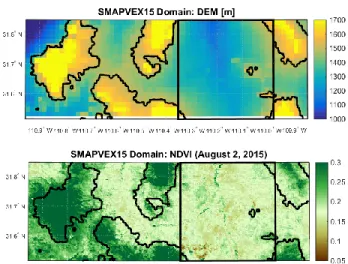
The SMAPVEX15 field experiment was carried out in southern Arizona, USA (31.7°N, 110.3°W) between August 2 and 18, 2015 [14]. The objective of the experiment was the validation of SMAP soil moisture products, particularly to obtain a data set for assessment of spatial downscaling techniques. The campaign domain extended over three 36-km SMAP pixels that were covered with the airborne PALS instrument seven times. In situ soil moisture measurements consisted of a permanent network that was augmented with a temporary network and manual sampling. The location and timing of the experiment was chosen to capture spatially heterogeneous soil moisture conditions. In this region, the North American Monsoon generates small scale convective storms that can result in highly variable soil moisture [16]. The landscape of the region is characterized by shrub and grass rangeland. The domain includes significant variation in elevation with lowest points at about 1000 m above mean sea level (MSL) and mountains reaching 2600 m above MSL. This has a notable impact on the land surface temperature distribution, and subsequent soil moisture, across the domain. Figure 1 shows the digital elevation model (DEM) and normalized difference vegetation index (NDVI) on August 2, 2015 based on MODIS. The analysis in this study focuses on the SMAP pixel outlined in the figure with a square. Within this particular pixel area, the elevation variation and amount of vegetation is moderate. See [14] for more details about the experiment domain.
The PALS instrument collects coincident (in time and place) radar and radiometer measurements [17]. Both measurements are obtained through the same antenna in a fast-switching sequence. PALS has been used in several soil moisture studies in the past in various configurations (e.g., [18]-[22]). During SMAPVEX15, PALS was installed on a DC-3 aircraft. For SMAPVEX15, the flights were made at an altitude of 2300 m above ground. The instrument provides a footprint of 1100 m (along scan) by 1500 m (radially) on the ground with an effective resolution of about 1200 m (square root of the area of the footprint ellipse). The PALS brightness temperature observations were translated into soil moisture as described in [14]. The soil moisture was assessed with respect to in situ measurements in the Walnut Gulch Experimental Watershed (WGEW); the RMSD was found to be 0.016 m3/m3 and the
correlation 0.83.
B. SMAP Soil Moisture Data
The SMAP Level 2 Soil Moisture Passive (L2SMP) product was used in this study. Details of the SMAP L2SMP algorithm are presented in [23]. The baseline algorithm uses vertically polarized brightness temperature and a single channel algorithm [24]. The soil moisture retrieval takes place on the SMAP 36-km EASE-2 grid. Because the grid samples the ground in intervals of 36-km, SMAP developed an additional process for retrieving the 36-km soil moisture at 3-km intervals. This so-called “validation grid” processing allows placing the 36-km retrieval pixels optimally with respect to in situ stations to reduce uncertainties arising from misalignment of the retrieval and the ground-based reference data. A centered validation grid pixel was defined over the WGEW. The analysis here focuses on the 6 AM overpasses, which is the nominal observation time for SMAP; because it is expected that early morning condition surface and vegetative thermal conditions are more consistent with the isothermal assumptions made in the retrieval algorithm.
C. MODIS Data
The daily L3 MODIS/Terra LST and emissivity product on the global 1-km grid (MOD11A1, Version 5) was used for LST [25], and the 16-day L3 MODIS/Terra vegetation index product on the global 250-m grid (MOD13A1, Version 5) was used for NDVI [26]. The local overpass time for the data acquisitions was around 10:30 AM. The LST data was resampled and NDVI data aggregated onto a 1-km grid over the domain. The quality flags of MOD11A1 were used to screen out LST data of questionable quality for determining the soil and vegetation end members (see Section II). Only MODIS data with a quality flag that showed good quality were used with one exception. It was allowed that the average emissivity error was within 0.02 (as opposed to 0.01) because this significantly increased the available data. The quality flagging procedure resulted in the omission of the second (August 5) and the last PALS flight day (August 18).
IV. RESULTS
The algorithm described in Section II was applied to the SMAP and MODIS data on each PALS flight day over the pixel highlighted in Figure 1. The area was required to be at least 50% cloud free, which was the case on the PALS flight days. As mentioned earlier, the SMAP pixel was chosen so that the downscaled area does not include large elevation changes, which would cause artifacts even with the elevation compensation (due to illumination effects [27]). The pixel contains only light to moderate vegetation, except for the narrow riparian areas. Denser vegetation is found at higher altitudes in this region. The low vegetation density simplified the retrieval because it made the partitioning between vegetation and soil temperature less critical.
Figure 2 shows the downscaled SMAP soil moisture with PALS soil moisture. The maps indicate that most of the soil moisture patterns observed with PALS are successfully replicated with the downscaling process. In some cases, the magnitude of soil moisture is notably different while the patterns are still clearly identifiable (such as on August 2). Some artifacts can be identified as well. For example, on August 13 in the southeastern corner the wet areas do not correspond to PALS soil moisture. This may be the result of poor quality LST data because some of the quality flags are raised around this area. The NDVI map in Figure 1 shows the riparian area in the middle of the pixel. The downscaled soil moisture on August 13 and 16 appear to have a systematic difference in the soil moisture between the east and west sides of the river, but this does not correspond to the PALS soil moisture. The different sides of the river (with opposite elevation gradients) may experience different temperature dynamics, which is the likely cause for this effect.
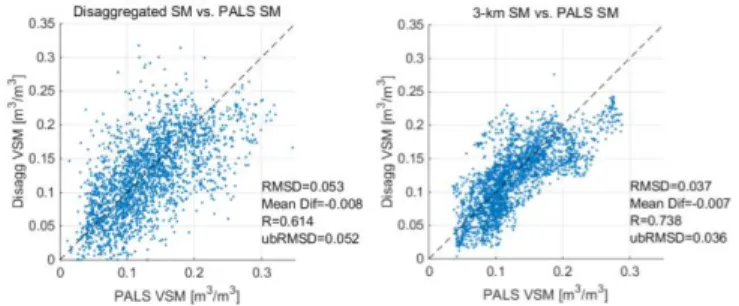
Figure 3 shows the scatterplots and metrics for the comparison of the downscaled SMAP soil moisture and the PALS soil moisture. Figure 3a shows the result for 1-km resolution and Figure 3b shows the results after averaging both the downscaled and PALS soil moisture to 3-km resolution. In both cases the mean difference is very small (but non-zero). The
Figure 1. SMAPVEX15 experiment domain. (a) Digital Elevation Model (DEM). (b) Normalized Difference Vegetation Index (NDVI) on August 2, 2015. The square denotes the SMAP 36-km pixel used in the analysis and contours show the areas with elevation higher than 1500 m.
unbiased root mean square difference (ubRMSD) decreases and the Pearson correlation (R) increases with averaging, which is expected. The performance is comparable to that reported in the literature for similar types of retrieval situations (e.g., [28]; [29]; [13]). Notably, the performance at the 3-km resolution meets the SMAP performance requirement of 0.04 m3/m3
ubRMSD [30].
The uncertainty of the original SMAP soil moisture contributes to the uncertainty of the downscaled soil moisture. In order to quantify the effect of that uncertainty in this comparison, the aggregated PALS soil moisture within the pixel area was also downscaled using the same algorithm. The results were close to those reported in Figure 3 (for 1-km both RMSD and ubRMSD 0.052 m3/m3, mean difference 0 m3/m3 and
correlation 0.655; for 3-km both RMSD and ubRMSD 0.035 m3/m3, mean difference 0 m3/m3 and correlation 0.783). The
main difference when compared to Figure 3 is the zero mean difference. The ubRMSD and correlation are also slightly better but it can be concluded that differences between PALS and SMAP soil moistures are not the drivers in the error figures. This was also expected based on the fact that [14] showed that
the aggregated PALS soil moisture was very close to SMAP soil moisture
Additionally, factors that could potentially degrade the comparison results include differences in observation depth and in observation time between the satellites. LST is sensitive to temperature at the very surface of the soil or vegetation whereas L-band microwaves penetrate several centimeters into the ground depending on the wetness conditions. As such, when SMAP and PALS made their measurements early in the morning, and MODIS at 10:30 AM, not only was the sensing depth different but conditions may have changed, especially in the top surface.
V. CONCLUSIONS
A downscaling analysis of the SMAP coarse resolution radiometer-based soil moisture product using MODIS data was conducted for a semiarid rangeland site. The approach uses LST- and NDVI-based SEE to downscale the SMAP soil moisture. The algorithm was applied over one pixel in the SMAPVEX15 domain and the downscaled soil moisture was compared with airborne based high resolution soil moisture. The results showed that the algorithm, adopted from previous
Figure 2. The SMAP pixel area on the five PALS flights days. (top row) Altitude corrected MODIS land surface temperature. (2nd row) Soil evaporative efficiency. (3rd row) Downscaled SMAP soil moisture. (bottom row) PALS soil moisture..
work presented in the literature, demonstrated reasonable skill in resolving higher resolution soil moisture features within the coarse scale pixel. The analysis of the approach benefited from the features of the study domain; that the surface temperature is controlled by soil evaporation, the topographical variation within the pixel area is relatively moderate, and the vegetation density is relatively low over most parts of the pixel (the latter two aspects also contribute to reliability of the SMAP soil moisture product). The analysis presented shows that the combination of the SMAP and MODIS data under these conditions can result in a high resolution soil moisture product with an accuracy suitable for many applications.
ACKNOWLEDGMENT
The data used are listed in the references and available through NASA LP (http://lpdaac.usgs.gov/) and NSIDC DAAC (http://nsidc.org).
REFERENCES
[1] Schmugge, T.J., P.E. O’Neill, J.R. Wang (1986). Passive Microwave Soil Moisture Research. IEEE Trans. Geosci. Remote Sens., GE-24(1), 12-22. [2] Mecklenburg, S., M. Drusch, L. Kaleschke, N. Rodriguez-Fernandez, N. Reul, Y. Kerr, J. Font, M. Martin-Neira, et al. (2016). ESA's Soil Moisture and Ocean Salinity mission: From science to operational applications, Remote Sens. Environ., 180, 3-18.
[3] Entekhabi, D., et al (2010). The Soil Moisture Active Passive (SMAP) Mission. Proc. IEEE, 98(5), 704-716.
[4] Piepmeier, J.R., P. Focardi, K.A. Horgan, J. Knuble, et al. (2017). SMAP L-Band Microwave Radiometer: Instrument Design and First Year on Orbit,” IEEE Trans. Geosci. Rem. Sens., 55(4), 1954-1966.
[5] McMullan, K.D., M.A. Brown, M. Martin-Neira, W. Rits, S. Ekholm, J. Marti, J. Lemanczyk (2008). SMOS: The Payload. IEEE Trans. Geosci. Remote Sens., 46(3), 594-605.
[6] Peng, J., Loew, A., Merlin, O., & Verhoest, N. E. (2017). A review of spatial downscaling of satellite remotely sensed soil moisture. Reviews of Geophysics.
[7] Das, N.N., D. Entekhabi, E.G. Njoku, J.J.C. Shi, J.T. Johnson, A. Colliander (2014). Tests of the SMAP Combined Radar and Radiometer Algorithm Using Airborne Field Campaign Observations and Simulated Data. IEEE Trans. Geosci. Remote Sens., 52(4), 2018-2028.
[8] Narayan, U., Lakshmi, V., Jackson, T.J. (2006). High-resolution change estimation of soil moisture using L-band radiometer and radar observations made during the SMEX02 experiments. IEEE Trans. Geosci. Remote Sens., 44(6), 1545–1554.
[9] Wu, X., J.P. Walker, C. Rudiger, R. Panciera, Y. Gao (2017). Intercomparison of Alternate Soil Moisture Downscaling Algorithms Using Active-Passive Microwave Observations, IEEE Geosci. Remote Sens. Lett. 14(2), pp. 179-183.
[10] Chauhan, N. S., Miller, S., Ardanuy, P. (2003). Spaceborne Soil Moisture Estimation at High Resolution: a Microwave-optical/IR Synergistic Approach. Int. J. Remote Sens., 24(22), 4599–4622.
[11] Piles, M., Camps, A., Vall-Llossera, M., Corbella, I., Panciera, R., Rüdiger, C., et al. (2011). Downscaling SMOS-derived Soil Moisture using MODIS Visible/Infrared Data. IEEE Trans. Geosci. Remote Sens., 49(9), 3156–3166.
[12] Merlin, O, J.P. Walker, A. Chehbouni, Y. Kerr (2008). Towards Deterministic Downscaling of SMOS Soil Moisture using MODIS Derived Soil Evaporative Efficiency. Remote Sens. Environ., 112, 3935-3946.
[13] Molero, B., O. Merlin, Y. Malbeteau, A. Al Bitar, et al. (2016). SMOS Disaggregated Soil Moisture Product at 1 km Resolution: Processor Overview and First Validation Results, Remote Sens. Environ., 180, 361-376.
[14] Colliander, A., M.H. Cosh, S. Misra, T.J. Jackson, et al. (2017a). Validation and Scaling of Soil Moisture in a Semi-Arid Environment: SMAP Validation Experiment 2015 (SMAPVEX15). Remote Sens. Environ., 196, 101-112.
[15] Merlin, O., M. J. Escorihuela, M.A. Mayoral, O. Hagolle, A. Al Bitar, Y. Kerr (2013). Self-Calibrated Evaporation-Based Disaggregation of SMOS Soil Moisture: An Evaluation Study at 3 km and 100 m Resolution in Catalunya, Spain. Remote Sens. Environ., 130, 25-38.
[16] Adams, D.K., A.C. Comrie (1997). The North American Monsoon. Bull. American Met. Soc., 78(10), 2197-2213.
[17] Wilson, W., S. Yueh, S. Dinardo, S. Chazanoff, A. Kitiyakara, F. Li, and Y. Rahmat-Samii. (2001). Passive Active L- and S-Band (PALS) Microwave Sensor for Ocean Salinity and Soil Moisture Measurements. IEEE Trans. Geosci. Rem. Sens., 39(5), 1039-1048.
[18] Njoku, E. G., W. J. Wilson, S. H. Yueh, S. J. Dinardo, et al (2002). Observations of Soil Moisture Using a Passive and Active Low Frequency Microwave Airborne Sensor During SGP99. IEEE Trans. Geosci. Rem. Sens., 40(12), 2659-2673.
[19] Bindlish, R., T. Jackson, R. Sun, M. Cosh, S. Yueh, and S. Dinardo (2009). Combined Passive and Active Microwave Observations of Soil Moisture During CLASIC. IEEE Geosci. Remote Sens. Lett., 6(4), 644-648.
[20] Colliander, A., S. Chan, S.-B. Kim, N. Das, et al. (2012). Long Term Analysis of PALS Soil Moisture Campaign Measurements for Global Soil Moisture Algorithm Development. Remote Sens. Environ., 121, 309-322. [21] Colliander, A., E.G. Njoku, T.J. Jackson, S. Chazanoff, et al. (2016). Retrieving Soil Moisture for Non-Forested Areas using PALS Radiometer Measurements in SMAPVEX12 Field Campaign. Remote Sens. Environ., 184, 86-100.
[22] Barber M., C. Bruscantini, F. Grings, H. Karszenbaum (2016). Bayesian Combined Active/Passive (B-CAP) Soil Moisture Retrieval Algorithm. J. Sel. Topics Appl. Remote Sens., 9(12), 5449-5460.
[23] Chan, S., R. Bindlish, P. O’Neill, E. Njoku, et al. (2016). Assessment of the SMAP Level 2 Passive Soil Moisture Product. IEEE Trans. Geosci. Rem. Sens., 54(8), 4994-5007.
[24] Jackson, T.J (1993). Measuring Surface Soil Moisture Using Passive Microwave Remote Sensing, Hydrol. Process., 7, 139-152.
[25] Wan, Z. (1999). MODIS Land-Surface Temperature Algorithm Theoretical Basis Document (LST ATBD). University of California, Santa Barbara, Institute for Computational Earth System Science. Retrieved from http://modis.gsfc.nasa.gov/data/atbd/atbd_mod11.pdf [26] Huete, A., Justice, C., & Leeuwen, W. v. (1999). MODIS Vegetation
Index (MOD 13) Algorithm Theoretical Basis Document. NASA. Retrieved from http://modis.gsfc.nasa.gov/data/atbd/atbd_mod13.pdf [27] Malbéteau, Y., Merlin, O., Gascoin, S., Gastellu, J. P., Mattar, C.,
Olivera-Guerra, L., ... & Jarlan, L. (2017). Normalizing land surface temperature data for elevation and illumination effects in mountainous areas: A case study using ASTER data over a steep-sided valley in Morocco. Remote Sens. Environ., 189, 25-39.
[28] Djamai, N., Magagi, R., Goita, K., Merlin, O., Kerr, Y., & Walker, A. (2015). Disaggregation of SMOS soil moisture over the Canadian Prairies. Remote Sens.Environ., 170, 255-268.
[29] Malbéteau, Y., Merlin, O., Molero, B., Rüdiger, C., & Bacon, S. (2016). DisPATCh as a tool to evaluate coarse-scale remotely sensed soil moisture using localized in situ measurements: Application to SMOS and AMSR-E data in Southeastern Australia. Int. J. Appl. Earth Obs. Geoinf., 45, 221-234.
[30] Colliander, A., T.J. Jackson, R. Bindlish, S Chan, et al (2017b). Validation of SMAP Surface Soil Moisture Products with Core Validation Sites. Remote Sens. Environ., 191, 215-231.
Figure 3. Downscaled SMAP soil moisture with respect to the PALS soil moisture: (left) 1-km resolution; (right) 3-km resolution.