DHS ANALYTICAL
STUDIES 51
The RelaTionship beTween The
healTh seRvice enviRonmenT
and seRvice UTilizaTion: linking
popUlaTion daTa To healTh
FaciliTies daTa in haiTi and malawi
september 2015
DHS Analytical Studies No. 51
The Relationship between the Health Service Environment
and Service Utilization: Linking Population Data to Health
Facilities Data in Haiti and Malawi
Wenjuan Wang
Rebecca Winter
Lindsay Mallick
Lia Florey
Clara Burgert-Brucker
Emily Carter
ICF International
Rockville, Maryland, USA
September 2015
Corresponding author: Wenjuan Wang, International Health and Development, ICF International, 530 Gaither Road, Suite 500, Rockville, MD 20850, USA; phone: +1 301-407-6500; fax: +1 301-407-6501; email: [email protected]
Acknowledgment: The authors would like to thank the reviewers of this report, Mai Do and Yazoume Ye, for their invaluable comments; Tom Pullum for methodological guidance; Paul Ametepi for expert advice on Service Provision Assessment (SPA) methodology; and Shireen Assaf for helpful discussion on analytical issues encountered.
Editor: Sidney Moore
Document Production: Natalie La Roche
This study was carried out with support provided by the United States Agency for International Development (USAID) through The DHS Program (#AID-OAA-C-13-00095). The views expressed are those of the authors and do not necessarily reflect the views of USAID or the United States Government. The DHS Program assists countries worldwide in the collection and use of data to monitor and evaluate population, health, and nutrition programs. For additional information about The DHS Program, contact The DHS Program, ICF International, 530 Gaither Road, Suite 500, Rockville, MD 20850, USA; phone: 301-407-6500; fax: 301-407-6501; email: [email protected]; Internet: www.dhsprogram.com. Recommended citation:
Wenjuan Wang, Rebecca Winter, Lindsay Mallick, Lia Florey, Clara Burgert-Brucker, and Emily Carter.
2015. The Relationship between the Health Service Environment and Service Utilization: Linking
Population Data to Health Facilities Data in Haiti and Malawi. DHS Analytical Studies No. 51. Rockville, Maryland, USA: ICF International.
Contents
Tables ... v
Figures ... ix
Preface ... xiii
Abstract ... xv
Executive Summary ... xvii
1. Introduction and Literature Review ... 1
1.1. Linking Household and Health Facility Data from the Same Survey ... 1
1.2. Linking Data from Independent Household Surveys and Health Facility Surveys ... 2
1.3. Country Background and Health Systems in Haiti and Malawi ... 5
2. Data and Methods ... 7
2.1. Data ... 7
2.2. Linking Clusters and Health Facilities ... 8
2.3. Definitions of Key Variables ... 9
2.4. Statistical Analysis ... 13
3. Results ... 15
3.1. Family Planning ... 15
3.2. Antenatal Care ... 22
3.3. Facility Delivery ... 30
3.4. Care Seeking for Children’s Diarrhea ... 39
3.5. HIV Testing ... 43
3.6. Malaria-related Health Services ... 52
4. Discussion and Conclusions ... 69
4.1 Key Findings on the Association between Service Environment and Use of Health Services ... 69
4.2. Benefits of the Buffer Linkage Methodology ... 71
4.3. Methodological Lessons Learned ... 72
4.4. Study Limitations ... 73
4.5. Conclusions ... 74
References ... 75
Tables
Table 1. Characteristics of health facilities in Haiti that provide family planning services,
by residence, Haiti SPA 2013 ... 15
Table 2. Results of multivariable logistic regressions of use of modern contraceptive
methods among married women age 15-49 in Haiti, by residence ... 21
Table 3. Characteristics of health facilities in Haiti that provide antenatal care services,
by residence, Haiti SPA 2013 ... 22
Table 4. Results of multivariable logistic regressions of having 4 or more ANC visits among
women in Haiti who had a live birth in the five years preceding the survey,
by residence ... 28
Table 5. Results of multivariable logistic regressions of receiving high quality ANC among
women in Haiti who had a live birth in the five years preceding the survey,
by residence ... 29
Table 6. Characteristics of all health facilities in Haiti with normal delivery services,
facilities with BEmOC services, and facilities with CEmOC services, by residence, Haiti SPA 2013 ... 31
Table 7. Results of multivariable logistic regressions of facility delivery for the most recent
birth among women in Haiti who had a live birth in the five years preceding the
survey, by residence ... 38
Table 8. Characteristics of health facilities in Haiti that offer curative care services for
children under five years, by residence, Haiti SPA 2013 ... 40
Table 9. Results of multivariable logistic regressions of care-seeking for children’s diarrhea
at any public or private facility in Haiti among children with diarrhea in the two
weeks preceding the survey, by residence ... 43
Table 10. Characteristics of health facilities in Haiti providing HIV counseling and testing
services, by residence, Haiti SPA 2013 ... 44
Table 11. Results of multivariable logistic regressions of HIV testing in past 12 months among
women age 15-49 in Haiti, by residence ... 51
Table 12. Characteristics of health facilities in Malawi that provide curative care services for
children, by residence, Malawi SPA 2013-14 ... 52
Table 13. Results of multivariable logistic regressions of finger/heel stick in children under
five years with recent fever in Malawi, by residence ... 57
Table 14. Characteristics of health facilities in Malawi that provide malaria diagnosis and/or
treatment services, by residence, Malawi SPA 2013-14 ... 58
Table 15. Results of multivariable logistic regressions of being malaria positive among
children age 6-59 months in Malawi, by residence ... 62
Table 16. Characteristics of health facilities in Malawi that provide ANC services, by residence,
Malawi SPA 2013-14 ... 63
Table 17. Results of multivariable logistic regressions of IPTp2 among women who had
Table A1. Percentage of family planning facilities in Haiti that provide specific family
planning methods, by residence, Haiti SPA 2013 ... 79
Table A2. Percent distribution of married women age 15-49 in Haiti, by selected family
planning (FP) characteristics and background characteristics, according to residence .... 80
Table A3. Percentage of married women age 15-49 in Haiti who are currently using a modern
contraceptive method, by selected family planning (FP) characteristics, background characteristics, and residence, Haiti DHS 2012 ... 81
Table A4. Percentage of ANC facilities in Haiti that have specific items available, by type of
facility, Haiti SPA 2013 ... 82
Table A5. Percent distribution of women in Haiti who had a live birth in the five years
preceding the survey by selected ANC characteristics and background characteristics, according to residence, Haiti DHS 2012 and Haiti SPA 2013 ... 83
Table A6. Percentage of women in Haiti who had a live birth in the five years preceding the
survey and had four or more ANC visits at the last birth, by ANC service provision environment, women’s background characteristics, and residence, Haiti DHS 2012 and Haiti SPA 2013 ... 85
Table A7. Percentage of women in Haiti who had a live birth in the five years preceding the
survey and received high quality ANC, by ANC service provision environment, women’s background characteristics, and residence, Haiti DHS 2012 and
Haiti SPA 2013 ... 86
Table A8. Among facilities in Haiti that offer normal delivery care, percentage that offer
specific basic (BEmOC) and comprehensive (CEmOC) emergency care services,
by residence, managing authority, and type of facility, Haiti SPA 2013 ... 87
Table A9. Percent distribution of women in Haiti who had a live birth in the five years
preceding the survey, by ANC and delivery care characteristics and women’s background characteristics, according to residence, Haiti DHS 2012 and
Haiti SPA 2013 ... 88
Table A10. Percentage of women in Haiti who had a live birth in the five years preceding the
survey and delivered the most recent birth in a facility, by availability of obstetric care services (BEmOC and CEmOC), number of ANC visits, women’s background characteristics, and residence, Haiti DHS 2012 and Haiti SPA 2013 ... 89
Table A11. Percentage of facilities with selected items to support child curative care services
among facilities in Haiti that offer curative care for children under five, by residence, type of facility, and managing authority, Haiti SPA 2013 ... 90
Table A12. Percent distribution of children under age five years in Haiti with reported diarrhea
in the two weeks preceding the interview, by service readiness of facilities for treating childhood illness, whether care was sought for a public or private source, background characteristics of child, and background characteristics of mother, according to
residence, Haiti DHS 2012 and Haiti SPA 2013 ... 91
Table A13. Percentage of children in Haiti with diarrhea in the two weeks preceding the survey
for whom care was sought from a public or private source, by level of facility readiness (service environment) for treating childhood illness, child’s background characteristics, mother’s background characteristics, and residence, Haiti DHS 2012 and
Table A14. Percentage of facilities providing HIV counseling or testing services in Haiti that have HIV testing capacity and other items to support quality HIV testing and counseling services, by residence, Haiti SPA 2013 ... 93
Table A15. Percent distribution of women age 15-49 in Haiti, by level of facility service readiness
(service environment) for HIV testing, whether woman had an HIV test in the 12 months preceding the survey, and women’s background characteristics,
according to residence, Haiti DHS 2012 and Haiti SPA 2013 ... 94
Table A16. Percentage of women age 15-49 in Haiti who were tested for HIV in the 12 months
preceding the survey, by level of service readiness (service environment) for HIV
testing and background characteristics, Haiti DHS 2012 and Haiti SPA 2013 ... 95
Table A17. Percentage of facilities in Malawi with specific indicators of malaria diagnostic
capacity, by type of facility and residence, Malawi SPA 2013-14 ... 96
Table A18. Percentage of children under five in Malawi who had fever in the two weeks
preceding the mother’s interview, by whether the child used an ITN the previous night, background characteristics of the child, background characteristics of the mother, and residence, Malawi MIS 2012 ... 97
Table A19. Percentage of children under five in Malawi with recent fever who had a finger/heel
stick, by whether the child slept under an ITN the night before the interview, background characteristics of the child, background characteristics of the mother,
and residence, Malawi MIS 2012 ... 98
Table A20. Percent distribution of children age 6-59 months in Malawi, by whether household
owns at least one ITN, background characteristics of child, and background
characteristics of mother, according to residence, Malawi MIS 2012 ... 99
Table A21. Percentage of children age 6-59 months in Malawi who tested positive for malaria
via microscopy, by whether household owns at least one ITN, background characteristics of child, background characteristics of mother, and residence,
Malawi MIS 2012 ... 100
Table A22. Percentage of ANC facilities in Malawi that had specific items related to malaria
diagnosis, prevention, and treatment available, by type of facility and residence,
Malawi SPA 2013-14 ... 101
Table A23. Percent distribution of women age 15-49 in Malawi who had a live birth in the
two years preceding the survey, by background characteristics, according to
residence, Malawi MIS 2012 ... 102
Table A24. Percentage of women age 15-49 in Malawi who had a live birth in the two years
preceding the survey and who took at least two doses of SP for prevention of malaria at least once during ANC, by background characteristics and residence,
Figures
Figure 1. Illustration of linking DHS clusters and SPA facilities ... 9
Figure 2a. Percentage of FP facilities providing at least three modern contraceptive methods,
by residence, Haiti SPA 2013 ... 16
Figure 2b. Percentage of FP facilities providing at least three modern contraceptive methods,
by facility type, Haiti SPA 2013 ... 17
Figure 2c. Percentage of FP facilities providing at least three modern contraceptive methods,
by managing authority, Haiti SPA 2013 ... 17
Figure 3. Percent distribution of DHS clusters in Haiti by level of access to facilities with
three or more methods and residence ... 18
Figure 4. Map of bivariate relationship between the location of FP facilities in Haiti with
at least three modern family planning methods and percentage of married women age 15-49 who are currently using a modern contraceptive method by department, Haiti DHS 2012 and Haiti SPA 2013 ... 19
Figure 5. Women’s use of modern contraceptive methods in Haiti by level of access to FP
facilities with 3+ methods and residence ... 20
Figure 6. Percentage of ANC facilities with specific items for supporting ANC services
by residence, Haiti SPA 2013 ... 23
Figure 7. Boxplots of ANC readiness scores among clusters, by residence, Haiti SPA 2013 ... 24
Figure 8. Percentage of women age 15-49 who received selected components of ANC,
by residence, Haiti DHS 2012 ... 25
Figure 9. Map of bivariate relationship between facility service readiness to provide
ANC services in Haiti and women’s receipt of 4 ANC visits, by department,
Haiti DHS 2012 and Haiti SPA 2013 ... 26
Figure 10. Percentage of women in Haiti with 4 or more ANC visits by level of service readiness
and residence ... 27
Figure 11. Percentage of women in Haiti who received high quality ANC by level of service
readiness and residence ... 27
Figure 12a. Among facilities that offer normal delivery services, the percentage that provide
BEmOC and CEmOC, by residence, Haiti SPA 2013 ... 32
Figure 12b. Among facilities that offer normal delivery services, the percentage that provide
BEmOC and CEmOC, by type of facility, Haiti SPA 2013 ... 32
Figure 12c. Among facilities that offer normal delivery services, the percentage that provide
BEmOC and CEmOC, by managing authority, Haiti SPA 2013 ... 32
Figure 13a. Percent distribution of DHS clusters in Haiti by access to normal delivery service
and BEmOC, according residence ... 33
Figure 13b. Percentage distribution of DHS clusters in Haiti by access to normal delivery
service and CEmOC, according to residence ... 34
Figure 14. Map of relationship between facilities in Haiti that provide delivery services and
whether the facility offers BEmOC and percentage of women who delivered their most recent birth in a health facility, by department, Haiti DHS 2012 and
Haiti SPA 2013 ... 35
Figure 15a. Percentage of women in Haiti rural areas who delivered the most recent birth in
Figure 15b. Percentage of women in Haiti other urban areas who delivered the most recent birth in a facility, according to the availability of delivery services within the buffer ... 36
Figure 15c. Percentage of women in Haiti metropolitan areas who delivered the most recent birth
in a facility, according to the availability of delivery services within the buffer ... 37
Figure 16. Boxplots of child care readiness scores among clusters in Haiti, by residence ... 41
Figure 17. Percentage of children in Haiti for whom care was sought from a public or private
source for recent diarrhea, by level of facility service readiness to treat childhood
illness and residence ... 42
Figure 18a. Percent distribution of facilities providing HIV counseling and testing services by
capacity and readinss to conduct HIV testing, according to residence,
Haiti SPA 2013 ... 45
Figure 18b. Percent distribution of facilities providing HIV counseling and testing services by
capacity and readinss to conduct HIV testing, according to facility type, Haiti SPA 2013 ... 46
Figure 18c. Percent distribution of facilities providing HIV counseling and testing services by
capacity and readinss to conduct HIV testing, according to managing authority,
Haiti SPA 2013 ... 47
Figure 19. Percent distribution of clusters in Haiti by access to HIV testing services, according
to residence ... 48
Figure 20. Map of relationship between facilities in Haiti that provide HIV testing services and
percentage of women who were tested for HIV, by department, Haiti DHS 2012 and Haiti SPA 2013 ... 49
Figure 21. Percentage of women age 15-49 in Haiti who were tested for HIV in the 12 months
preceding the survey, by the level of access to HIV testing services and residence ... 50
Figure 22a. Percentage of facilities with sick child services that have the capacity to diagnose
malaria, by facility type, Malaria SPA 2013-14 ... 53
Figure 22b. Percentage of facilities with sick child services that have the capacity to diagnose
malaria, by residence, Malawi SPA 2013-14 ... 53
Figure 22c. Percentage of facilities with sick child services that have the capacity to diagnose
malaria, by managing authority, Malawi SPA 2013-14 ... 54
Figure 23. Diagnostic capacity of facilities with sick child services to diagnose malaria, by
residence, Malawi SPA 2013-14 ... 55
Figure 24. Proportion of children in Malawi under five with recent fever who had a finger/heel
stick by access to facilities with malaria diagnostic capacity, according to residence ... 56
Figure 25a. Percentage of malaria diagnosis/treatment facilities with ITNs available and
observed, by type of facility, Malawi SPA 2013-14 ... 59
Figure 25b. Percentage of malaria diagnosis/treatment facilities with ITNs available and
observed, by managing authority, Malawi SPA 2013-14 ... 59
Figure 25c. Percentage of malaria diagnosis/treatment facilities with ITNs available and
observed, by residence, Malawi SPA 2013-14 ... 60
Figure 26. Distribution of access to facilities with ITNs available in Malawi clusters,
by residence ... 60
Figure 27. Proportion of children age 6-59 months with a positive malaria microscopy test in
Malawi, by level of access to facilities with ITNs available and residence ... 61
Figure 28a. Proportion of ANC facilities service ready for provision of IPTp, by type of facility,
Figure 28b. Proportion of ANC facilities service ready for provision of IPTp, by managing
authority, Malawi SPA 2013-14 ... 64
Figure 28c. Proportion of ANC facilities service ready for provision of IPTp, by residence,
Malawi SPA 2013-14 ... 65
Figure 29. Percent distribution of Malawi clusters by access to IPTp services, according to
residence ... 66
Figure 30. Women’s use of IPTp2 in Malawi by level of access to ANC facilities service ready
Preface
The Demographic and Health Surveys (DHS) Program is one of the principal sources of international data on fertility, family planning, maternal and child health, nutrition, mortality, environmental health, HIV/AIDS, malaria, and provision of health services.
One of the objectives of The DHS Program is to analyze DHS data and provide findings that will be useful to policymakers and program managers in low- and middle-income countries. DHS Analytical Studies serve this objective by providing in-depth research on a wide range of topics, typically including several countries and applying multivariate statistical tools and models. These reports are also intended to illustrate research methods and applications of DHS data that may build the capacity of other researchers.
The topics in the DHS Analytical Studies series are selected by The DHS Program in consultation with the U.S. Agency for International Development.
It is hoped that the DHS Analytical Studies will be useful to researchers, policymakers, and survey specialists, particularly those engaged in work in low- and middle-income countries.
Sunita Kishor The DHS Program
Abstract
Access to and quality of health services are key determinants in utilization of health services and consequently, health outcomes. By linking DHS household data and health facility survey data, this paper explores the relationship between the service environment (service availability and readiness to provide a service) and utilization and quality of health care obtained in several health areas in Haiti and Malawi. The health areas included are family planning, maternal health care, child care, and HIV testing services in Haiti, and malaria-related health care services in Malawi. Geographically appropriate buffer zones around each cluster were determined based on area of residence—metropolitan, other urban, and rural areas in Haiti and urban and rural areas in Malawi. For each health area, data from the facilities within the buffer were summarized to cluster level to measure the cluster’s service environment relative to the health area included in the buffer zone. These cluster-level data were then linked to individual women in the household surveys. As expected, for all the health services examined in Haiti, clusters in the metropolitan area were linked to a much greater number of health facilities than clusters in other urban and rural areas. For most health areas, a significant association was found in rural areas (and other urban areas in Haiti) between access to or readiness of service provision and utilization of health services. The relationship does not hold however in the metropolitan area in Haiti; more precise measurements of the health service environment would be needed for areas with both high density of health facilities and population.
Executive Summary
Access to and quality of health services are thought to be key determinants in utilization of health services and health outcomes. However, analysis of the relationship between health services and health service utilization has its challenges. It requires data from both facilities and individuals in order to capture both service environment and service use outcomes. The DHS Program collects data at both levels through population surveys (DHS) and health facility surveys (SPA). A limited number of studies have linked the two, mostly by connecting clusters to the nearest health facility and analyzing how the physical access to health facilities, i.e. distance to the nearest facility, and/or the service provision in that health facility affects population use of health services. These studies have found an association between service environment and use of family planning (FP), maternal, curative, and HIV services. However, the geographic and temporal proximity of facility and household datasets, as well as the linking method employed, is limited and leaves room for improvement.
This study aims to fill a major gap in the knowledge base on the relationship between provision of health services and utilization of health services in developing countries. By using a broader, service-environment linkage approach, errors due to GIS displacement of clusters in DHS datasets can be minimized. The relationship between the service environment and utilization of specific services was explored for a number of health areas including family planning (FP), maternal health care, child care, and HIV testing services in Haiti, while malaria-related health care services were examined in Malawi.
Methods
The analysis was based on linked population data and health facility data from Haiti and Malawi, drawn from household surveys—the 2012 Haiti DHS and the 2012 Malawi Malaria Indicator Survey (MIS)—and service provision assessment surveys—the 2013 Haiti SPA and the 2013-14 Malawi SPA. Instead of relating health services utilization to service provision in a single facility (the nearest one), we measured the service environment comprised of all the facilities in the formal sector of each country, within a specified buffer distance. The distances were operationalized by creating a group of facilities within a 5-kilometer buffer distance from an urban cluster and a 10-kilometer buffer distance from a rural cluster. These buffer sizes were chosen to ensure that facilities within the same distance from the real location of the cluster were captured (given that urban clusters were displaced up to 2 km and most rural clusters were displaced up to 5 km by DHS). Facility-level variables for each health area, such as the facility’s capacity to provide a service or the facility’s readiness score to provide this service, were summarized at the cluster level to measure the cluster’s service environment within the specific distance. This cluster-level facility variable for each health area was then linked to clusters from the corresponding household survey.
Results
In Haiti, the results suggest that service readiness is a significant predictor of health care utilization, particularly in rural areas. Overall, the findings were not as strong in urban areas for most of the health areas covered. The results on family planning in Haiti indicate an association between the availability of contraceptive method choice and women’s use of modern contraceptive methods in rural and other urban areas. The presence of at least one facility offering a range of methods within the buffer distance from the community significantly increased adoption of modern contraceptive methods.
Antenatal care (ANC) services are widely available at health facilities in Haiti. As a result, all clusters irrespective of location have at least one ANC facility within 5 km or 10 km. However, there is limited capacity to conduct urine and blood tests, little use of ANC guidelines, and poor availability of tetanus
vaccine. In addition, our analyses showed that service readiness is an important determinant of women’s receipt of four or more ANC visits and high quality ANC, although these associations are strongly significant only in rural areas.
A significant association was found between facilities’ capacity to provide HIV testing and use of HIV testing services in rural areas of Haiti. In the metropolitan area, there was no association between the HIV service environment and use of HIV testing services. On the other hand, we found a significant positive association between the level of service readiness and care seeking for children’s diarrhea at health facilities in the metropolitan area but not in rural and urban areas.
In Haiti, one-third of other urban clusters and half of rural clusters do not have any facility with basic emergency obstetric care services (BEmOC) within the 5 km or 10 km buffer and availability of comprehensive emergency obstetric care services (CEmOC) is even more limited. Our findings indicate a strong effect of having a BEmOC facility on facility delivery in the metropolitan area; however, the results in rural and urban areas suggest that being able to access a facility providing normal delivery services, with or without BEmOC, seems more important in rural and other urban areas.
In Malawi, mixed results were found regarding availability of facilities providing malaria services and use of these services. Despite the high prevalence of malaria in rural areas of Malawi, over half of rural clusters do not have any facility within 10 km that is ready to provide intermittent preventive treatment of malaria in pregnancy (IPTp). High access to IPTp service-ready facilities is significantly associated with the IPTp2 coverage (two doses) among pregnant women in rural areas. By contrast, the association between insecticide-treated net (ITN) availability and malaria parasitemia is significant in urban areas but not in rural areas. We did not find an association between either ITN use by households and ITN provision at the health facility or an association between children’s receipt of malaria diagnostic testing and diagnostic capacity at health facilities in either urban or rural areas.
Conclusions
The buffer linkage method can be applied in several health areas to examine how the service environment affects health services utilization when there are a household survey and a health facility census conducted around the same time period. This method has also been found to be useful in settings with low density of health facilities. For most health services, a significant association is found in rural (and other urban areas in Haiti) between access to or readiness of service provision and utilization of health services. The relationship does not hold in the metropolitan area in Haiti; more precise measurements of the health service environment would be needed for areas with both high density of health facilities and population.
1.
Introduction and Literature Review
Access to health services and quality of health services are a high priority for investments designed to increase health services utilization and eventually to improve health outcomes. However, understanding the role of health service environment on use and related outcomes has been constrained by limited data and methodological challenges in such an analysis. Analysis requires both data from facilities on service provision and data from households or the community on service use outcomes. Facility assessments can provide useful information on the availability and quality of services offered by providers, while household surveys provide information on population level need and demand for services. When available, combining data from representative household surveys and health facility assessments can be used to explore the relationship between service environment and use, including the role of service availability and quality in population-level use of health services. However, linking these two types of data is not straightforward primarily because of two reasons: 1) two types of surveys are independently conducted and are not necessarily designed for linking purposes; 2) the true location of clusters in household surveys is unknown due to geographic displacement of clusters for the purpose of protecting confidentiality.
This study aims to fill the gap in the literature on the relationship between provision and utilization of health services by using a service environment linkage approach. Using data from independent household and health facility surveys in Haiti and Malawi, we linked households to health facilities within a specified distance (i.e. buffer) and used data from linked health facilities to measure the service environment. The relationship between the service environment and utilization of specific services was explored for a number of health areas including family planning (FP), maternal health care, child care, and HIV testing services in Haiti and malaria-related health care services in Malawi.
1.1. Linking Household and Health Facility Data from the Same Survey
Some studies have linked household and health facility data using information from the same survey. Early household surveys, including the World Fertility Surveys and the Demographic and Health Surveys (DHS) (Phase I to III) included a Service Availability Module (SAM). However, the SAM approach used key informants to generate data on service availability among a range of public and private providers and few visited actual facilities, raising questions about the validity of these data (Casterline 1987). Such data measured perceived access to services within a community rather than true access (Rose et al. 1999). A number of secondary analyses have linked facility characteristics and population data from these early DHS surveys that included SAM (Do and Koenig 2007; Magnani et al. 1999; Mroz et al. 1999; Pullum 1991; Steele, Curtis, and Choe 1999). These analyses linked facility and individual data collected during the same survey in the same cluster. Pullum and colleagues developed a hierarchal model to assess the impact of service environment on contraceptive use. Their analysis of Guatemala 1987 DHS data found that increasing distance and travel time acted as a barriers to contraceptive use (Pullum 1991). Two similar analyses linked FP service availability data from the 1992 Morocco DHS with individual data for the 1992 and 1995 DHS. These analyses found a significant association between the availability of FP methods at the closest public clinic and contraceptive use (Magnani et al. 1999) and proximity to a public health facility with increased adoption of modern FP methods after birth (Steele, Curtis, and Choe 1999). An analysis of the Vietnam 1997 DHS found that longer travel time to a commune health center was associated with significantly greater odds of discontinuing first and all methods of contraception. Individuals residing in communities with high quality health centers were also less likely to discontinue a method (Do and Koenig 2007). However, Mroz and colleagues’ analysis of the 1992 Tanzania DHS and its 1993 facility supplement with additional service accessibility component found perceived facility quality, as reported by key
informants, was a better predictor of contraceptive use than time, distance, or perceived accessibility of a FP facility (Mroz et al. 1999).
Rose and colleagues assessed the association between service environment and both use of FP and maternal health services in ten countries using data from the women’s questionnaire and SAM from DHS III surveys. This analysis found that across the ten countries representing the Latin American and Caribbean, Asia, and Africa regions, rural women living nearer to health services were not only more likely to use a modern contraceptive method, but also seek antenatal care (ANC) earlier and more frequently, deliver at a facility, and deliver with a skilled provider (Rose et al. 1999).
1.2. Linking Data from Independent Household Surveys and Health Facility Surveys
1.2.1. Household and health facility surveys used in linking analyses
Multiple nationally representative stand-alone health facility surveys are now routinely conducted, including the Service Provision Assessment (SPA) by the DHS Program and the Service Availability and Readiness Assessment (SARA) by the World Health Organization (WHO 2014). Both the SPA and SARA collect nationally representative information on formal health facility readiness using an inventory scoring system. The SPA additionally collects data of adherence to standards of care through direct observation and client exit interview. These surveys typically collect information on a sample of formal sector health facilities. They do not collect data from community-based or informal points of care that may constitute the source of care for a significant proportion of health events. The SPA collects data from a census of health facilities in a limited number of countries (Hozumi et al. 2006).
Beyond the SPA and SARA, there are additional mechanisms for collecting data on service provision. The World Bank has been conducting Service Delivery Indicator (SDI) surveys in several African countries to collect data on service delivery in education and health (The World Bank 2015). Zambia and Malawi have collected data on all public facilities and a sample of private facilities using the Japanese International Cooperation Agency’s (JICA) Health Facility Census tool (Hozumi et al. 2006). Population Council’s situation analysis has also been used in the past to capture health facility data on availability of reproductive services (Fisher et al. 1992). Other studies have been implemented to collect both population and facility data for specific programs or evaluation.
1.2.2. Linking analyses in various health areas
A number of analyses have linked population data from DHS and health facility data from SPA to look at the association between FP service availability, quality, and contraceptive use. Hong and colleagues looked at the association between service quality and IUD use, using data on household clusters from the Egypt 2003 Interim DHS within 10 km of a public facility providing FP services sampled in the 2002 SPA. Their analysis found use of an IUD from a public facility was positively associated with living within the catchment area of a public facility with higher quality counseling and examinations. However, the authors note women may not have used the nearest facility (Hong, Montana, and Mishra 2006). Wang and colleagues analyzed FP data from four East African countries using regional administrative boundaries to link individual data and facility data on service environment, calculated as an index of quality of FP counseling, infection control, pelvic examination, and management practice. Their analysis found both an increase in the regional average number of available contraceptive methods and more favorable service environment were associated with greater odds of a woman in the region using a modern contraceptive method (Wang et al. 2012).
Other analyses have used targeted household and facility surveys to assess the influence of service environment on FP. Gage and Zomahoun used linked data from the 2009 Community Participation for Action in the Social Sectors project health facility and household surveys to look at the association between FP service environment and contraceptive outcomes in five Nigerian states. Their analysis found both better reproductive health staff training and stronger quality of provider-client interactions were associated with increased odds of modern contraceptive use within an local government area (Gage and Zomahoun 2011). Using data on individual reproductive health status and facility reproductive services from the 1999 Delivery of Improved Services for Health (DISH) Evaluation Surveys in Uganda, Charles et al. found that proximity to a private health facility was associated with increased contraceptive use in urban areas; but none of the family planning service environment factors was independently associated with current use of modern contraception in rural areas (Katende, Gupta, and Bessinger 2003). Mensch and colleagues’ analysis of the 1992 Peru situation analysis and 1991-1992 DHS found increased contraceptive prevalence was associated with increased quality of facility care within the cluster. Quality of care was defined using an index of method availability, cleanliness, privacy, counseling, and provider method bias and restrictiveness (Mensch, Arends-Kuenning, and Jain 1996).
A number of analyses have also looked at the relationship between service provision and maternal health services coverage. Wang and colleagues analysis of 2012 Haiti DHS and 2013 SPA data found higher average service readiness within 10 km of a cluster was associated with increased use of delivery services (Wang et al. 2014). In this study service readiness was assessed as a set of WHO-defined indicators of facility readiness to provide good-quality delivery services. A study by Gabrysch and colleagues using the Zambia DHS 2007 and national data from the Zambia Health Facility Census 2005 found increasing geographic distance was associated with decreasing odds of a woman delivering in a health facility. Access to higher-level health facilities was associated with increased odds of facility delivery. The authors noted the potential misclassification of level of obstetric care due to the difference in timing of the two surveys and imprecision in distance measures as a result of DHS cluster displacement and missing geo-coordinates (Gabrysch et al. 2011). Linking National Facility Censuses and DHS in Zambia and Malawi, Lohela et al. found that distance to the closest facility with delivery care was significantly associated with use of facility for delivery in both countries. Higher level of care in closet facility also increased use of facility delivery in Zambia but not in Malawi (Lohela, Campbell, and Gabrysch 2012). Kyei and colleagues’ analysis of the same datasets found no association between distance to a facility or level of service provided at a facility and timing of ANC or number of visits (Kyei, Campbell, and Gabrysch 2012). An analysis using the 1991 Nepal FP and Health Survey with supplemental facility data from district records found use of ANC was associated with having a health post within the community and residing in the catchment area of a facility with higher structural quality, assessed as availability of trained staff, equipment, supplies and facilities (Acharya and Cleland 2000).
Fewer analyses have looked at the association between service environment and use of HIV volunteer counseling and testing (VCT) services or curative health services. Hutchinson and Mahlalela used household data on adult health from the 2002-2003 Eastern Cape Primary Health Care Evaluation Survey and facility data from the 2002 Eastern Cape Facility Survey to measure the association between service provision and VCT use in Eastern Cape, South Africa (Hutchinson and Mahlalela 2006). The study found that among the rural population, increasing distance from a clinic offering VCT was associated with decreasing odds of an individual being tested. Among rural men, proximity to a clinic offering rapid testing and home visits for palliative care were associated with increased odds of being tested. Another study using a sample of married women and known information on primary health clinics in southern Mozambique found increasing distance to the closest clinic was associated with decreasing odds of HIV testing (Yao et al. 2012). One study using the Household and Health Facility Survey in four health districts Sri Lanka found distance to care was the most significant determinant in choice of facility for curative services, with increasing distance associated with decreasing likelihood of facility utilization (Akin et al. 1998).
1.2.3. Linking methods and limitations
In the absence of surveys designed explicitly for linking, various methods may be used to associate data from population-based surveys, primarily the DHS, to stand-alone health facility survey data. Most analyses linked household or individual data to facilities using a measure of geographic proximity. Geographic linking methods include 1) linking households to the nearest one or more facilities either with (Hong, Montana, and Mishra 2006; Kyei, Campbell, and Gabrysch 2012) or without a limit on maximum distance to nearest facility (Akin et al. 1998; Gabrysch, Simushi, and Campbell 2011; Hutchinson and Mahlalela 2006); 2) linking households to all facilities within a defined radius (Mensch, Arends-Kuenning, and Jain 1996; Wang et al. 2014); 3) linking households to facilities within the same cluster (Acharya and Cleland 2000; Katende, Gupta, and Bessinger 2003); and 4) linking households to facilities within the same administrative unit (Gage and Zomahoun 2011; Wang et al. 2012).
There are a number of limitations associated with these analytical methods. Different linking methods may introduce errors. For example, assigning individuals or households to the nearest health facility does not account for potential provider bypassing (Rose et al. 1999; Skiles et al. 2013). Additionally, straight-line distance may not accurately reflect true provider accessibility, due to varied road distance, quality, terrain, and seasonal variation (Gage and Zomahoun 2011; Hong, Montana, and Mishra 2006; Rose et al. 1999; Wang et al. 2014). The DHS displaces household cluster locations and use of these displaced cluster locations may result in misclassification and imprecision using straight-line distance linking methods (Perez-Heydrich et al. 2013). Cluster or administrative boundary linkages do not account for potential use of providers outside of the catchment boundaries (Gage and Zomahoun 2011). Skiles and colleagues explored the issues of linking DHS household and SPA facility data using data from the 2007-2008 Rwanda Interim DHS and 2007 Rwanda SPA to simulate the effect of cluster sampling and displacement. Both sampling and displacement resulted in misclassification of cluster links and estimated relative service environment. Additionally, assigning individuals to the closest facility resulted in greater misclassification than linking an individual to all facilities within an administrative boundary. Facility sampling in particular was shown to have the potential to underestimate service availability. These findings highlight the need for careful consideration when designing or selecting studies and linking methods for these types of analyses (Skiles et al. 2013).
Stand-alone facility surveys may not be conducted at the same time as a population-based survey and sampled facilities may not correspond with the cluster locations collected through population surveys. This limits the potential viability of using these data to assess the impact of service provision on use, as facility data may not accurately reflect the service environment for a household at the time of the population survey. Additionally, any analysis that uses health facility data drawn exclusively from public health facilities excludes the contribution of private sector or community-based providers to the service environment. The potential level of contribution of non-public health facilities varies by setting and service being assessed. In summary, multiple studies have found an association between service environment and use of FP, maternal, curative, and HIV services. However, analyses that combine facility and household data require special consideration. The geographic and temporal proximity of facility and household datasets, as well as the linking method employed, must be considered during analysis and interpretation of study findings. In this study, we link nationally representative household surveys and health facility censuses in Haiti and Malawi with the buffer linkage method, which is shown to be less prone to misclassification errors due to cluster displacement (Skiles et al. 2013). The reason for choosing Haiti and Malawi is that both have a national facility census and a household survey (DHS in Haiti and MIS in Malawi) conducted within a year apart. Given the data available in DHS and MIS, we analyzed the use of multiple health services in Haiti including FP, maternal health care, child care, and HIV testing services, and the use of malaria related
health services in Malawi. The section followed overviews country background and health care systems in both countries.
1.3. Country Background and Health Systems in Haiti and Malawi
1.3.1. Haiti
Haiti is a small Caribbean country occupying the western third of the island of Hispaniola. The country is organized into 10 departments. Haiti is the poorest nation in the Western Hemisphere, with a per capita GDP of $1800 (Dowell, Tappero, and Frieden 2011) and over 80 percent of the population living below the poverty line (World Bank 2015a). Haiti has experienced political instability over much of its history and is vulnerable to natural disasters. In January 2011, Haiti experienced a devastating earthquake that killed or displaced millions and destroyed already weak infrastructure (Dowell, Tappero, and Frieden 2011). Haiti has a population of 10.32 million (WHO 2015a). Despite improvements in maternal and child survival, Haiti’s under-five mortality rate (73 deaths per 1000 live births) and maternal mortality ratio (380 deaths per 100,000 births) are the highest in the region (Cayemittes et al. 2013). High fertility (TFR 3.5) and mortality rates have contributed to a young age distribution with a median population age of 22 years (Cayemittes et al. 2013). Haiti’s life expectancy at birth is the lowest in the region at 63 years (WHO 2015a). Haiti experiences high food insecurity because of stagnant agricultural production and high food prices (Pan American Health Organization 2012). Literacy rates are low, particularly in rural areas. Less than two-thirds of the population has access to improved water and only a quarter has access to improved sanitation facilities. Infectious disease continues to contribute to a significant proportion of morbidity and mortality in the country. Acute respiratory infection, low birth weight, and diarrhea are the leading causes of under-five mortality. Haiti is the only Caribbean country still affected by malaria. Moderate HIV prevalence (2 percent of the population age 15-49 years) has contributed to increased rates of tuberculosis (Chatterjee 2008; Ivers 2011; UNDESA 2012).
Haiti has a chronically underfunded and understaffed health system (World Bank 2015a). The government health system is organized into 3 levels, including approximately 700 primary health facilities (community health centers, dispensaries, and communal hospitals), supported by 10 departmental hospitals and 4 university hospitals (Ivers 2011). The government has limited capacity to administer health services; the public sector accounts for only 38 percent of health infrastructure (Chatterjee 2008). While government expenditure on health has increased, Haiti has the lowest health care spending in the region ($83.7 purchasing power parity) accounting for 5.5 percent of total government expenditure (WHO 2015a). Much of the health system is dependent on donor funding or NGO support. Health infrastructure is limited with only 1.3 hospital beds per 1,000 population (Dowell, Tappero, and Frieden 2011). Additionally, emigration of health workers to other countries has left the country under-resourced (Cayemittes et al. 2013). The majority of health facilities and workers are concentrated in urban centers, with nearly half of health facilities concentrated in the Port-Au-Prince area. Traditional medicine plays a significant role in health care, constituting the first source of care for almost 80 percent of the population. A number of private providers and retail pharmacies also operate in the country. The majority of drug retailers are not registered and are not operated by licensed prescribers (Ivers 2011).
Cost and geographic distance to care are key barriers in access to quality health services in the country (Ivers 2011). Low access has resulted in low utilization of maternal, child, and infectious disease health services. Contraceptive prevalence remains low at 35 percent. Only 67 percent of pregnant women receive four or more ANC visits and 36 percent of births take place in health facilities. Immunization coverage is
low and fewer than half of children with fever and one-third with diarrhea are taken for care (Cayemittes et al. 2013).
1.3.2. Malawi
Malawi is a small land-locked nation in southern Africa, divided into 28 districts. Malawi is comprised of multiple ethnic groups, each with its own language. English and Chichewa are the most commonly spoken languages. Malawi’s economy is primarily agricultural and periodic droughts and flooding have often resulted in famine. Political inconsistency, corruption, and mismanagement have limited economic development, making Malawi one of the least developed nations in the world with a per capita GDP of $800 (Ministry of Development Planning and Cooperation 2010).
Malawi is a densely populated country, with a population of over 17.3 million in country of less than
100,000 km2. Malawi achieved Millennium Development Goal 4 by decreasing under-five mortality from
245 deaths per 1000 live births in 1990 to 68 deaths by 2015 (National Statistical Office and ICF Macro. 2011; WHO 2015b). The maternal mortality ratio remains high, having halved to 550 deaths per 100,000 births over the same period. Malawi’s total fertility rate is high at 5.4 births per woman, which coupled with high mortality, has resulted in a young population (National Statistical Office and ICF Macro. 2011). Almost half of the population is younger than 15 years (Ministry of Development Planning and Cooperation 2010).
Half of Malawi’s population is below the poverty line. Less than a fifth of the population resides in an urban area. The majority of the population works in the agricultural industry. Population growth, environmental degradation, periodic droughts and flooding, and barriers to importation make a large proportion of Malawians food insecure (Ministry of Development Planning and Cooperation). Almost half of children are stunted (National Statistical Office and ICF Macro. 2011). While two-thirds of the population has access to improved water, only 28 percent have access to improved sanitation facilities (Ministry of Development Planning and Cooperation 2010). Three-fifths of adults over the age of 15 are literate. Infectious diseases are the leading cause of morbidity and mortality in the country. Malaria, acute respiratory infection, and HIV/AIDS are the leading causes of under-five mortality (UNICEF 2015). Malaria is endemic in 95% of the country and accounts for 30 percent of all outpatient hospital visits according to the Malawi Ministry of Health (Ministry of Health 2005).
The government health sector accounts for approximately 60 percent of health services, 37 percent are provided by Christian Health Association of Malawi (CHAM) facilities, and private or NGO facilities account for 3 percent of the formal health sector, as reported by the Malawi Ministry of Health (Ministry of Health 2011). The government health sector includes a professional cadre of community health workers, a range of primary community health posts and centers, district hospitals, and central hospitals located in large urban centers. The government of Malawi and other stakeholders have used a sector-wide approach to direct public health efforts over the past decade. Malawi provides an Essential Health Package free of charge through the public sector and service level agreements with CHAM and non-profit facilities (WHO 2015b). Malawi is heavily dependent on aid funding, which accounts for over half of total health expenditure (World Bank 2015b). Government spending on health has increased to 18 percent of total government expenditure (WHO 2009). Malawi experienced one of the most severe health human resource crises in sub-Saharan Africa due to high mortality from HIV/AIDS, lack of training programs, and emigration (Ministry of Health [Malawi]and ICF International 2014). The number of health facilities increased from 600 in 2011 to over 1,000 in 2013 (Mueller et al. 2011), however the average number of hospital beds remains low at 1.3 beds per 1,000 population (Ministry of Development Planning and Cooperation 2010). Inadequate infrastructure, lack of essential medicines, and the distance and cost of reaching care remain barriers to health care utilization (Burgert and Prosnitz 2014).
2.
Data and Methods
2.1. Data
The analysis was based on linked population data and health facility data from Haiti and Malawi, drawn from household surveys—the 2012 Haiti DHS and the 2012 Malawi Malaria Indicator Survey (MIS)—and service provision assessment surveys—the 2013 Haiti SPA and the 2013-14 Malawi SPA. The DHS and MIS surveys provide data on the utilization of health services as well as respondents’ socio-demographic characteristics. The SPA surveys provide information on the availability of health services at health facilities and facilities’ readiness to provide good-quality services. Geographic coordinates data collected in both surveys were used to link DHS/MIS clusters and SPA facilities.
2.1.1. Population data
Population data came from the 2012 Haiti DHS and the 2012 Malawi MIS. The 2012 Haiti DHS is a population-based household survey that provides representative estimates for the country as a whole, for urban and rural areas, and for the 10 administrative departments of Haiti. The survey used a two-stage cluster sampling design. At the first stage, 445 clusters, including 45 from the temporary camps that house the population displaced by the 2010 earthquake, were selected with probability proportional to their population size from a master national sample frame. At the second stage, a systematic sample of 13,181 households was drawn in the selected clusters. All women age 15-49 in the sampled households were eligible for individual interview, in which their socio-demographic characteristics and health services utilization information were collected. The 2012 Malawi MIS is designed to provide representative data for key malaria indicators at the national level and at the regional level. A similar two-stage sample design was used to select a sample of 140 clusters and 3,500 households. All women age 15-49 in the selected households were eligible for individual interview. All children age 6-59 months listed in the household were eligible for anemia and malaria testing.
Both the DHS and MIS surveys georeferenced the locations of the sampled clusters using Global Positioning System (GPS) receivers to collect the coordinates of the center of the populated areas of the clusters. Prior to release of the geographic dataset, the cluster coordinates were verified and geographically displaced. Coordinates of urban clusters were displaced up to a maximum distance of 2 km. In rural areas, the displacement distance was up to 5 km with a further, randomly selected, 1 percent of rural clusters displaced up to 10 km (Burgert et al. 2013).
For Haiti, eight clusters with missing GPS data were excluded from the analysis. We also excluded 45 camps clusters from the analysis because respondents in these clusters were likely to reside in a different location at the time when they needed health care; therefore, the health care environment was not the same as where they were surveyed. In the end, 392 clusters (66 in the metropolitan area, 85 in other urban, and 241 in rural areas) were included in the analysis for Haiti. All 140 clusters sampled (44 in urban and 96 in rural areas) in the Malawi MIS were included in the analysis. In both countries, the analysis for each specific health service was limited to the respondents who had potential need for the service. For example, the analysis sample for ANC and delivery care was women who had a live birth in the five years preceding the survey. For family planning (FP), we restricted the analysis to all married women interviewed. Analyses of malaria outcomes were restricted to children less than five years of age (case management outcomes) and to women with recent births (prevention of malaria in pregnancy outcome). The analysis sample size and characteristics are described in the results section for each service area studied.
2.1.2. Health facilities data
Data on health facilities came from two SPA surveys—the 2013 Haiti SPA and the 2013-14 Malawi SPA— which provide a census of all the formal-sector health facilities in each country. The SPA surveys collect data on availability and readiness to provide key health services in public and private health facilities, from hospitals at the highest level to dispensaries or health posts at the lowest level. In total, 905 health facilities in Haiti and 977 facilities in Malawi were interviewed. Both SPA surveys collected GPS data of the locations of the health facilities. Unlike the DHS data, facilities’ coordinates are not displaced.
For each specific health area, only facilities providing the service were included in the analysis. For example, for delivery care, only data on 195 hospitals and health centers with beds were used in this study. Health centers without beds and dispensaries were excluded because they are not mandated to provide delivery care and are rarely used for delivery care. In analyzing FP services, only the 756 facilities that provide FP services were included in the analysis.
Facility data for this study came primarily from the facility inventory interview, which was administered to the most knowledgeable person for each specific health service within each facility. The SPA facility inventory collects data on infrastructure, equipment, commodities, and medicines that are necessary for providing specific health services.
2.2. Linking Clusters and Health Facilities
The GPS locations of all health facilities were collected in the SPA surveys in both Haiti and Malawi and released without displacement. The DHS and MIS surveys, however, are sample household surveys and the GPS location data of sampled clusters are displaced to protect respondents’ confidential data. The displacement of clusters limits our ability to link a cluster to its closest facility because the closest facility identified based on the released geographic data may not actually be the nearest facility in reality; therefore, such linkage is subject to substantial misclassification and errors (Skiles et al. 2013). In this analysis, we linked each cluster to all of the health facilities within a specific distance from the cluster and used data of the linked facilities to create measures of the service environment surrounding the cluster.
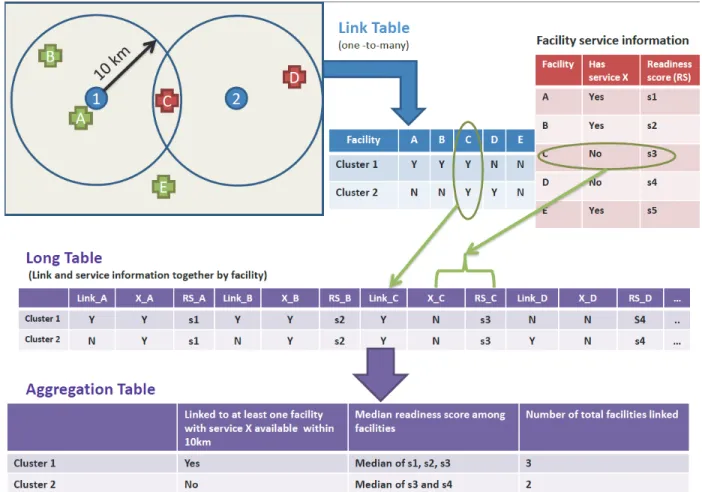
The steps to link DHS clusters and SPA facilities are illustrated in Figure 1. First, within a GIS1, a matrix
was created with the direct distance measurement from every DHS cluster location to every health facility. Second, the facility-level variable on service provision, for example, availability of service X and facility’s readiness score to provide this service, were linked to each cluster in the “long” table. The distances were operationalized, creating a group of facilities within a 5-kilometer “buffer” distance from an urban cluster and a 10-kilometer “buffer” distance from a rural cluster. These buffer sizes were chosen to ensure that facilities within the same distance from the real location of the cluster were captured (given that urban clusters were displaced up to 2 km and most rural clusters were displaced up to 5 km). Finally, data from the facilities within the buffer were summarized to the cluster level to measure the cluster’s service environment within the specific distance. Depending on the health service area, various summary indicators of facility-level data were used to obtain service measurements at the cluster-level. In the example shown in the aggregation table (Figure 1), whether there was at least one facility offering service X within a 10 km buffer from a rural cluster and the median readiness score of facilities within 10 km were used to measure the cluster’s access to service X in rural areas.
Figure 1. Illustration of linking DHS clusters and SPA facilities
2.3. Definitions of Key Variables
In this section, we describe two groups of key variables for the analysis of each type of health services. The
first group is the outcome variables, which comprise 1) utilization of a specific service, 2) quality of services
received, and 3) specific health outcome (malaria positivity). The second group is the explanatory variables,
which describe the service environment. These variables measure the availability of specific services and/or facilities’ readiness to provide the service within a defined area around each survey cluster. In assessing the service readiness, the WHO Service Availability and Readiness Assessment (SARA) Reference Manual (WHO 2014) is used to guide the selection and definitions of readiness indicators. The service environment variables are measured at the cluster level and are derived from the facility-level data based on the linkage between clusters and facilities.
2.3.1. Family planning
The outcome variable in the FP analysis is women’s use of any modern contraceptive method including female sterilization, male sterilization, pill, intrauterine device (IUD), injectables, implants, male condom, and lactational amenorrhea method, and other modern methods. Condom users are excluded from the analysis because the sources of condoms are often beyond the facilities that a SPA survey usually captures. More than 80 percent of male condom users in Haiti reported their most recent source of condoms was pharmacies, shops, or friends/relatives (Cayemittes et al. 2013).
Regarding service provision, we focused on the range of contraceptive method choice at facilities. This was assessed by the number of facilities offering three or more modern methods (excluding condom) within the specific area.
At the facility level, facilities offering FP services were identified by asking the facility manager if the facility provides, prescribes, or counsels on each of a series of modern methods and if the facility has valid products observed on-site (including pills, injectables, implants, and emergency contraception). Thus, for each FP facility the total number of modern methods provided was determined. Again, condoms were excluded.
After linking clusters and FP facilities within a buffer of 5 km around a cluster in metropolitan and other urban areas and a buffer of 10 km around a cluster in rural areas, we counted the number of facilities offering three or more methods and used this number to classify clusters into three groups: low, medium and high level of access to multiple method choices. These three levels of choice were defined by geographic areas because of the varying distribution and number of facilities. In rural and other urban areas, clusters linked
to no facilities providing three or more methods within the buffer were classified in the low-level group;
those linked to one such facility were classified in the medium-level group; and the rest, which were linked
to more than one facility offering three or more methods, were classified in the high-level group. All clusters
in the metropolitan area had one or more facilities offering three or more methods within the buffer; therefore, we divided the clusters into low-, medium-, and high-level groups based on the terciles of the numbers of facilities.
2.3.2. Antenatal care
The analysis of ANC focused on the care that women received for their most recent birth in the five years preceding the survey. Two outcomes were examined: having four or more ANC visits and the quality of ANC received during pregnancy. A woman was considered to have high quality ANC if she received 6 out of 8 types of services at least once during pregnancy: weight measured, blood pressure measured, urine sample collected, blood sample collected, iron tested, counseled on pregnancy complications, intestinal parasite treatment, and full tetanus coverage.
The key independent variable is the readiness to provide good quality ANC among the facilities linked to a cluster within the specific distance. Similar to the FP service measurement, the indicator of ANC at the cluster level is the aggregation of the facility-level data after clusters and facilities are linked. First, at the facility level, according to the WHO SARA Reference Manual (WHO 2014), eight readiness indicators were constructed to reflect ANC service readiness in four domains: staff and training, equipment, diagnostic, and medicines and commodities; their definitions are presented in Appendix Table A4. A service readiness score was then created for each facility by giving equal weights to the four domains and equal weights to the indicators within the same domain. If the target readiness score is 100 points for a facility, each domain weighs 25 points and each indicator weighs 25 divided by the number of indicators in the domain. Each facility was assigned the appropriate points based on the presence or availability of each indicator. A facility receives a total score by summing up all indicators. The readiness score is a relative summary indicator of how ready a health facility is to provide good-quality ANC services. A higher score indicates better readiness and a lower score indicates poorer readiness compared with other facilities. After linking DHS clusters and SPA facilities as described above, the service readiness to provide ANC among facilities around a cluster was measured by the median readiness score of the facilities within the buffer. Given that the readiness score is a relative measurement, we divided the clusters into low-, medium-,
and high-level groups based on the score terciles at the cluster-level. The terciles were also generated separately for the three geographic areas.
2.3.3. Facility delivery
The outcome variable for the analysis on facility delivery is dichotomous, indicating whether or not a woman used a facility for delivery care for the most recent birth in the five years preceding the survey. In analyzing the service environment, we focused on the availability of normal delivery services, basic emergency obstetric care (BEmOC), and comprehensive emergency obstetric care (CEmOC) at health facilities because of their importance in reducing maternal mortality. As mentioned earlier, only hospitals and health centers with beds that are mandated to provide delivery services were included in the analysis. We first identified facilities that provide normal delivery services based on a question asked of the facility inventory respondent: if the facility provides normal delivery service. Using the latest definitions of emergency obstetric care (WHO et al. 2009), BEmOC is considered available if the facility is able to implement the following six signal functions: administration of antibiotics, administration of uterotonic drugs/oxytoxics, administration of anticonvulsants, manual removal of placenta, assisted vaginal delivery, and removal of retained products. A full package of CEmOC includes all six BEmOC functions plus ability to perform a caesarean section and blood transfusion. Using these criteria, facilities with BEmOC or CEmOC were identified.
After linking clusters and health facilities, two service environment indicators at the cluster level were created—one on the availability of BEmOC and the other one on the availability of CEmOC. For the BEmOC indicator, clusters were categorized into three groups based upon the availability of normal delivery and BEmOC at health facilities within the specific distance from the cluster: 1) clusters linked to no facilities offering normal delivery, 2) clusters linked to a facility offering normal delivery but without BEmOC, and 3) clusters linked to a facility offering both normal delivery and BEmOC. The CEmOC indicator was constructed in a similar way with three categories: 1) clusters linked to no facilities offering normal delivery, 2) clusters linked to a facility offering normal delivery but without CEmOC, and 3) clusters linked to a facility offering both normal delivery and CEmOC.
2.3.4. Child care
Care seeking in health facilities for children’s diarrhea is the primary focus of the child care analysis. The outcome is whether the child with diarrhea was taken to a health facility. The denominator for this outcome is children under five who had diarrhea in the two weeks preceding the survey.
In measuring the service environment for providing child health care, we examined the readiness to provide child curative care among the facilities linked to a cluster within the specific distance. The method used to create the readiness measurement for child curative care is similar to that used for ANC. First, among facilities that provide child curative care, a number of indicators representing a facility’s readiness to provide child curative care in four domains (staff and training, equipment, diagnostic, and medicines and commodities) were generated according to the WHO SARA Reference Manual (WHO 2014). These indicators and their definitions are presented in Appendix Table A11. With a similar approach to that used to create the ANC readiness score, a score reflecting the relative readiness to provide child curative care services was constructed for each facility.