Using normalization to resolve RNA-Seq biases caused by amplification from
minimal input
Eirill Ager-Wick,1Christiaan V. Henkel,1,2Trude M. Haug,3and Finn-Arne Weltzien1,3
1Weltzien Laboratory, Department of Basic Sciences and Aquatic Medicine, Norwegian University of Life Sciences, Oslo,
Norway;2Institute of Biology, Leiden University, Leiden, The Netherlands; and3Department of Biosciences, University of Oslo, Oslo, Norway
Submitted 18 December 2013; accepted in final form 8 September 2014
Ager-Wick E, Henkel CV, Haug TM, Weltzien FA.Using normal-ization to resolve RNA-Seq biases caused by amplification from minimal input.Physiol Genomics46: 808 – 820, 2014. First published September 16, 2014; doi:10.1152/physiolgenomics.00196.2013.—RNA-Seq has become a widely used method to study transcriptomes, and it is now possible to perform RNA-Seq on almost any sample. Nevertheless, samples obtained from small cell populations are particularly chal-lenging, as biases associated with low amounts of input RNA can have strong and detrimental effects on downstream analyses. Here we compare different methods to normalize RNA-Seq data obtained from minimal input material. Using RNA from isolated medaka pituitary cells, we have amplified material from six samples before sequencing. Both synthetic and real data are used to evaluate different normaliza-tion methods to obtain a robust and reliable pipeline for analysis of RNA-Seq data from samples with very limited input material. The analysis outlined here shows that quantile normalization outperforms other more commonly used normalization procedures when using amplified RNA as input and will benefit researchers employing low amounts of RNA in similar experiments.
RNA-Seq; low RNA input; medaka; pituitary; normalization
RNA-SEQ HAS BECOME THE LEADING tool for transcriptomics and
has advantages over microarrays that make it possible to discover new genes and transcripts and reveal alternative splice isoforms, in addition to providing information about gene expression (6, 22, 23). The number of sequencing reads pro-duced is a function of the abundance of each transcript, and thus the read density is used to quantify gene expression (6, 17, 23). RNA-Seq obtained from small cell populations, rare tissue samples, or even single cells is becoming increasingly feasible. However, there is usually a need to amplify the material obtained from such samples due to very small amounts of RNA available for sequencing. Different amplification protocols ex-ist (3, 26, 30, 35), which could conceivably affect the down-stream gene expression results. To improve the reliability of RNA-Seq data obtained from such amplified material, data processing methods may need to be optimized.
Different features may be of importance depending on the specific research project; some might be important for all studies, while others only apply to certain settings. For instance, metrics related to accuracy and biases in gene expression measurements are of great importance for expression profiling projects. Samples with low input for an RNA-Seq analysis may result in unexpected biases in the data, for instance due to differences in library complexity. If not noticed and left untreated, this could have substantial effects on the subsequent biological interpretation.
Here, we investigate whether postsequencing computational procedures could be applied to resolve bias associated with amplification. In every RNA-Seq experiment, normalization is required to make the gene expression values comparable be-tween samples (5, 25). Usually, the only experimental effect that is removed is the difference in sequencing depth between samples, although methods have been developed to remove additional, transcript-specific effects (8).
Using a transgenic line of the model fish medaka (Oryzias latipes) where expression of green fluorescent protein (Gfp) is under control of the endogenous luteinizing hormone beta (lhb) promoter (9), we have isolated thelhb-expressing gonadotrope cells and focused exclusively on the gene expression in these cells as analyzed by RNA-Seq. This procedure results in very small amounts of cell material, necessitating presequencing amplification of mRNA. In the resulting sequencing data, we detected biases that were conceivably the result of this ampli-fication. In this study, we have attempted to reproduce these effects by data simulation and demonstrate how computational normalization procedures can ameliorate or worsen the ampli-fication bias. This has resulted in a comprehensive and general strategy that yields accurate and reproducible gene expression results starting from minimal amounts of material.
MATERIALS AND METHODS
Animals.Japanese medaka (O. latipes) of the d-rR strain were used for all experiments. Thelhb:Gfp transgenic line used in this study is homozygous for a Gfp cassette under the control of the endogenous medaka lhb promoter (9). Medaka were housed in recirculating systems with water temperature at 27–28°C and a light (L)-dark (D) cycle of L14:D10. Fish were fed a combination of dry feed SDS 300 – 400 (Special Diets Services) and live brine shrimp (Artemia franciscana) nauplii (Argent Chemical lab, Redmond, WA). All fish used in these experiments were synchronized at the embryo stage, such that all the fish in a sample were the same age. Handling and use of fish were in accordance with approved regulations for the care and welfare of research animals at the University of Oslo.
Genetic sex determination. We initially identified Juvenile and adult female medaka on the basis of secondary sex characteristics (14) and then anesthetized them in benzocaine (0.5 mg/ml) before cutting off a small piece of the caudal fin. DNA was extracted from the fin clip with the Wizard Genomic DNA Purification Kit (Promega, Madison, WI). All samples were analyzed by PCR using Platinum Taq polymerase (Invitrogen, Carlsbad, CA) according to product specifications. The same primers were used for the autosomal gene
dmrt1a and the male sex-specific gene dmrt1bY (dmy): forward 5=⫺CCGGGTGCCCAAGTGCTCCCGCTG⫺3= and reverse 5=⫺ GA-TCGTCCCTCCACAGAGAAGAGA⫺3= primer (Eurofins MWG Operon), as has been described previously (21). The cycling param-eters included an initial step at 94°C for 2 min, followed by 40 cycles comprising denaturation at 94°C for 15 s, annealing at 53°C for 15 s,
and extension at 72°C for 70 s, followed by a final elongation step at 72°C for 5 min. Female and male control samples were included in each run. Agarose gel electrophoresis of the PCR was run to evaluate the initially phenotyped female medaka. Transverse sections of the ovaries of approximately five juvenile and adult genotyped female medaka from each sampling group were prepared and subjected to standard hematoxylin-eosin staining to verify that the juvenile fish were sexually immature and adult fish were sexually mature before sampling.
Dispersed pituitary cell culture.The procedure for isolating indi-vidual cells from the pituitary of medaka was established (32) and optimized based on primary culture conditions for Atlantic cod (10). Genotyped female medaka were anaesthetized in benzocaine (0.5 mg/ml) prior to dissection. The spinal cord was quickly severed before the pituitary was collected under a dissecting microscope with fine forceps and immediately immersed in ice-cold artificial extracellular (EC) solution. The EC solution comprised 134 mM NaCl, 2.9 mM KCl, 2.1 mM CaCl2, 1.2 mM MgCl2, 1.8 mM glucose, 10 mM
HEPES, and 1% BSA dissolved in dH2O. The EC solution was
adjusted to pH 7.75 with NaOH and osmolality to 280 mOsm/kg with mannitol prior to sterile filtration. Pituitaries from⬃30 animals were pooled for each sample, except for juvenile sample 1, which was pooled from a larger amount of pituitaries (for details see Table 1).
Following sampling, the pituitaries were spun down in a tabletop centrifuge and EC solution was removed. Before cell dispersion, a solution comprising 0.1% trypsin type II-S (Sigma, St. Louis, MO) and 0.2% collagenase type I (Merck, Darmstadt, Germany) freshly prepared in ice-cold (Ca2⫹- and Mg2⫹-free) phosphate-buffered
sa-line (PBS) (Invitrogen), adjusted to pH 7.75 with NaOH and osmo-lality to 280 mOsm/kg with NaCl, was added twice to wash the pituitaries. After removal of the wash solution the pituitaries were enzymatically digested with the trypsin-collagenase solution while gently shaken in a water bath at 26°C for 30 min. The trypsin-collagenase solution was replaced by 0.1% trypsin inhibitor type I-S (Sigma) in modified PBS, supplemented with ⬃2 g/ml DNase I (Sigma), and incubated for another 20 min at 26°C. Subsequently, the tissue pieces were mechanically dissociated in ice-cold EC solution by gentle pipetting with a glass pipette. Cells were centrifuged at 200g
for 10 min, and the supernatant was replaced by 100l ice-cold EC solution, wherein the samples were resuspended. The samples were kept on ice until sorting,⬃30 min after dissociation.
Fluorescence-activated cell sorting of lhb-expressing gonadotropes.
Gfp-positive lhb-expressing gonadotropes of female medaka were sorted from the dissociated pituitary cell suspension by fluorescence activated cell sorting (FACS) on a FACS Aria Cell Sorter (BD Pharmingen, San Jose, CA) and further analyzed with the BD FACS DiVa Software v.5.0.2 (BD Pharmingen). Prior to sorting the instru-ment was cleaned and calibrated with fluorescent beads to ensure that the accuracy of sorting was⬎99%. To maintain the most optimal and stable conditions for the dispersed pituitary cells, FACS sorting was performed in EC solution (described in the previous section). To exclude cells entering apoptosis as a result of the cell isolation
procedure, the cell suspension was incubated for 30 min with 5 l allophycocyanin (APC) conjugated Annexin V (BD Pharmingen), which has the advantage of marking both early and late apoptotic cells. The cell solution was filtrated through a 70 m filter before sorting to remove potential cell clusters.
The pulse of forward scatter (FSC) and side scatter (SSC) was detected and used to gate cells such that debris and dead cells, as well as healthy doublet cells (two or more cells that stick together), were excluded from all samples. The cells exhibiting strong Gfp fluores-cence (fluorescein isothiocyanate channel, FITC) upon excitation with 488 nm laser and low APC (Annexin V) fluorescence upon excitation with 633 nm laser were collected in EC solution at 4°C. After being sorted, the cells were centrifuged at 200gfor 10 min, followed by careful removal of the supernatant. Cells were then lysed by vortexing for 1 min in 500 l Trizol (Invitrogen) and snap-frozen in liquid nitrogen.
RNA isolation and cDNA synthesis. Different methods of RNA isolation were tested to obtain as much RNA as possible from the sortedlhb-expressing cells, including Trizol and different commercial column-based protocols. Trizol was chosen as the method of RNA isolation as it resulted in a higher yield and similar RNA integrity compared with the column based protocols.
Total RNA was extracted from the Trizol lysed cells in line with the manufacturer’s guidelines, with the exception of the use of smaller volumes in all steps during Trizol isolation, as this was found to improve the yield. The snap-freezing of the FACS sorted cells in liquid nitrogen prior to RNA isolation resulted in considerably higher amounts of RNA compared with direct isolation without including this step. The RNA concentration was measured with the Qubit RNA assay kit on a Qubit fluorometer (Invitrogen). RNA integrity was assessed by Agilent 2100 Bioanalyzer on an RNA 6000 Pico chip (Agilent Technologies, Santa Clara, CA) where all samples had an RNA integrity number⬎ 8. RNA was DNase-treated with TURBO DNA-free (Ambion, Austin, TX) according to product specifications and stored at⫺80°C until cDNA synthesis.
cDNA was synthesized and amplified from total RNA using the Ovation RNA-Seq System V2 (NuGEN Technologies, San Carlos, CA), according to the manufacturer’s instructions. After amplification the cDNA was purified with MinElute Reaction Cleanup Kit (Qiagen), and the yield was measured by NanoDrop (Thermo Fisher Scientific, Waltham, MA). The purified cDNA was stored at ⫺20°C until sequencing.
Illumina library preparation and sequencing. Library preparation and sequencing were performed at the Norwegian Sequencing Centre, University of Oslo. The amplified cDNA produced by Ovation RNA-Seq System V2 was fragmented on a Bioruptor sonicator (Diagenode, Den-ville, NJ) for 12 min on low power to yield a modal fragment size of
⬃300 bp before continuing with Illumina’s protocol for library genera-tion. Fragmented cDNA (500 ng) was then used as input on a SPRIworks automated system (Beckman Coulter, Brea, CA), employing 10 cycles of PCR with Phusion polymerase. Adapters and primers were sourced from Bioo Scientific (Austin, TX). The RNA-Seq
paired-Table 1. Samples and sequencing data
Sample Juvenile 1 Juvenile 2 Juvenile 3 Adult 1 Adult 2 Adult 3
Year 2011 2012 2012 2011 2012 2012
Fish age, mo 3 2 2 8–10 8–10 8–10
Pituitaries 130 35 30 30 25 30
Sorted cells 13,000 1,000 1,000 40,000 33,000 37,000
Sorted cells of total, %* 14 6 4 23 17 28
RNA, ng 6.0 0.5 0.5 50 45 50
Raw sequencing data, Gb 13.71 17.73 17.74 16.22 17.61 18.27
Fragment size, mean⫾SD 175⫾45 225⫾63 233⫾74 172⫾44 215⫾63 228⫾74
Read pairs 68,535,934 88,660,600 88,706,345 81,119,072 88,048,386 91,341,897
end libraries were subjected to paired-end sequencing with a read length of 100 nucleotides on an Illumina HiSeq2000 instrument according to the manufacturer’s protocol. The image analysis and base calling were performed by RTA (version 1.13: http://support. illumina.com/sequencing/sequencing_software/real-time_analysis_ rta/downloads.ilmn), and the fastq files were generated and demulti-plexed by CASAVA (version 1.8.2: http://support.illumina.com/ sequencing/sequencing_software/casava.ilmn).
Read alignment and quantification.The quality of all sequencing samples was examined with FASTQC (version 0.10.1: http://www. bioinformatics.babraham.ac.uk/projects/fastqc/). We trimmed 10 nu-cleotides from the start of every read with the FASTX-toolkit (version 0.0.13, http://hannonlab.cshl.edu/fastx_toolkit/download.html). Refer-ence sequRefer-ences and annotations for the medaka genome [MEDAKA1, (12)] were obtained from Ensembl (release 67). This reference was supplemented with the sequence of the Gfp cassette, as well as the part of the fshb (follicle-stimulating hormone beta-subunit) transcript (GenBank AB541981) missing from the assembly (11). The tshb
(thyroid-stimulating hormone beta-subunit) gene was annotated based on its known transcript sequence (GenBank XM_004068796). Library insert sizes were determined from alignments of subsets of data to medaka cDNA sequences using Bowtie2 (version 2.0.0-beta6). Read pairs were aligned to the medaka genome sequence using Tophat2 (version 2.0.4) (13), using Bowtie2 as the short read aligner at “very sensitive” settings. The resulting BAM alignment files were inspected with SAMtools version 0.1.18 (18), Picard tools (version 1.73: http:// picard.sourceforge.net/), and the Integrative Genomics Viewer ver-sion 2.3 (27). Secondary alignments, i.e., alignments that meet Tophat’s criteria but are less likely to be correct than simultaneously reported primary alignments, were removed from the BAM files. Global statistics of these alignments were gathered using the Picard tools programs CollectRnaSeqMetrics, EstimateLibraryComplexity, and CollectGcBiasMetrics. Fragment (read pair) alignment counts per transcript were determined from SAM alignment files using the Python package HTSeq-count (version 0.5.3p9: http://www-huber. embl.de/users/anders/HTSeq/doc/overview.html), using the “strict” set-tings to exclude reads aligning ambiguously with respect to annotated gene structures. Counts were summarized at the level of Ensembl-annotated genes.
As an alternative quantification procedure, we used RSEM (version 1.2.15) (16) using Bowtie2 as the short read aligner. The reference was prepared from cDNAs predicted by Ensembl, using the –no-polyA option. Counts and fragments per kilobase per million mapped fragments (FPKM)-normalized expression were summarized at the level of Ensembl genes.
The commands used for alignment and quantification are available as Supplemental Material.1
Simulated data.Synthetic count datasets of different complexities were generated based on the count data of the three adult samples. These values were scaled to fragments per 10 million, pooled, and divided by 3. This way, all rare transcripts detected in only one of the samples are included in the synthetic transcriptome, albeit at very low “concentrations” (all artificial concentrations can be interpreted as transcript molecules per volume). Of this initial sample, a series of serial dilutions was made by dividing by the square root of 10, resulting in 10-fold dilution every second step. Artificial concentra-tions in the most complex sample (undiluted) ranged from 0.28 to 133900, summing up to a total of 107; in the least complex sample
(1,000⫻diluted) concentrations ranged from 0.00028 to 133.9, sum-ming up to 10,000.
Prior to simulated sequencing, these samples were amplified to a uniform total artificial RNA amount of 107(i.e., no amplification was
performed for the undiluted sample). Transcripts were amplified at rates depending on their concentration. The rates (v) were
approxi-mated by assuming Michaelis-Menten kinetics for the rate-limiting steps:
vi⫽
关
transcriptxi兴
关
transcriptxi兴
⫹KmAmplification was either linear or exponential. In linear amplifica-tion, the same template is used iteratively to produce new strands that can themselves not act as new templates. The reaction rates are then dependent only on the initial concentration of each transcript. In exponential amplification (PCR), new templates are formed at every cycle, affecting the reaction rates in the next cycle.
Finally, amplified samples were converted to counts by sampling a specified number of fragments from the concentrations assuming a Poisson process. For each transcript, this yields an integer value from a distribution with mean and variance equal to its concentration. This adds an amount of sampling noise to the amplified samples that is consistent with perfect technical replication (20) [but much lower than is usually observed for biological replicates (5, 25, 31)].
The effects of normalization procedures on the simulated data were quantified by taking the mean of the relative deviation for each gene expression valuexijfrom the overall mean for that gene:
deviation
共
xij兲
⫽ⱍ
xij⫺mean
共
xi兲
ⱍ
mean
共
xi兲
for each geneiand samplej
overall deviation
⫽
兺
i⫽0n
兺
j⫽0m
deviation
共
xij兲
nm forngenes andmsamples
Data analysis. Raw count data per gene were transformed to normalized gene expression values using scaling by the (estimated) library size and the annotated mean transcript length in kilobases (22). For library size calculation, the number of aligned fragments counted by HTSeq, as well as estimates [DESeq-like robust scaling factor, trimmed mean of M-values (TMM), and upper quartile (UQ)] from the R package edgeR (version 3.2.4) (28) were used.
Alternative normalization was performed with the R package cqn (conditional quantile normalization, version 1.6.0) (8), using the mean length of annotated transcripts per gene, and the GC% of these, as explanatory variables. In cases where quantile normalization assigned a small nonzero expression value to genes without aligning reads, the expression value was reset to zero. Quantile normalization replaces the original expression values by a common value for each expression rank (4). It may therefore occur that genes with the same expression rank in multiple samples are assigned exactly the same normalized expression value. To avoid these ties, the expression values of genes with the same rank x in two samples were adjusted upward or downward based on original fragment alignment counts per million, to values belonging to the ranks x⫺ 0.33 and x ⫹ 0.33. Expression values belonging to partial ranks were calculated by interpolation along a spline curve connecting all expression values and ranks. If more than two samples were affected, the expression values were distributed evenly along thex⫾0.33 interval.
Differential expression between juvenile and adult samples was determined using the R packages edgeR and NOISeq (version 2.0.0) (33, 34) with the NOISeqBIO option of handling biological replicates. As an expression threshold for testing, a gene was required to have at least 10 aligning fragments per million read pairs in at least two samples.
All analyses on count data were performed in R (version 3.0.1) with Bioconductor (version 2.12). The R code used for normalization and simulated amplification is available as Supplemental Material. All diagnostic plots were generated using the R package ggplot2 (version 0.9.3.1) (38).
Information with the following accession numbers: SRX641220, SRX641221, SRX641222, SRX641223, SRX641225, and SRX641226.
RESULTS
Cell selection, RNA isolation, and sequencing.Specific lhb-expressing gonadotrope cells were isolated for RNA-Seq uti-lizing a transgenic line of medaka (lhb:Gfp), and only female fish were included in this study. Females were selected based on phenotypic characteristics and subsequently subjected to a genotypic sex verification assay. The presence or absence of the male sex-determining gene, a DM-domain gene on the Y chromosome nameddmrt1bY(dmy), determines the testicular or ovarian pathway of gonad development, respectively (21, 24). While 100% of the adult fish that were sorted as females based on phenotypic differences were genotyped as females, the number decreased to⬃80% for the juveniles.
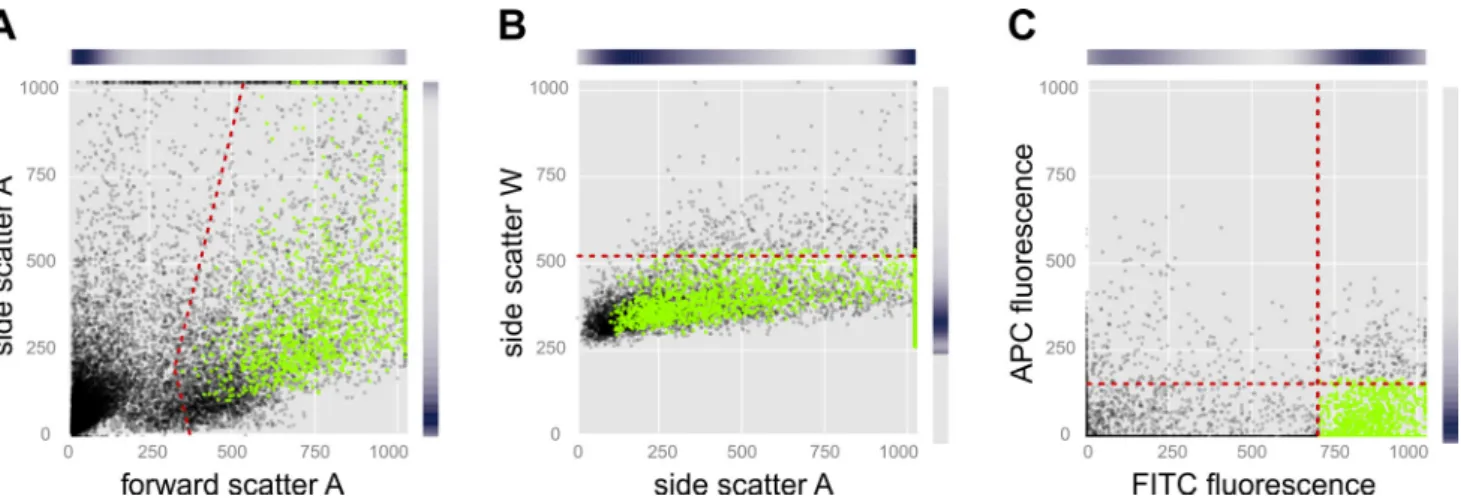
The dissection of pituitaries exhibiting Gfp fluorescence in thelhb-expressing gonadotropes was performed as depicted in Fig. 1. FACS was employed to isolate populations of lhb-expressing gonadotrope cells. Intact cells were separated from
debris based on the FSC, a measure of cell size (Fig. 2A). SSC gauges cell granularity or intracellular complexity and was used to separate single cells from doublets and clumps of cells (Fig. 2B). Finally, cells exhibiting high Gfp fluorescence and low Annexin V APC fluorescence were selected (Fig. 2C). Gfp fluorescence was very intense, possibly indicating very high levels ofgfpgene expression. In adult medaka, 17–28% of the of the total number of single pituitary cells were healthy singlet Gfp-expressing lhb-gonadotropes and were thus sorted and used for further analysis. The number was dramatically de-creased for juveniles, where 4 –14% of the cells were sorted (Table 1).
The limited amount of total RNA isolated from the samples (especially from juvenile medaka pituitaries) was insufficient to meet Illumina’s recommendations for library preparation and sequencing. We therefore decided to use the Ovation RNA-Seq System V2 as an alternative method for preparing cDNA libraries. The Ovation system is based on Ribo-SPIA technology and provides a fast and simple method for prepar-ing linearly amplified cDNA from total RNA. Sprepar-ingle primer
A
B
C
Fig. 1. Pituitary dissection from adultlhb:Gfp transgenic medaka. Fish were anaesthetized prior to dissection.A: head of medaka exposing the top of the brain after removal of skull roof.B: the brain flipped over after severing the medulla oblongata, exposing the pituitary (white arrowhead).C: the pituitary displaying Gfp fluorescence from thelhb-expressing gonadotropes can be collected using fine forceps (overlay of light- and fluorescent micrographs). Scale bars represent 500m.
isothermal amplification (SPIA) is a DNA amplification pro-cess that uses a DNA/RNA chimeric primer, DNA polymerase, and RNase H in a homogeneous isothermal assay, providing highly efficient amplification of DNA sequences (15). The amplified samples were sequenced at 100 nt paired end and generated between 69 and 91 million read pairs (see Table 1). Analysis using FASTQC did not reveal any problems with sequencing in specific samples; however, the first 10 nucleo-tides of reads displayed reduced quality in all samples and were therefore not included in further analyses.
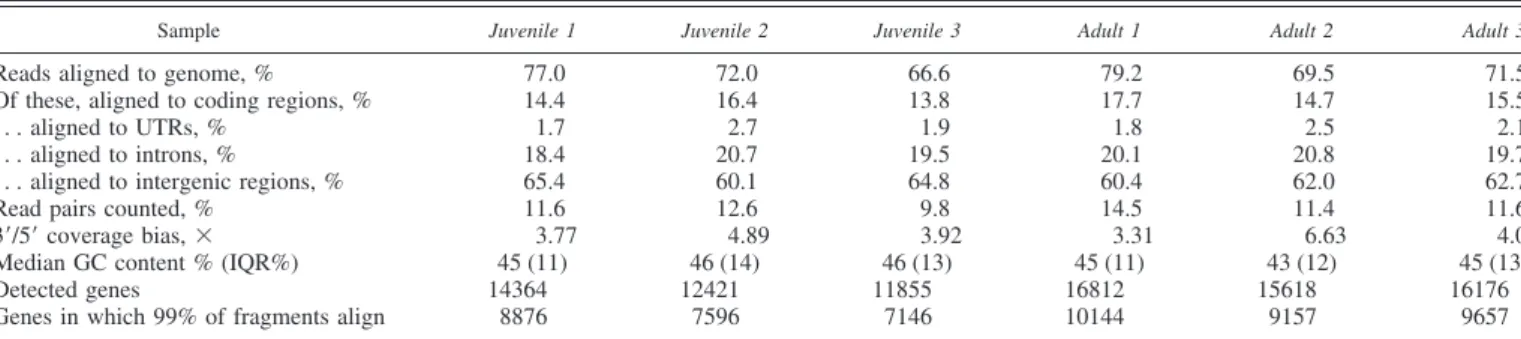
Quantification and structural biases. The long read pairs obtained in this work are suitable for RNA-Seq quantification with a reference genome, using a splicing-aware alignment program such as Tophat (36). This approach yields rich infor-mation on the transcriptome composition (e.g., transcript iso-forms). Spliced alignment of the 11–100 bp parts of the reads to the entire medaka genome resulted in alignment efficiencies of 67–79% for the different samples (Table 2). Of the aligned bases, 15.7–19.5% mapped to annotated transcripts (coding sequences and untranslated regions). All samples exhibited a distinct coverage bias towards the 3=-ends of transcripts (Table 2). A detailed analysis of the average coverage along the 1,000 most highly expressed transcripts revealed that this effect is not identical for all samples, with especially adultsample 2 show-ing higher coverage at the 3=-ends of these transcripts and less at the 5=-ends (Fig. 3A).
For each sample and each annotated gene, the number of fragments (read pairs) aligning to that gene was counted. Of 20,425 annotated genes in the medaka genome, 17,617 had at least one aligning read in at least one sample. The number of
detected genes (at least one read per gene) varied considerably between samples, ranging from 11,855 in juvenilesample 3to 16,812 in adultsample 1but was generally higher in the adult samples (Table 2). If a small threshold is added to exclude sequencing and alignment noise, the pattern remains the same (the set of genes in which 99% of fragments aligns, Table 2). The distributions of count values also vary considerably be-tween samples (Fig. 3B), indicating the need for a computa-tional normalization procedure to make samples comparable. As in every RNA-Seq experiment, raw counts need to be corrected for the total sequencing depth (i.e., the total number of aligning fragments) (22), which may differ between samples (Tables 1 and 2). In addition, juvenilesamples 2and3deviate from the common distribution pattern, which could be an indication of intrinsically noncomparable samples.
In addition to spliced alignment with Tophat, we also quan-tified fragment counts per gene with RSEM, using predicted cDNAs instead of the annotated genome as a reference. Count patterns were very similar (Pearson correlation 0.96 – 0.97 for the same samples quantified by either method), including the deviation of juvenilesamples 2and3(data not shown).
Amplification bias reproduction in synthetic data.Since the deviation is limited to the samples that were generated from the lowest amounts of input RNA (Table 1) and exhibit the lowest transcriptome complexity (Table 2), we suspected that it could be an artifact of RNA amplification. At extremely low RNA concentrations, amplification has been found to be less efficient than at moderate to high concentrations (3). Such a bias could conceivably lead to the patterns observed in Fig. 3B: highly Table 2. Alignment information
Sample Juvenile 1 Juvenile 2 Juvenile 3 Adult 1 Adult 2 Adult 3
Reads aligned to genome, % 77.0 72.0 66.6 79.2 69.5 71.5
Of these, aligned to coding regions, % 14.4 16.4 13.8 17.7 14.7 15.5
. . . aligned to UTRs, % 1.7 2.7 1.9 1.8 2.5 2.1
. . . aligned to introns, % 18.4 20.7 19.5 20.1 20.8 19.7
. . . aligned to intergenic regions, % 65.4 60.1 64.8 60.4 62.0 62.7
Read pairs counted, % 11.6 12.6 9.8 14.5 11.4 11.6
3=/5=coverage bias,⫻ 3.77 4.89 3.92 3.31 6.63 4.00
Median GC content % (IQR%) 45 (11) 46 (14) 46 (13) 45 (11) 43 (12) 45 (13)
Detected genes 14364 12421 11855 16812 15618 16176
Genes in which 99% of fragments align 8876 7596 7146 10144 9157 9657
UTR, untranslated regions; IQR, interquartile range.
0.5 1.0 1.5
0 25 50 75 100
relative position
relativ
e co
v
e
rage
0.0 0.1 0.2 0.3 0.4
0 1 2 3 4 5
log10 counts
density
juvenile 1 juvenile 2 juvenile 3 adult 1 adult 2 adult 3
5' 3'
B
A
abundant transcripts are unaffected, but moderately to lowly expressed genes are depleted.
To test this hypothesis, we generated simulated data based on the adult medaka samples (seeMATERIALS AND METHODS). We
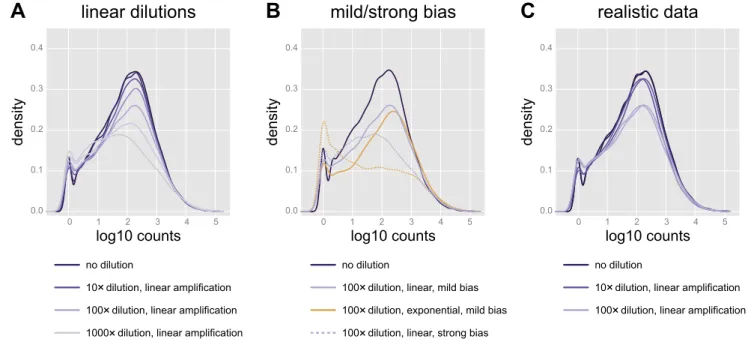
used both in silico linear amplification (Fig. 4,A andB) and exponential amplification (Fig. 4B) to mimic the bias observed in the real samples (Fig. 3B). A number of artificial concen-trations of the synthetic data were generated by serial dilutions, and the two methods produced very different distribution patterns of the simulated count values at different levels of severity (Fig. 4B). Both the “mild linear” and “mild exponen-tial” protocols produced count value distributions similar to those observed for the affected juvenile medaka samples. For further analysis, we used a combination of mild linear simu-lated samples (Fig. 4C) that includes random variation in sequencing depth and to a large degree resembles the pattern we observed in the real samples (Fig. 3B).
Normalization and bias correction in synthetic data. We subsequently investigated whether postsequencing computa-tional procedures, specifically, normalization procedures in-tended to make samples comparable, are still valid in the presence of amplification bias. The most straightforward nor-malization procedure scales all fragment counts by the exact determined sequencing depth. In addition, we evaluated several estimators by which to scale the counts. These approximations of the effective sequencing depth are less affected by the high expression of just a few genes than the actual quantified total number of fragments (5, 25). Subsequently, fragment counts are often divided by gene length, such that final quantifications reflect transcript numbers rather than transcript weight (nucle-otide numbers). In addition to dividing by sequencing depth and transcript length, we also evaluated quantile normalization,
which forces the count distributions for each sample towards a common averaged distribution (4, 8).
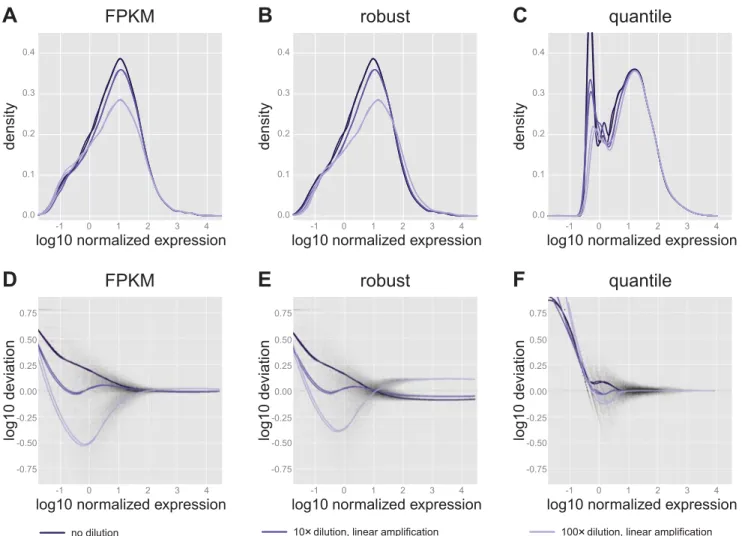
The effects of the different normalization procedures on the simulated data of Fig. 4C are shown in Fig. 5, A–F. In the distribution plots in Fig. 5Araw counts have been divided by the empirically determined number of aligning fragments per sample (in millions), as well as by the transcript length (in kilobases), yielding FPKM normalized values. At high expres-sion levels, this results in better alignment of the distributions than in the realistic simulated data (Fig. 4C). Using a robust estimator of the sequencing depth (in this case, the DESeq library size estimate), similarly shaped distributions overlap slightly worse than with FPKM, especially at the highest dilutions (Fig. 5B). Finally, quantile normalization dramati-cally alters the distributions to yield almost perfect alignment at high expression values, but poor alignment at low expression (Fig. 5C).
Figure 5, D–F, offers an alternative view of the effects of normalization on the simulated data, showing that some bias still remains in the data after normalization. The magnitude of this bias can be quantified by taking the mean absolute devi-ation for all samples and genes (seeMATERIALS AND METHODS).
Since the simulated data are intended to reflect perfect techni-cal replicates, the theoretitechni-cal lower limit and desired result of this measure is 0 (corresponding to horizontal straight lines at deviation 0 in Fig. 5,D–F). If all detected transcripts are taken into consideration, the mean overall deviation is 0.21, 0.19, or 0.10 for FPKM, robust, and quantile normalization, respec-tively. If only the top 1,000 genes by expression are consid-ered, the overall deviations are 0.02, 0.19, and 0.03, respec-tively, reflecting the good alignment of FPKM and quantile trend curves with the deviation⫽0 line at high expression and
Fig. 4. Replication of distribution bias using synthetic data.A: in silico linear amplification and sequencing of samples diluted up to 1,000⫻recapitulates the count distribution pattern observed for the real data (Fig. 3B). These samples were processed assuming a mild bias (Km⫽1).B: exponential amplification with
a mild bias, as well as linear amplification with a stronger bias (Km⫽10) produced similarly shaped distributions. Exponential amplification assuming a strong
bias (Km⫽10) produces a very different distribution pattern (yellow dotted line).C: realistic counts, based on linear amplification with a mild bias, for 6 samples:
the poor alignment for robust normalization (right sides of Fig. 5,D–F).
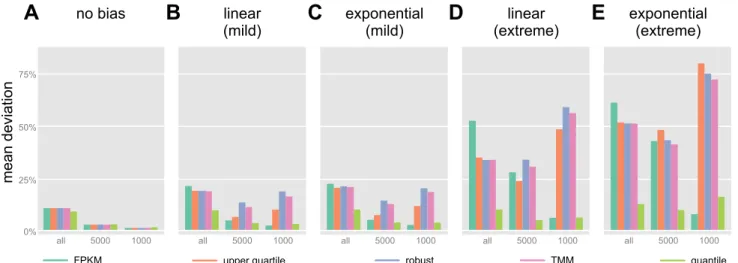
We quantified the effects of normalization for several addi-tional combinations of samples (Fig. 6), ranging from no amplification bias at all to a scenario involving extreme expo-nential amplification bias (see Fig. 4B). If no bias is present, only the effects of sequencing depth need to be mitigated by normalization, and the residual deviation is very low for every procedure (it is not zero because of the Poisson sampling noise added to each sample). If moderate to severe bias is present, the five methods evaluated produce very different results, with FPKM generally very poor at low expression levels (all genes) but surprisingly best if only the highest expressed genes are considered. In contrast, robust estimators (DESeq-like, TMM, and UQ) perform poorly especially for the most abundant transcripts. Quantile normalization results in the least overall residual bias, and only slightly more bias than FPKM at high expression levels.
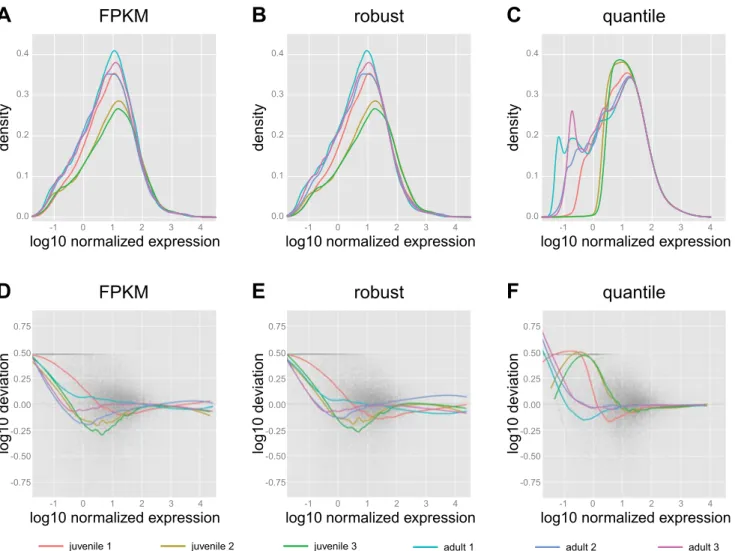
Normalization and bias correction on real data. Figure 7 illustrates the effects of the different normalization procedures on the real samples. The distribution plots of Fig. 7A
demon-strates better alignment of FPKM normalized samples at high expression levels than we observed in the raw data (Fig. 3B), similar to the situation observed for the simulated data (Fig. 5A). Using a robust estimator of the sequencing depth results in similarly shaped distributions (Fig. 7B). However, the align-ment of juvenile samples 2 and 3with the other samples is poor. As well as for the synthetic data, quantile normalization dramatically alters the distributions to yield perfect alignment at high expression values for the real samples, but no alignment at low expression (Fig. 7C). Two additional normalization procedures, scaling by the TMM and UQ estimates of library size, yielded results very similar to robust normalization (data not shown). Figure 7,D–F, provides an alternative view of the effects of normalization and resembles the bias pattern ob-served for the simulated data (Fig. 5, D–F). We obtained essentially the same results when using the alternative (RSEM) fragment counts as input for normalization (not shown).
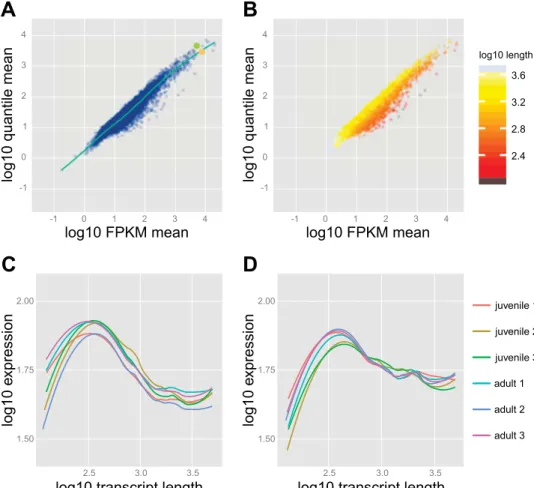
sion values than with FPKM normalization, while this effect is reversed for shorter genes (Fig. 8B). This is the result of the entire conditional quantile normalization procedure (8), which has been designed to remove length bias (as well as GC% bias) from the count data by fitting smoothing functions to the observed relationship between count numbers and quantifiable biases. The resulting corrected count values are then subjected to quantile normalization.
Differential gene expression.To determine which transcripts are significantly more or less abundant in either of the two stages (juvenile or adult), we subjected normalized counts of expressed genes to two methods for assessing differential expression. We evaluated the methods edgeR (a parametric method, which assumes a negative binomial distribution of variance for each gene) and NOISeqBIO (a nonparametric method, relying on an empirical model of the variance). We tested 8,501 genes above an expression threshold for differen-tial expression (these genes are responsible for ⬃99% of quantified fragments, see Table 2).
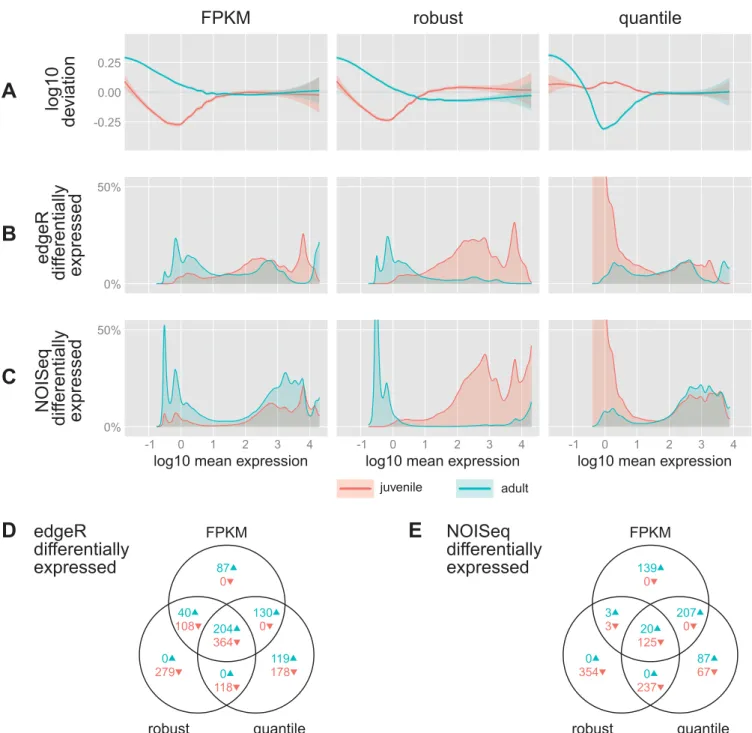
Figure 9 presents the results of the tests using the data from the three normalization procedures described above (FPKM, robust, and quantile). In Fig. 9A, the biases remaining or introduced after normalization are summarized for each ex-pression level and each stage (cf. Fig. 7,D–F). Figure 9,Band C, shows the fraction of genes called differentially expressed (P ⬍0.05) by edgeR and NOISeqBIO, respectively. In total, for FPKM, robust, and quantile normalized data, respectively, edgeR found 933, 1,113, and 1,113 genes differentially ex-pressed (with a 10% Benjamini-Hochberg false discovery rate: 154, 304, and 328 genes), where NOISeqBIO found 497, 742, and 743 genes differentially expressed. [No further multiple testing correction was applied to the NOISeqBIO data, as it is not clear whether this is possible or necessary (7, 33).]
Figure 9,DandE, shows how the numbers of differentially expressed genes differ and overlap between the different meth-ods. The methods mostly find the same genes, with the excep-tion that robust normalizaexcep-tion finds far fewer genes that are higher in adults than in juveniles. When FPKM or quantile
normalization is used, structural biases at low expression levels translate directly to high amounts of apparent differential expression. When robust scaling normalization (as well as using TMM or UQ scaling normalization, data not shown) is used, biases are also present at medium to high expression levels. This results in a high percentage of genes categorized as significantly higher expressed in juveniles than in adults, with very few genes higher in adults.
DISCUSSION
In the current study, we have utilized a transgenic line of medaka where expression of Gfp is under control of the lhb promoter (9) to isolate pure and healthy populations of lhb-expressing gonadotropes for RNA-Seq. In all samples, the expression levels forgfpandlhbrank firmly among the most highly expressed genes, indicating that cell selection was invariably successful (shown in Fig. 8A). The very high gfp expression is consistent with the excessive levels of fluores-cence observed for selected cells (Fig. 2C). In turn,lhb also exhibits similarly high expression levels and demonstrates that this cell population does indeed allocate considerable resources to hormone production.
The samples studied here are atypical input for an RNA-Seq analysis. Both the low amounts of RNA and the nature of endocrine tissue (certain hormone encoding transcripts are assumed to be overrepresented) may result in unexpected biases in the data, which, if not noticed, may have substantial effects on the subsequent biological interpretation. We there-fore analyzed the resulting data in detail and attempted to correct any technical artifacts and biological biases with care-ful application of bioinformatics normalization procedures. These are intended to make expression values comparable both between samples and between genes (within samples).
Due to the small amounts of RNA isolated from the lhb-expressing gonadotropes, a sensitive RNA amplification method for RNA-Seq from small amounts of total RNA was utilized to obtain sufficient material for sequencing. This enrichment and Fig. 6. Quantification of the residual deviation after normalization. Shown are data from scenarios with 6 nonamplified samples (A); 2 undiluted, 2 10⫻diluted and 2 100⫻diluted, amplified with a mild linear bias (similar to Figs. 4Cand 5,A–F) (B); the same but with mild exponential amplification (C); 3 undiluted and 3 100⫻diluted, amplified with strong linear bias (see Fig. 4B) (D); and the same but with strongly biased exponential amplification (E). All data shown are the means of 10 independent simulation runs, each with independent random sampling noise and sequencing depth (between 0.8 and 1.2⫻107). For each
amplification method, the Ovation RNA-Seq amplification sys-tem, has been shown to perform equally well or even better than other amplification systems (1). Although the Ovation system provides high reproducibility and generates relatively few ribosomal RNA reads (1, 19, 35, 37), it does still yield substantially larger fractions of reads of nongenic origin [⬃60% of total aligned reads, (19, 35) and Table 2]. This is presumably caused by the Ovation RNA-Seq protocol that does not select for polyadenylated RNA, and consequently the majority of the reads originate from other sources than mRNA. However, the “intergenic” fraction of the transcriptome may also be exaggerated by expression from nonannotated parts of the genome. For instance, 7.0 –16.1% of all aligned reads map to a single scaffold (scaffold2480), predominantly next to annotated mitochondrial genes. The effect of “extragenic” read alignment is compensated for by the vast amounts of reads produced by Illumina sequencing (Table 1).
Observations of reduced quality encountered in the first 10 nucleotides of the reads are also likely to have been introduced by the Ovation RNA-Seq amplification procedure and were removed from further analysis. Similar observations have also been reported by others that described the presence of Ovation RNA-Seq SPIA primer in the beginning of the reads (19).
higher expression levels for longer transcripts (Fig. 8, B–D), although a structural bias toward lower expression remains (Fig. 8D). More importantly, however, the magnitude of the bias appears to be equalized between samples. Depending on downstream normalization procedures, in noncorrected data, the outlier sample (adult 2) receives consistently deviating expression values (Fig. 7). The cqn procedure always includes quantile normalization (8), and therefore the correction was not applied in combination with scaling normalization.
A possible concern when sequencing from very small amounts of RNA is the uniqueness of the resulting amplified fragments. If the original RNA pool contained a small number of molecules relative to the number that have eventually been sequenced, this will distort expression values. Final library complexity may be further impaired by preferential amplifica-tion of highly abundant species. As a result, at low input complexity, rare transcripts (from genes with low expression) may be missing from the amplified library altogether. As a measure of this complexity, we have counted the number of genes that was detected in every sample (Table 2). Especially juvenile samples 2 and 3 appear to be less complex than the adult samples. This is likely caused by the extremely low amounts of input RNA in these two samples, which also show an aberrant distribution of fragment counts (Fig. 3B).
To exclude that these patterns are the result of the particular bioinformatics procedures used up to this point, we performed the alignment and quantification in duplicate, using two inde-pendent methods: alignment to a genomic reference using Tophat followed by counting using HTSeq, as well as
strating that all juvenile samples are indeed bona fide biolog-ical replicates and do not reflect fundamentally different tran-scriptomic states.
Interestingly, the scaling normalization procedures that make the explicit assumption that samples are comparable (robust DESeq-like, Fig. 7, B and E) result in the strongest residual biases. TMM and UQ scaling estimates yielded results
find that quantile normalization often performs much better than any other procedure, with the exception of FPKM for high expression levels (Fig. 6). The resulting expression values after each procedure are analogous to FPKM, where an FPKM of 1–3 has been shown to very approximately correspond to one transcript per cell for specific cell types (22).
The good performance of quantile normalization on simu-lated biased data can be explained by the nature of the ampli-fication bias. If the bias is assumed to be the result of lower amplification efficiencies for rare transcript species (3), the net effect will be lower count values for these species, but no change in expression rank. Quantile normalization, in turn, acts on these ranks and assumes that the same rank belongs to the same expression level for every sample. In the case of ampli-fication bias, the net result is similar to scaling by a different factor for every expression level, instead of by a single factor for all transcripts.
Finally, we evaluated two fundamentally different methods of determining whether genes are differentially expressed between conditions (Fig. 9). We only tested the 8,501 genes with expres-sion levels above a threshold (seeMATERIALS AND METHODS), which
approximately translates to the set of genes in which 99% of fragments align (Table 2). This threshold is still too liberal, as differential gene expression is strongly influenced by structural biases that emerge below expression levels of⬃5–10 (Fig. 9). Below these levels, therefore, quantified gene expression should be interpreted with caution, and qualitative rather than quantitative (e.g., “detected” instead of “higher than”). At higher expression levels, both differential expression methods find modest amounts of differential expression. edgeR appears less affected by the expression level, whereas NOISeq clearly detect more differential expression at high expression levels (Fig. 9C). The juvenile/adult symmetry in differential expres-sion is more even with NOISeq, as edgeR has a strong preference for either stage at different expression levels (Fig. 9, B–E). Due to very limited sample availability it was not yet possible for us to verify any differentially expressed genes by qPCR. Care should therefore be taken when interpreting bio-logical significance of the differentially expressed genes be-tween the different methods.
In summary, this study reveals that the biases associated with low amounts of input RNA can have a strong and detrimental effect on downstream analyses. A very common RNA-Seq pipeline includes robust normalization and edgeR differential expression analysis, a combination that on our data yields improbable results (Fig. 9B, middle panel). However, using both synthetic and real data we demonstrate that quantile normalization, a procedure standard for microarrays but not common for RNA-Seq, is an effective remedy that compen-sates for the effects of large differences in sequencing library complexity. Following normalization, we found that differen-tial expression testing was most optimal with NOISeq. The strategy outlined here to examine specific cells by RNA-Seq from low input yields highly reproducible results, which is essential for their use in differential expression studies. These technical optimizations provide a solid basis for further de-tailed study focusing on the regulatory processes in these cells. Furthermore, this specific computational pipeline will be ben-eficial for other researchers working with low input material for RNA-Seq.
ACKNOWLEDGMENTS
We are grateful to Hans Christian Dalsbotten Aass for assisting with FACS expertise and to Dr. Robert Lyle for discussions.
GRANTS
This study was supported by the Research Council of Norway, Grants 184851 (to F.-A. Weltzien) and 191825 (to T. M. Haug) and by the Norwegian University of Life Sciences.
DISCLOSURES
No conflicts of interest, financial or otherwise, are declared by the author(s).
AUTHOR CONTRIBUTIONS
Author contributions: E.A.-W., C.V.H., T.M.H., and F.-A.W. conception and design of research; E.A.-W. and C.V.H. performed experiments; E.A.-W. and C.V.H. analyzed data; E.A.-W. and C.V.H. interpreted results of experi-ments; E.A.-W. and C.V.H. prepared figures; E.A.-W. drafted manuscript; W., C.V.H., T.M.H., and F.-A.W. edited and revised manuscript; E.A.-W., C.V.H., T.M.H., and F.-A.W. approved final version of manuscript.
REFERENCES
1. Adiconis X, Borges-Rivera D, Satija R, DeLuca DS, Busby MA, Berlin AM, Sivachenko A, Thompson DA, Wysoker A, Fennell T, Gnirke A, Pochet N, Regev A, Levin JZ.Comparative analysis of RNA sequencing methods for degraded or low-input samples.Nat Methods10: 623–629, 2013.
2. Ager-Wick E, Dirks RP, Burgerhout E, Nourizadeh-Lillabadi R, de Wijze DL, Spaink HP, van den Thillart GEEJM, Tsukamoto K, Dufour S, Weltzien FA, Henkel C.V.The pituitary gland of the European eel reveals massive expression of genes involved in the melanocotin system.PLoS One 8:e77396, 2013.
3. Bhargava V, Head SR, Ordoukhanian P, Mercola M, Subramaniam S.Technical variations in low-input RNA-Seq methodologies.Sci Rep4: 3678, 2014.
4. Bolstad BM, Irizarry RA, Astrand M, Speed TP. A comparison of normalization methods for high density oligonucleotide array data based on variance and bias.Bioinformatics19: 185–193, 2003.
5. Bullard JH, Purdom E, Hansen KD, Dudoit S.Evaluation of statistical methods for normalization and differential expression in mRNA-Seq experiments.BMC Bioinformatics11: 94, 2010.
6. Cloonan N, Forrest AR, Kolle G, Gardiner BB, Faulkner GJ, Brown MK, Taylor DF, Steptoe AL, Wani S, Bethel G, Robertson AJ, Perkins AC, Bruce SJ, Lee CC, Ranade SS, Peckham HE, Manning JM, McKernan KJ, Grimmond SM.Stem cell transcriptome profiling via massive-scale mRNA sequencing.Nat Methods5: 613–619, 2008. 7. Efron B, Tibshirani R, Storey JD, Tusher V.Empirical Bayes analysis
of microarray experiment.J Am Stat Assoc96: 1151–1160, 2001. 8. Hansen KD, Irizarry RA, Wu Z. Removing technical variability in
RNA-Seq data using conditional quantile normalization.Biostatistics13: 204 –216, 2012.
9. Hildahl J, Sandvik GK, Lifjeld R, Hodne K, Nagahama Y, Haug TM, Okubo K, Weltzien FA.Developmental tracing of luteinizing hormone beta-subunit gene expression using green fluorescent protein transgenic medaka (Oryzias latipes) reveals a putative novel developmental function. Dev Dyn241: 1665–1677, 2012.
10. Hodne K, von Krogh K, Weltzien FA, Sand O, Haug TM.Optimized conditions for primary culture of pituitary cells from the Atlantic cod (Gadus morhua). The importance of osmolality, pCO2, and pH.Gen Comp
Endocrinol178: 206 –215, 2012.
11. Kanda S, Okubo K, Oka Y.Differential regulation of the luteinizing hormone genes in teleosts and tetrapods due to their distinct genomic environments - Insights into gonadotropin beta subunit evolution.Gen Comp Endocrinol173: 253–258, 2011.
13. Kim D, Pertea G, Trapnell C, Pimentel H, Kelley R, Salzberg SL.
TopHat2: accurate alignment of transcriptomes in the presence of inser-tions, deletions and gene fusions.Genome Biol14: R36, 2013. 14. Kinoshita M, Murata K, Naruse K, Tanaka M. Medaka: Biology,
Management, and Experimental Protocols. Wiley-Blackwell, 2009. 15. Kurn N, Chen PC, Heath JD, Kopf-Sill A, Stephens KM, Wang SL.
Novel isothermal, linear nucleic acid amplification systems for highly multiplexed applications.Clin Chem51: 1973–1981, 2005.
16. Li B, Dewey CN.RSEM: accurate transcript quantification from RNA-Seq data with or without a reference genome.BMC Bioinformatics12: 323, 2011.
17. Li B, Ruotti V, Stewart RM, Thomson JA, Dewey CN.RNA-Seq gene expression estimation with read mapping uncertainty.Bioinformatics26: 493–500, 2010.
18. Li H, Handsaker B, Wysoker A, Fennell T, Ruan J, Homer N, Marth G, Abecasis G, Durbin R.The Sequence Alignment/Map format and SAMtools.Bioinformatics25: 2078 –2079, 2009.
19. Malboeuf CM, Yang X, Charlebois P, Qu J, Berlin AM, Casali M, Pesko KN, Boutwell CL, DeVincenzo JP, Ebel GD, Allen TM, Zody MC, Henn MR, Levin JZ.Complete viral RNA genome sequencing of ultra-low copy samples by sequence-independent amplification. Nucleic Acids Res41: e13, 2013.
20. Marioni JC, Mason CE, Mane SM, Stephens M, Gilad Y.RNA-Seq: an assessment of technical reproducibility and comparison with gene expres-sion arrays.Genome Res18: 1509 –1517, 2008.
21. Matsuda M, Nagahama Y, Shinomiya A, Sato T, Matsuda C, Ko-bayashi T, Morrey CE, Shibata N, Asakawa S, Shimizu N, Hori H, Hamaguchi S, Sakaizumi M. DMY is a Y-specific DM-domain gene required for male development in the medaka fish.Nature417: 559 –563, 2002.
22. Mortazavi A, Williams BA, Mccue K, Schaeffer L, Wold B.Mapping and quantifying mammalian transcriptomes by RNA-Seq.Nat Methods5: 621–628, 2008.
23. Nagalakshmi U, Wang Z, Waern K, Shou C, Raha D, Gerstein M, Snyder M.The transcriptional landscape of the yeast genome defined by RNA sequencing.Science320: 1344 –1349, 2008.
24. Nanda I, Kondo M, Hornung U, Asakawa S, Winkler C, Shimizu A, Shan ZH, Haaf T, Shimizu N, Shima A, Schmid M, Schartl M. A duplicated copy of DMRT1 in the sex-determining region of the Y chromosome of the medaka,Oryzias latipes.Proc Natl Acad Sci USA99: 11778 –11783, 2002.
25. Oshlack A, Robinson MD, Young MD.From RNA-Seq reads to differ-ential expression results.Genome Biol11: 220, 2010.
26. Pan XH, Durrett RE, Zhu HY, Tanaka Y, Li YM, Zi XY, Marjani SL, Euskirchen G, Ma C, LaMotte RH, Park IH, Snyder MP, Mason CE, Weissman SM.Two methods for full-length RNA sequencing for low quantities of cells and single cells.Proc Natl Acad Sci USA110: 594 –599, 2013.
27. Robinson JT, Thorvaldsdottir H, Winckler W, Guttman M, Lander ES, Getz G, Mesirov JP.Integrative genomics viewer.Nat Biotechnol29: 24 –26, 2011.
28. Robinson MD, McCarthy DJ, Smyth GK. edgeR: a Bioconductor package for differential expression analysis of digital gene expression data.Bioinformatics26: 139 –140, 2010.
29. Roche Diagnostics GmbH. Transcriptome profiling of low-input RNA samples. http://454.com/downloads/NuGENTranscriptomeAppNote_Finalv3. pdf (02.05.2014).
30. Sengupta S, Ruotti V, Bolin J, Elwell A, Hernandez A, Thomson JA, Stewart R.Highly consistent, fully representative mRNA-Seq libraries from ten nanograms of total RNA.Biotechniques49: 898 –904, 2010. 31. Soneson C, Delorenzi M. A comparison of methods for differential
expression analysis of RNA-Seq data.BMC Bioinformatics14: 91, 2013. 32. Strandabø RAU, Hodne K, Ager-Wick E, Sand O, Weltzien FA Haug TM. Signal transduction involved in GnRH2-stimulation of identified LH-producing gonadotropes from lhb-GFP transgenic medaka (Oryzias latipes).Mol Cell Endocrinol372: 128 –139, 2013.
33. Tarazona S, Furio P, Ferrer A, Conesa A.NOISeq: an RNA-Seq package for differential expression in RNA-Seq using biological replicates. Institute of Computational Genomics, Príncipe Felipe Research Center, Spain. http:// bioinfo.cipf.es/noiseq/lib/exe/fetch.php?media⫽noiseqbio_techreport.pdf (02.05.2014).
34. Tarazona S, Garcia-Alcalde F, Dopazo J, Ferrer A, Conesa A. Differ-ential expression in RNA-Seq: a matter of depth. Genome Res 21: 2213–2223, 2011.
35. Tariq MA, Kim HJ, Jejelowo O, Pourmand N.Whole-transcriptome RNAseq analysis from minute amount of total RNA.Nucleic Acids Res 39: e120, 2011.
36. Trapnell C, Pachter L, Salzberg SL.TopHat: discovering splice junc-tions with RNA-Seq.Bioinformatics25: 1105–1111, 2009.
37. Vallandingham J, Fleharty B, Peak A, Staehling K, Perera A, Li H.
Evaluation of whole transcriptome amplification methods by RNA-Seq.J Biomol Tech24,Suppl: S57–S58, 2013.