Procedia - Social and Behavioral Sciences 53 ( 2012 ) 933 – 942
1877-0428 © 2012 The Authors. Published by Elsevier Ltd. Selection and/or peer-review under responsibility of SIIV2012 Scientifi c Committee doi: 10.1016/j.sbspro.2012.09.942
SIIV - 5th International Congress - Sustainability of Road Infrastructures
Evaluation of the applicability of IHSDM Crash Prediction Module
on Italian two-lane rural roads
Marchionna Aurelio
a, Perco Paolo
a, Falconetti Nicola
a*
aUniversity of Trieste, p.le Europa 1, Trieste 34127, Italy
Abstract
Reducing accidents on highways has always been one of the most important tasks for highway engineers. Estimating the number of accidents that may result from a given highway design is important in evaluating different alternatives. For this purpose the FHWA developed the Interactive Highway Safety Designs Model (IHSDM), a suite of software for analyzing two-lane rural highways in the United States. A key component of IHSDM is the Crash Prediction Module (CPM), which estimates the number of accidents on road segments. CPM was applied to two actual Italian two-lane rural roads to evaluate its capability to produce reasonably reliable crash predictions in the Italian context. The results of the case study showed considerable differences between the crash predicted and the crash data, underlining the difficulty of transferring this tool to the Italian context.
© 2012 The Authors. Published by Elsevier Ltd.
Selection and/or peer-review under responsibility of SIIV2012 Scientific Committee
Keywords: transferability; accident prediction model; IHSDM
1.Introduction
Rural road safety accounts for a considerable share of the total road safety problem. In 2008 [1] statistics show that deaths on rural roads in Europe account for 51% of all road fatalities. In Italy in the same year 2,656 fatalities over 4,733 occurred outside urban areas (about 56%); between these, just 453 fatalities (17%) happened on motorways, while the other 83% (equal to 46.5% of the total fatalities) happened on non-motorways. On a European level this percentage raise to as much as 90% (51.8% of the total fatalities). Moreover it, is interesting to note that, in the same year, only the 28% of the fatalities on rural roads happened at junctions, while 72% (85% on a European level) happened on road segments. These data clearly show that reducing accidents on rural road segments is currently one of foremost tasks for highway engineers. In particular, estimating the number of
* Corresponding author. Tel.: +39-040-5583591; fax: +39-040-5583580. E-mail address: [email protected]
© 2012 The Authors. Published by Elsevier Ltd. Selection and/or peer-review under responsibility of SIIV2012 Scientific CommitteeOpen access under CC BY-NC-ND license.
accidents that may result from a given highway design is a matter of great importance to evaluate different design alternatives. Therefore, it is important for highway engineers to understand the relationship between accidents and the characteristics of the road (traffic, geometry and road environment) in order to intervene effectively in reducing accidents. Accident prediction models (APMs) are useful tools for this task because they relate the annual accident experience of a road segment to its characteristics. They can be used for the safety analysis of new and existing roads, giving highway engineers a valuable insight into the variables that account for accident occurrence. In the case of the project of a new road these models are able to evaluate the expected level of safety, and the same goes for existing roads for which a crash history is not available. Moreover, in the case of existing roads with available crash history, these models are useful to "correct" the crash history on the basis of a reference sample provided by the model, using the Empirical Bayes technique [2]. For those reasons several APMs for two-lane rural roads have been developed and are currently used in many countries. The most widely used model currently available is the Crash Prediction Module (CPM) of the Interactive Highway Safety Design Model (IHSDM), developed by the Federal Highway Administration. Obviously, the availability of these models could lead to the possibility of applying them to Italian roads, and the CPM, in particular, could also be used in Italy.
2.Previous studies
Since IHSDM is a useful decision-support tool, several researchers have tried it out to check up on its applicability.
Bansen and Passetti [3] used IHSDM to evaluate alternatives and improve an intercity road with a significant accident rate. The conclusions of this study show that the software is a reliable support provided the initial data has the details and format required by the software. Chuo and Saito [4] evaluated the capacity of the IHSDM software to help road safety experts find road segments with a high accident rate, and its capacity to help draw up different interventions and improvements. Three two-lane rural highway sections in Utah were selected for a sample application of CPM to safety audits. The results of this evaluation show that the CPM can produce reasonably reliable crash predictions if appropriate input data, especially alignment data, reflect existing conditions with reasonable accuracy. In other words the content of input data can greatly affect the quality of the prediction outputs). Moreover, the study highlighted some context-related issues. They concluded that CPM could be useful for engineering decision-making during safety audits of two-lane rural highways, to estimate crash occurrences for alternative improvements to existing sections. However, they stated that interpreting the outputs requires knowledge and experience in highway design.
Dominguez et al [5] presented an adaptation of the IHSDM to the Spanish conditions. The CPM basic algorithm was calibrated using Spanish highway and crash data, than the software was applied in the safety review of three highway sections in Spain. The results indicate that the application of this software could be useful in the verification of the geometric design of existing highways as well as in highway rehabilitation projects. They concluded that the calibration significantly improved the module’s predictions. However, the use of IHSDM and the interpretation of its results demands caution and expertise.
3.Transferability
The transferability of the model to geographic areas different from those in which data were collected with a view to developing them requires special attention. In fact, accident frequencies vary across time and space, even between roads that are similar, because of differences in factors such as accident reporting thresholds, accident reporting practices, driver population, law enforcement, animal populations, vehicle characteristics, and climate. Consequently, the application of these models to a geographic area different from those in which they were
developed presents significant problems of transferability and could result in unreliable accident estimations. This problem is well known and has been the object of several studies [6, 7].
In Italy, Cafiso et al. [8] presented an application of the IHSDM to part of the rural road network in Sicily. The paper describes the modalities used to collect data for the model implementation, then evaluates the effectiveness and usefulness of the model.
Moreover, in a research carried out by Martinelli et al. [9] the Highway Safety Manual prototype chapter calibration procedure, that was recently implemented in the new release of IHSDM, has been applied to the two-lane highways road network in the Italian Province of Arezzo. To carry out this kind of procedure, Martinelli used an accident dataset in which every crash record was characterized by a road code and the progressive distance. The control procedure applied by the Province of Arezzo ensured accident data reliability in terms of localization, characterized by a tolerance of about 5-10 meters. It must be noted that this kind of data in Italy, at present, are almost totally unavailable. The results of the study in terms of transferability of the HSM model pointed out several critical aspects, particularly in terms of segmentation and data attribution. The research concluded that to obtain a reliable prediction the model should be calibrated, but a constant value of the calibration coefficient is not a suitable option for a valid model transferability.
Sacchi et al. [10] assessed the transferability of the HSM [11] algorithm as a whole, as well as its components – the baseline SPFs ad CMFs. The comparison was based on the official crash database provided by ISTAT, which contains only those crashes involving at least personal injury. For this reason, only fatal plus injury-related crashes (F+I) were considered within the HSM output to provide a consistent comparison. The study considered a sample of two-lane rural roads involving several sites characterized by high AADT. On the whole, the study highlighted a strong over-prediction of the HSM model, evidencing a low prediction accuracy for higher AADTs. In particular, the authors found that the relative difference between HSM predictions and observed crash data increases with increasing exposure.
4.Case study
In this paper the CPM (IHSDM release 5.0.2) was applied to two real Italian two-lane rural roads to evaluate its capability to fit the observed crash history in a typical Italian context. However, the aim of this work is not to estimate the size of the calibration factor, but rather to assess the software prediction capability at microscopic level along the same road. This kind of problem, in fact, is quite common in planning practice; this case study also wants to give to practitioners some useful indications with regard to the correct interpretation of the model outputs.
The accident prediction process implemented in the CPM of the IHSDM is divided into two different models to be applied to road segments or junctions alternatively. In the present case study only the road segments algorithm was applied. The two road segments were purposely chosen because there are no significant intersections along them. The small number of accidents located at intersections were not used in making the comparison.
The crash history used in this case study covers all recorded accidents in a 5 year period (2005–2009) and is derived from The National Institute for Statistics (ISTAT) accident database. For each crash the database included location, date, time, death, injury, number and type of vehicles involved. The ISTAT database includes all crashes reported by the police officers which involved at least one dead or injured person, in agreement with the definition of road accidents established at a European level. The database does not include property-damage-only accidents. Therefore, this fact must be considered in the comparison with the CPM output, which includes also property-damage-only crashes. In particular, the CPM predicts a total crash frequency which is composed of 32% of fatal and injury-related crashes and 68% of property-damage-only crashes. These rates are fixed.
Moreover, in the ISTAT database all accidents are related to their localization using the mile stone references, therefore accidents are grouped per km and are not located on the specific geometric feature. This recording
approach introduces two restraints to the case study: the first regards the comparison between predicted and observed crashes, the second is about the applicability of the model’s calibration procedure.
Mainly, CPM results are given by highway segment (the subdivision into homogeneous segments is carried out when one of the variables required by the software changes) or at least by horizontal design element. In any case, the lengths of these elements are much shorter than one kilometer, so in this case study the CPM results will be grouped by 1 km long segments, in order to compare them with actual crash data.
The ISTAT recording approach introduces a limitation to the applicability of the model’s calibration procedure, which requires the exact location where the accident occurred. For this reason in this case study the comparison of the results checks if CPM is capable of making appropriate crash predictions without the calibration process.
4.1.CPM required data
To apply CPM, several types of data are required: Annual Average Daily Traffic (AADT), horizontal and vertical alignment, lane and shoulder width, cross slope, superelevation, driveway density (DD, number of accesses per kilometer), roadside hazard rating (usually based on the seven-point subjective scale developed by Zegeer et al [12]), speed limit, presence of an intersection. In the process of data collection this case study has already pointed out some “difficulties” in providing some of the required data on existing roads.
Since both the road segments analyzed were built many years ago, the original design plans and/or as-built plans are unavailable. Therefore, in order to meet the data requirements of CPM, the horizontal and vertical alignments were obtained from the Regional Cartographic Database: surrogate centerline alignments for each study section were created. The vertical alignment was obtained using the triangulated surface created between the two road edges. This approach allows an accurate estimation of the grades of vertical tangents, but not of the geometry of the vertical curves. By this method in fact, an approximate road surface profile is extracted from the cartography. This profile can show corrugations, due to the accuracy in the altitude of the cartographic roadsides, in several positions along the road: if a corrugation is located on a vertical tangent can be easily detected and correct, while if it is located on a vertical curve it could lead to a considerable error margin in the radius assessment.
Furthermore some in-site inspections were needed to get “environmental” data (like DD, RHR, speed limit) and to integrate the Regional Cartographic Database information, typically lane and shoulder width and superelevation of the curves. In particular, the superelevation survey was complex and expensive: in correspondence to each curve of the alignment, several measurements of cross slope, at least three for each lane, were carried out. In fact, since the road was never formally designed, it was found that very often the cross slope changed along the curve length, and in many cases differ, even significantly, between the two lanes of the same curve.
4.2.Roads characteristics
Two two-lane rural highways in the north-east of Italy were selected for the this case study:
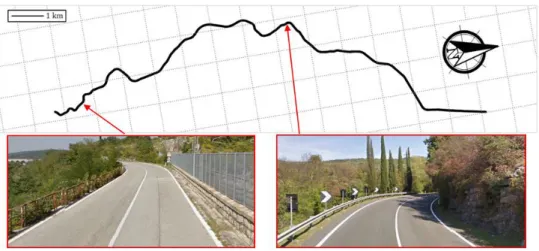
The national road S.S. n° 55, from km 1 to km 18: the S.S. n° 55 links Trieste to Gorizia, traversing rolling terrain in a woody environment along the border with Slovenia. Along the road there are only two small built-up areas and few at-grade intersections with minor roads that are characterized by very low traffic volume. The road was built after the first world war and its alignment does not respect any highway policy. The alignment is characterized by sequences of curves with very different radii and short tangents. This condition is quite common for many Italian rural roads.
Fig. 1. S.S. 55 : Surrogate centerline alignment and photos of the study section in summer 2011.
The country road S.P. n°19, from km 3 to km 19: the S.P. n° 19 links Monfalcone to Grado, traversing level terrain in a open environment, surrounded by countryside. Along the road there are no built-up areas at all and just a few at-grade intersections with minor roads that are characterized by very low traffic volume. The road was built in the 60’s. Even though the road does not respect any highway policy, the general character of the alignment is close enough to the Italian Road Policy construction rules, although there is no spiral transition along the road. The alignment is characterized by long tangents and curves with adequate radii.
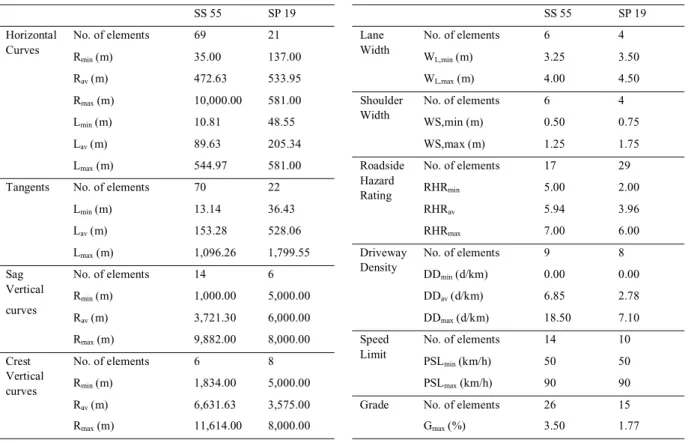
In particular, the segments were chosen since they are very different from each other, both for geometry and road environment. The overall Curvature Change Rate (CCR) is equal to 127.90 gon/km for the S.S. 55 (it ranges from 24.10 to 356.10 gon/km between the six sections of the road that can be considered homogeneous with regard to the desired speed – see [13]), while for the S.P. 19 it is equal to 29.91 gon/km (it ranges from 10.16 to 58.26 gon/km between the five homogeneous sections of the road).
4.2.1.Traffic data
The traffic data used for this study are the result of some extensive traffic survey campaigns carried out by the “Road Safety” Research Unit of the Department of Civil Engineering and Architecture of Trieste University, by the Province of Gorizia road administration and from the Regional Road Agency.
While the S.P.19 is characterized by the same AADT on the entire road (7,363 veh/day), the S.S. 55 was divided into three different sections, each one characterized by the same AADT, equal to 2,126 on the first section (from km 1 to 2+880), 5,953 on the second (from km 2+880 to 10+915) and 8,504 on the last section (from km 10+915 to 18).
4.2.2.Highway Segments for CPM Evaluation
The CPM algorithm performs a partition of the two roads based on all the above mentioned attributes to predict the number of crashes for each segment. In this case study the algorithm divided the S.S. 55 in 159 elements, the length of which varies from 10.81 m to 1,096.26 m, while the S.P. 19 was sub-divided into 90 elements, the length of which varies from 9.89 m to 778.56 m. As can be easily noted, the sub-division process may result in very short segments.
Table 1. Summary of Roads Characteristics
SS 55 SP 19 SS 55 SP 19
Horizontal Curves
No. of elements 69 21 Lane
Width No. of elements 6 4 Rmin (m) 35.00 137.00 WL,min (m) 3.25 3.50 Rav (m) 472.63 533.95 WL,max (m) 4.00 4.50 Rmax (m) 10,000.00 581.00 Shoulder Width No. of elements 6 4 Lmin (m) 10.81 48.55 WS,min (m) 0.50 0.75 Lav (m) 89.63 205.34 WS,max (m) 1.25 1.75 Lmax (m) 544.97 581.00 Roadside Hazard Rating No. of elements 17 29
Tangents No. of elements 70 22 RHRmin 5.00 2.00
Lmin (m) 13.14 36.43 RHRav 5.94 3.96 Lav (m) 153.28 528.06 RHRmax 7.00 6.00 Lmax (m) 1,096.26 1,799.55 Driveway Density No. of elements 9 8 Sag Vertical curves
No. of elements 14 6 DDmin (d/km) 0.00 0.00
Rmin (m) 1,000.00 5,000.00 DDav (d/km) 6.85 2.78 Rav (m) 3,721.30 6,000.00 DDmax (d/km) 18.50 7.10 Rmax (m) 9,882.00 8,000.00 Speed Limit No. of elements 14 10 Crest Vertical curves
No. of elements 6 8 PSLmin (km/h) 50 50
Rmin (m) 1,834.00 5,000.00 PSLmax (km/h) 90 90
Rav (m) 6,631.63 3,575.00 Grade No. of elements 26 15
Rmax (m) 11,614.00 8,000.00 Gmax (%) 3.50 1.77
4.3.Comparison between CPM evaluation and crash history
On the whole, from the evaluation carried out, the software predicts 13.90 crashes per year on the S.S. 55 and 7.00 crashes per year on the S.P. 19. In the crash history evaluation period (2005–2009), the recorded frequencies
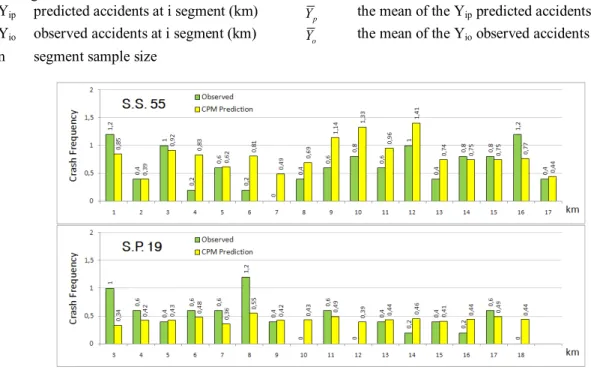
are 10.60 and 7.20 crashes per year, on the S.S. 55 and on the S.P. 19 respectively. These values show globally on the entire road a good correspondence between the model output and the real crash history, especially on the S.P. 19, that shows an estimation error just equal to -2.78% (while on the S.S. 55 this error is equal to 21.70%). However, since these are two "overall" values, relating to two long road sections (17 and 16 km), it’s appropriate to assess whether the CPM evaluation on shorter stretches of the alignment (1 km length) can be considered consistent with real crash history. Figure 3 is a graphical presentation of the crash prediction results versus the actual crash frequencies in the evaluation period (2005–2009), divided by km for the two roads under evaluation. Although this histogram show, on the whole, an acceptable correspondence between CPM results and crash history, it is immediately clear that in some cases the observed value appears much higher than predicted (e.g. km 1 and 16 of the S.S. 55 and km 3 and 8 of the S.P. 19), while in several other cases the opposite is true (typically the entire central section of the S.S. 55, from km 6 to km 13). Therefore the average values previously presented actually conceal a significant variation, which should be further investigated.
To assess model fit to crash data, several goodness-of-fit (GOF) statistics were used. It is important to note that only after an assessment of several GOF criteria has been made, can the performance of a particular model be assessed. Moreover, it should be noted that the evaluation of the GOFs is subjective, therefore the evaluation of transferability of the models in this study also remains a subjective opinion of the authors. In the discussion the following notations will be used:
Yip predicted accidents at i segment (km) Yp the mean of the Yip predicted accidents
Yio observed accidents at i segment (km) Yo the mean of the Yio observed accidents
n segment sample size
Fig. 3. Comparison between predicted and observed crash frequencies for the two roads.
A brief description of the meaning of each GOF measures used is given:
• r : Pearson’s product moment correlation coefficients between observed and predicted accident frequencies
(
)
(
)
(
)
(
)
∑
∑
∑
= = = − ⋅ − − ⋅ − = n i n i p ip o io n i p ip o io Y Y Y Y Y Y Y Y r 1 1 2 2 1 (1)ranges from +1 to -1 and represent the degree of linear relationship between two variables. A correlation of ±1 means that there is a perfect positive/negative linear relationship between predicted and observed values. A correlation of 0 means there is no linear relationship between values.
• MPB: Mean Prediction Bias
(
)
∑
= − ⋅ = n i ip io Y Y n MPB 1 1 (2)provides a measure of the magnitude and direction of the average model bias as compared to observed data. The smaller the MPB, the better the model is at predicting observed validation data. A positive MPB suggests that on average the model over-predicts the observed data, while a negative value suggests systematic under-prediction.
• MAD: Mean Absolute Deviation
∑
= − ⋅ = n i ip io Y Y n MAD 1 1 (3)is the corresponding of the MBP in absolute value. The MAD gives a measure of the average magnitude of variability of prediction. A large MAD suggests that the model is not able to predict the observed data well. This statistic is more significant than the MBP, because in the case of MBP over-predicitions and under-predictions compensate each other.
• sMAPE: Symmetric Mean Absolute Percentage Error
100 1 1 ⋅ + − ⋅ =
∑
= n i io ip ip io Y Y Y Y n sMAPE (4)is an accuracy measurement based on percentage (or relative) errors.
This GOF measure derives from of the more classic “MAPE” (Mean Absolute Percentage Error) for which the absolute difference between Yio and Yip is divided by the only observed value Yio, giving rise to a significant
drawback in practical application if there are observed values equal to zero. In this case study it should be noted that, even though the observed crash frequencies in this study are calculated as an average per year on a five years evaluation period, in four cases Yio is equal to zero. For this reason the MAPE was not considered in the
following discussion. Moreover, in contrast to the MAPE (which has no upper limit, making its interpretation difficult), the sMAPE has both a lower limit and an upper one (the formula above provides a result between 0% and 100%).
Table 2. Transferability evaluation results (one-year basis)
o
Y Yp r MPB MAD sMAPE
SS 55 0,62 0,82 0,51 -0,19 0,31 25,41%
SP 19 0,45 0,44 0,31 0,01 0,25 34,23%
Pearson’s coefficient (r) in both cases is low enough to suggest that the model is not able to predict the observed data well. Ideally, in fact, if the prediction was perfectly consistent with reality, it should be r= +1 (a match equal to 100%), while in those cases this coefficient varies a lot, especially for the S.P. 19 (a match equal to 0.31). Moreover, it should be noted that, for the reason already discussed in the index presentation, the MPB is much closer to zero than the MAD. Since the MBP statistic is more significant, it will be taken as a reference in evaluating the prediction error. For the S.S. 55 the MAD is equal to 0.31 crashes per year, on the basis of an average of observed crashes per year Yo equal to 0.62, while in the case of the S.P. 19 MAD=0.25 crashes/year
and Yo =0.45 crashes/year. This means that the mean absolute deviation of the predicted values referred to the
mean observed value amounts to 50% and 55%, respectively for the S.S. 55 and for the S.P. 19. Also the sMAPE in both cases is high enough to suggest that the model deviates from the observed data. In all, the analysis of the
statistics in Table 2 and of the graphics of the observed versus predicted accident frequencies (Figure 3), makes it possible to state that the CPM is not always able to predict accident frequency with sufficient reliability. In fact, although the overall estimate on more than 15 km of road has provided reasonable results, suitable for qualitative assessments (errors are compensated over long distances), it must be pointed out that the estimate for shorter segments may deviate substantially from a hypothetical expected accident frequency. This entails a careful evaluation on the part of the user.
4.3.1.Applicability of CPM
The case study highlighted several issues, which concern not only the absolute quantification of the expected level of safety (number of crashes assessment): in fact, the study offered a good opportunity to look into the structure of the DCM and evaluate the applicability of an algorithm so accurate to the Italian context.
The CPM algorithm, in fact, requires a logical partition of roads based on many different attributes. However, this is not always easy to achieve in practice, in the Italian context. Firstly, any such division will depend on the data available; most road administrations are not likely to have information on all of these variables: most two-lane rural highways in Italy were built more than twenty years ago, the original design and construction plans are unavailable and a topographic survey would be very expensive. Secondly, such divisions may not always make sense, as already pointed out by other researchers [14]. The case study showed that the sub-division process can sometimes produce some extremely short segments (several of them are as short as 10 m long).
Another problem with shorter segment lengths regards the first step of the model development process, that is the phase of data collection. This issue is the chance that a feature of the road in one segment triggered a crash officially located in another segment. This can be an important issue particularly in remote rural locations, where attending traffic officer may be less likely to provide a precise location. The attending officer may also be basing the location on the point where a vehicle came to rest, whereas the initial cause of the crash may have occurred further back along the road; at typical highway speeds, vehicle momentum can lead to a location discrepancy of hundreds of meters. Thus, to tackle this issue it is prudent to try to produce relatively long segment lengths where the crash and potential contributory features are more likely to be located in the same segment.
On the whole, the case study highlighted some problems related to the transferability of the CPM to the Italian context. The results showed significant differences, in quantitative terms, between the crash predicted and the historical crash data, highlighting the difficulty of transferring this tool to the Italian context.
5.Future development
For the reasons indicated by the case study, confirmed also by results of some studies previously mentioned, it may be useful to develop a specific APM based on the Italian characteristics. To reach this target the topic must be studied from a perspective more consonant with the local Italian context: the aim of future research is not just to create a model that gives a reliable accident estimation, but also to develop a suitably robust model, ensuring its applicability in practice. This model should consider the alignment by sections of road rather than specific geometric elements, since in the Italian road crash database accidents are not recorded by horizontal or vertical geometric elements, and the effort to assign to each crash record a precise location on the alignment is a nearly impossible task. Therefore, in the analysis development a length equal to 1 km must be taken as the minimum reference length. In recent years the “Road Safety” Research Unit of the Department of Civil Engineering and Architecture of the University of Trieste has carried out a massive data collection to develop a database combining geometric road features, road environment features and traffic and crash data of a large sample of road sections, distributed over the national and regional road network in the Friuli Venezia Giulia and Veneto areas. This dataset includes data concerning approximately 290 km of two-lane rural roads. The analysis, at the stage of completion, focuses on the segmentation methodology, following a possible procedure for dividing two lane roads sample into segments characterized by homogeneous highway features related to safety. This choice must
emerge from a careful assessment of the ease of finding the necessary information and an achievable precision in the measurement of those variables. Having once defined an objective road segment sectioning approach the statistical analysis will take into consideration only parameters that are easy to collect and are objectively computable to implement a specific APM.
6.Conclusions
In this paper the CPM was applied to two actual Italian two-lane rural roads to evaluate its ability to produce reasonably reliable crash predictions. The results showed substantial differences, in quantitative terms, between the crash predicted and the historical crash data, questioning the transferability of this model, to a road context different from that in which it was developed. Moreover, the study offered a good opportunity to experience the DCM and the employment complexities of an algorithm so accurate in Italy. In fact, in order to meet the data requirements of CPM, the data collection process pointed out some “difficulties” in providing some of the required data. On the whole, the case study highlighted the need to develop a specific APM based on the Italian characteristics. Future development of the research will focus on a possible procedure for dividing the two lane roads sample into segments characterized by homogeneous highway features related to safety.
References
[1] European Road Safety Observatory (2010). “Annual Statistical Report 2010” DaCoTA - Project co-financed by the European Commission, Directorate-General for Mobility & Transport.
[2] Hauer, E., Harwood, D.W., Council, F.M. and Griffith, M.S. (2002). “Estimating Safety by the Empirical Bayes Method: A Tutorial”, Transportation Research Record n. 1784, pp. 126–131.
[3] Bansen, J. and Passetti, K. (2005). “Application of the IHSDM: A case study”. Proceedings of the 3th International Symposium on Highway Geometric Design – Chicago, USA, June 2005.
[4] Chuo, K. and Saito, M. (2009). “Applicability of the Crash Prediction Module of IHSDM to the selection of Candidate Locations for Safety Audits of Two-Lane Rural Highways”. Proceedings of the 88th TRB Annual Meeting – Washington, D.C., USA, January 2009. [5] Dominguez-Lira, C., Castro, M., Pardillo-Mayora, J. and Gascon-Varon, C. (2010). “Adaptation and Calibration of IHSDM for Highway Projects Safety Evaluation in Spain”. Proceedings of the 4th International Symposium on Highway Geometric Design – Valencia, Spain,. [6] Marchionna, A., Perco, P. and Tavernar, M.C. (2008). “Transferability of Accident Prediction Models for Urban Intersections”. Proceedings of the 17th National SIIV Congress - Enna, Italy.
[7] Persaud, B., Lord, D., Palmisano, J. (2002), “Calibration and Transferability of Accident Prediction Models for Urban Intersections”, Transportation Research Record n. 1784, pp. 57–64.
[8] Cafiso, S., Di Graziano, A., La Cava, G., Taormina, S. (2006). “Analisi Predittive dell'Incidentalità su Strade Italiane Mediante l'utilizzo del Modello IHSDM”. Proceedings of the 16th National SIIV Congress - Cosenza, Italy.
[9] Martinelli, F., La Torre, F. and Vadi, P. (2009). “Calibration of the Highway Safety Manual's Accident Prediction Model for Italian Secondary Road Network”, Transportation Research Record n. 2103, pp. 1–9.
[10] Sacchi, E., Persaud, B., Bassani, M. (2012). “Assessing International Transferability of Highway Safety Manual Crash Prediction Algorithm and Its Components”. Proceedings of the 91th TRB Annual Meeting – Washington, D.C., USA, January 2012.TRB 91st Annual Meeting, Washington, US.
[11] AASHTO (2010). “Highway Safety Manual”.
[12] Zegeer, C. V., Reinfurt, D. W., Hummer, J., Herf, L. and Hunter, W. (1988). “Safety Effects of Cross-Section Design for Two-Lane Roads”. Transportation Research Record n. 1195, pp. 20-32.
[13] Marchionna, A., Perco, P. and Falconetti, N. (2010). “Application of Design Consistency Evaluation Tools for Two-Lane Rural Roads: A Case Study from Italy”. Proceedings of the 4th International Symposium on Highway Geometric Design – Valencia, Spain.
[14] Fitzpatrick, K., Schneider IV, W. and Carvell, J. (2006). "Using the Rural Two-Lane Highway Draft Prototype Chapter", Transportation Research Record n. 1950, pp. 44–54.