lication in the following source:
Kanagasundaram, A.
,
Dean, D.
,
Sridharan, S.
, Gonzalez-Dominguez, J.,
Gonzalez-Rodriguez, J., & Ramos, D.
(2014)
Improving short utterance i-vector speaker verification using utterance
vari-ance modelling and compensation techniques.
Speech Communication
,
59
, pp. 69-82.
This file was downloaded from:
http://eprints.qut.edu.au/66930/
c
Copyright 2014 Elsevier
NOTICE: this is the author’s version of a work that was accepted for publication in Speech Communication. Changes resulting from the publishing process, such as peer review, edit-ing, corrections, structural formattedit-ing, and other quality control mechanisms may not be re-flected in this document. Changes may have been made to this work since it was submitted for publication. A definitive version was subsequently published in Speech Communication, Vol 59, DOI: 10.1016/j.specom.2014.01.004
Notice
:
Changes introduced as a result of publishing processes such as
copy-editing and formatting may not be reflected in this document. For a
definitive version of this work, please refer to the published source:
Speech Communication 00 (2014) 1–18
Speech
communi-cation
www.elsevier.com/locate/procediaImproving Short Utterance I-vector Speaker Verification using
Utterance Variance Modelling and Compensation Techniques
A.Kanagasundaram?, D.Dean?, S.Sridharan?, J.Gonzalez-Dominguez†, J.Gonzalez-Rodriguez†, D.Ramos†
?Speech Research Lab, SAIVT, Queensland University of Technology, Australia.
†ATVS Biometric Recognition Group, Universidad Autonoma de Madrid, Spain.
[email protected], [email protected], [email protected], [email protected], [email protected], [email protected]
Abstract
This paper proposes techniques to improve the performance of i-vector based speaker verification systems when only short utterances are available. Short-length utterance i-vectors vary with speaker, session variations, and the phonetic content of the utterance. Well established methods such as linear discriminant analysis (LDA), source-normalized LDA (SN-LDA) and within-class covariance normalisation (WCCN) exist for compensating the session variation but we have identified the variability introduced by phonetic content due to utterance variation as an additional source of degradation when short-duration utterances are used. To compensate for utterance variations in short i-vector speaker verification systems using cosine similarity scoring (CSS), we have introduced a short utterance variance normaliza-tion (SUVN) technique and a short utterance variance (SUV) modelling approach at the i-vector feature level. A combination of SUVN with LDA and SN-LDA is proposed to compensate the session and utterance variations and is shown to provide improvement in performance over the traditional approach of using LDA and/or SN-LDA followed by WCCN. An alternative approach is also introduced using probabilistic linear discriminant analysis (PLDA) approach to directly model the SUV. The combination of SUVN, LDA and SN-LDA followed by SUV PLDA modelling provides an improvement over the baseline PLDA approach. We also show that for this combination of techniques, the utterance variation information needs to be artificially added to full-length i-vectors for PLDA modelling.
Keywords: Speaker verification, I-vector, PLDA, SN-LDA, SUVN, SUV
1. Introduction
Many remarkable advances in dealing with mismatch between enrolment and verification for speaker verification have been accomplished during the last few years, which have led to highly reliable perfor-mance when reasonable amounts of speech are available. Techniques based on factor analysis, such as joint factor analysis (JFA) [9, 23], i-vectors [3] and probabilistic linear discriminant analysis (PLDA) [10], have demonstrated outstanding behaviour in challenging evaluation scenarios, such as the Speaker Recog-nition Evaluation series developed by the National Institute of Standards and Technology (NIST) [18, 19]. Unfortunately, the performance of many of these approaches degrades rapidly as the available amount of enrolment and/or verification speech decreases [21, 7, 8], limiting the utility of speaker verification in real world applications, such as access control or forensics.
The total-variability, ori-vector, approach has risen to prominence as the de-facto standard in recent state-of-the-art speaker verification systems, due to its intrinsic capability to map an utterance to a single
dimensional i-vector, turning a complex high-dimensional speaker recognition problem into a low-dimensional classical pattern recognition one. However, we should not lose sight that i-vectors are computed as point estimates of the hidden variables in a factor analysis model, where the amount of available data plays an important role. Thus, i-vectors extracted from different durations should not be considered equal in reliability concerns. To address this issue several approaches has been taken. Zhao et al. [24] have undertaken a variational-Bayes approach in order to integrate out hidden factors of the model, avoiding the need for working on point estimates. More recently, Kennyet al. have investigated how to quantify the uncertainty associated with the i-vector extraction process and propagated it into a PLDA classifier [13]. Hasanet al.have analysed the effect of short utterance i-vectors [5], finding that duration variability can be modelled as additive noise in the i-vector space, using a PLDA classifier.
As the session variability is included within the i-vector space, a number of session variability com-pensation techniques, including linear discriminant analysis (LDA), within-class covariance normaliza-tion (WCCN), source-normalized LDA (SN-LDA) and nuisance attribute projecnormaliza-tion (NAP) are used to atten-uate the channel variability in cosine similarity scoring (CSS) i-vector speaker verification. More recently, the i-vector framework was extended with a PLDA approach to model the speaker and channel parts within the i-vector space, and this has been shown to provide an improved performance over CSS i-vector speaker verification [3, 10]. On the other hand, CSS i-vector speaker verification is more computationally efficient than PLDA speaker verification.
Previous research studies had found that a collection of typical i-vectors will contain variation due to two main sources of variation: changing speaker characteristics, and changing channel (or session) charac-teristics [3]. Recently it was also found that significant variation can also occur when utterance lengths are varied, primarily due to the changes in linguistic content [13].
The main aim of this paper is to analyze the performance and limitations of i-vector based speaker recognition when only short speech utterance available for enrolment and/or recognition. Based on this analysis we make recommendations to improve the accuracy of short utterance speaker recognition with i-vectors. Our research is based on speech acquired using both telephone handsets and single microphones available in the NIST 2008 [18] and the NIST 2010 [19] speech corpora. We first investigate the shortcoming of short-utterance i-vectors, by analysing the scatter plot of i-vector behaviour. Secondly, based on scatter plot analysis, we introduce the concept of short utterance variance (SUV), defined as the inner-product of difference between full-length and short-length i-vectors. Having captured the SUV, we then introduce two techniques to attenuate the effect of the SUV, one based on CSS verification, and the other on PLDA, designed to allow short utterances to provide a better representation of their full-length counterparts in i-vector speaker recognition.
This paper is structured as follows: Section 2 gives a brief introduction to i-vector speaker verifica-tion systems. A short review of current research on short-utterance i-vector speaker verificaverifica-tion and brief analysis of the shortcoming of short-utterance i-vectors is given in Section 3.1. Section 3.2 introduces the utterance variation covariance normalization approach, and short utterance variance modelling using a PLDA approach is detailed in Section 3.3. The experimental analysis of the proposed techniques is detailed in Section 4, and finally in Section 5 we summarize the insights gained from our research and make key recommendations for the design of short- utterance speaker recognition using i-vectors.
2. I-vector speaker verification
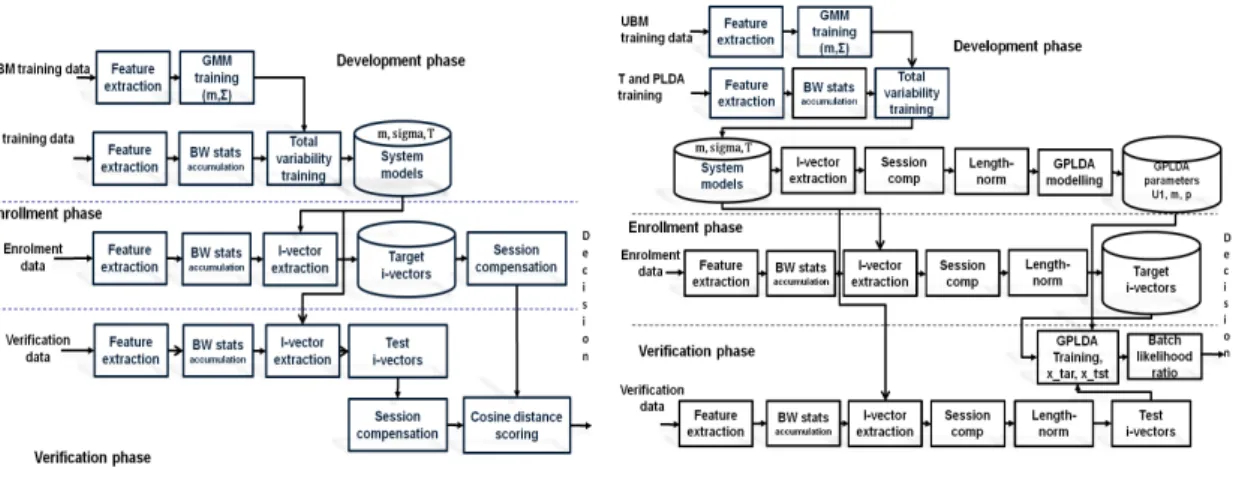
I-vectors, whether through the simpler CSS approach, or the more complex length-normalised Gaussian PLDA (GPLDA) approach are considered the state-of-the-art for speaker verification research. Such systems typically involve three phases: i-vector feature extraction, session variability compensation and scoring, and these phases are detailed in the sections below. Block diagrams of CSS i-vector and PLDA speaker verification systems are shown in Figures 1 (a) and (b) respectively.
2.1. I-vector feature extraction
In contrast to the separate speaker and session dependent subspaces of the previous state-of-the-art JFA technique, i-vectors represent the GMM super-vector using a single total-variability subspace. This
single-subspace approach was motivated by the discovery that the session variability space of JFA contains information which can be used to distinguish between speakers [2]. In an i-vector based speaker recognition system, the speaker and session dependent GMM super-vector can be represented by
µ = m+Tw, (1)
wheremis the speaker and session independent UBM super-vector,Tis a low rank matrix representing the primary directions of variation across a large collection of development data, andwis normally distributed with parametersN(0,I), and is thei-vectorrepresentation used for speaker verification.
The details of the total-variability subspace training and subsequent i-vector extraction is given by De-haket al.[1]. As we are investigating the speaker verification in both telephone and microphone conditions, the total-variability subspace should be trained in a manner which exploits the useful speaker variability ac-quired from both sources. McLarenet al.[14] have investigated different types of total-variability represen-tations, such as pooled and concatenated, with i-vector systems. For the pooled total-variability approach, the total-variability subspace is trained on telephone and microphone speech utterances together. For the concatenated total-variability approach, the separate total-variability telephone and microphone subspaces are trained using only speech from those sources, then both subspace transformations are concatenated to create a single total-variability space. Their studies have found that a pooled total-variability approach provides a better representation for i-vector speaker verification when compared to a concatenated total-variability approach, and therefore in this paper, the pooled total-total-variability approach has been chosen for our experiments for this reason.
2.2. Subspace session variability compensation
As the total-variability subspace defining i-vectors contains variations due to both changes in speakers and sessions, in order to reliably recognize speakers, it is necessary to compensate for the unwanted session variability. In this section, we will outline techniques developed to transform the total variability subspace in a discriminatory manner to maximise the separation between speakers. Alternative approaches to modelling the session variability directly through PLDA will be outlined in Section 2.3.
Subspace-transformation session variability compensation techniques are designed to reduce the mis-match between enrolment and verification data for CSS i-vector speaker verification. Subspace compen-sation approaches remain an active area of research, and typically the subspace compencompen-sation is carried out through LDA followed by WCCN (WCCN[LDA]1) [1, 15], but more advanced subspace compensation techniques such as WCCN[SN-LDA] have shown considerable promise [15, 16].
2.2.1. WCCN[LDA]
In the first stage of the WCCN[LDA] sequential approach, LDA is used as session variability compen-sation technique, which attempts to find a reduced set of axesAthat minimizes the within-class variability while maximizing the between-class variability through the eigenvalue decomposition of
Sbv=λSwv. (2)
where the between-class scatter,Sb, and within-class scatter,Sw, can be calculated as follows,
Sb = S X s=1 ns( ¯ws−w¯)( ¯ws−w¯)T, (3) Sw = S X s=1 ns X i=1 (ws i−w¯s)(wis−w¯s)T. (4)
1Throughout this paper, we will refer to subspace transformations using a functional notation B[A] meaning that the input is first
whereS is the total number of speakers,nsis number of utterances of speakers. The mean i-vectors, ¯wsfor
each speaker, and ¯w, the mean across all speakers are defined by
¯ ws = 1 ns ns X i=1 wis, (5) ¯ w = 1 N S X s=1 ns X i=1 wis. (6)
where N is the total number of sessions. WCCN is then used as an additional session variability com-pensation technique to scale the subspace in order to attenuate dimensions of high within-class variance. The WCCN transformation matrix (B) is trained using the LDA-projected i-vectors [3] from the first stage. The WCCN matrix (B) is calculated using Cholesky decomposition ofBBT =W−1, where the within-class covariance matrixWis calculated using
W = 1 S S X s=1 ns X i=1 (AT(wis−w¯s))(AT(wis−w¯s))T. (7)
The final WCCN[LDA] session variability compensated i-vector can be calculated as follows, ˆ
wWCCN[LDA] =BTATw (8)
2.2.2. WCCN[SN-LDA]
McLarenet al.[15, 16] have found that the between-class scatter calculated using the standard LDA approach can be influenced by source variation under mismatched conditions, where sources were defined as speech recorded using either microphone or telephone. This influence can be reduced by estimating the between-class scatter using source-normalized i-vectors and fixing the within-class scatter as the residual variations in the i-vector space [15]. The source-normalized between-class scatter,Sbsrc, can be composed of the source-dependent between-class scatter matrices for telephone and microphone-recorded speech, which can be calculated as follows,
Ssrcb =Stelb +Smicb (9) where Stelb = Stel X s=1 ns( ¯ws−w¯tel)( ¯ws−w¯tel)T, (10) Smic b = Smic X s=1 ns( ¯ws−w¯mic)( ¯ws−w¯mic)T, (11)
where the mean i-vector for telephone source ( ¯wtel) is equal to n1
tel Pntel
i=1w
tel
i , and the mean i-vector for
mi-crophone source ( ¯wmic) is equal to n1
mic Pnmic
i=1 w
mic
i . Rather than estimating the within-class scatter separately
as in Equation 4, McLarenet al.calculated the within-class scatter matrix as the difference between a total variance matrix,St, and the source-normalized between-class scatter as:
Sw=St−Ssrcb , (12) where St= N X n=1 (wn−w¯)(wn−w¯)T. (13)
(a) CSS i-vector speaker verification (b) GPLDA speaker verification
Fig. 1. A block diagram of i-vector speaker verification systems, (a) CSS i-vector speaker verification, (b) GPLDA speaker verification.
This approach allowsSwto be more accurately estimated when development dataset does not provide
exam-ples of each speech source from every speaker. Similarly to the WCCN[LDA] approach outlined previously, the SN-LDA projected WCCN matrix is estimated using Equation 7, and the final WCCN[SN-LDA] ses-sion variability compensated i-vector will be calculated using Equation 8. Scoring of sesses-sion-variability compensated i-vectors for speaker verification is accomplished using a CSS, which was found to provide similar performance to support vector machine (SVM) based approaches with a considerable increase in ef-ficiency [2]. CSS operates by comparing the angles between a session variability compensated test i-vector,
ˆ
wtest, and a session variability compensated target i-vector ˆwtarget:
score( ˆwtarget,wˆtest) = D ˆ wtarget,wˆtest E wˆtarget kwˆtestk . (14)
CSS i-vector speaker verification system involves three major steps: i-vector feature extraction, session variability compensation using subspace approach and scoring using CSS, and the first two steps were detailed in previous section.
2.3. PLDA session variability compensation
Rather than attempting to compensate for session variability in the i-vector space using the subspace transformation approach, a more sophisticated approach is to directly model session and speaker variabil-ity within the i-vector space, using the PLDA technique introduced for i-vector speaker verification by Kenny [10]. Kenny found that a heavy-tailed (HTPLDA) approach showed significant improvement over GPLDA [10], as the heavy-tailed distribution showed a better match for i-vector behaviour, but recently Garcia-Romeroet al. have introduced a length-normalized approach that transforms the heavy-tailed non-normalized i-vectors towards a more Gaussian distribution [4] to get similar performance with less compu-tational complexity. The length-normalized GPLDA approach was chosen for PLDA throughout this paper. The i-vector normalization approach follows two steps: (1) linear whitening and (2) length-normalization. A linear-whitened i-vector,wwht, can be estimated as follows,
wwht = d−
1
2UTw (15)
whereΣis a covariance matrix, estimated using development i-vectors.Uis an orthonormal matrix contain-ing the eigenvectors ofΣanddis a diagonal matrix containing the corresponding eigenvalues.
0 10 20 30 40 50 0 5 10 15 20 25 30 35
Test duration/ sec
EER/ %
WCCN[LDA]
Fig. 2.Performance comparison of WCCN[LDA] based CSS i-vector system on short-short evaluation conditions (the same length was used for enrolment (training) and verification (testing)).
The length-normalized i-vector feature,wnorm, can be calculated as follows,
wnorm = wwht
kwwhtk
(16) In GPLDA modelling, the speaker and channel dependent i-vector,wnorm, can then be defined as
wnormr = w¯norm+U1x1+U2x2r+εr (17)
where for given speaker recordingsr = 1, ...R,U1 is the eigenvoice matrix andU2 is the eigenchannel matrix. We assume that speaker factors (x1) have a standard normal distribution of dimensionN1, and the residuals (εr) also have a standard normal distribution with mean 0 and a covariance matrix (Λ−1). The
speaker specific part can be represented as ¯w+U1x1. The covariance matrix of the speaker part isU1U1T which represents the between speaker variability. The channel specific part is represented asU2x2r+εr. The
covariance matrix of channel part isΛ−1+U2U2Twhich describes the within speaker variability.
In our implementation, we assume that the precision matrix (Λ) is full rank and remove the eigenchan-nel (U2) from Equation 17, as we found that PLDA speaker verification doesn’t show major improvement from the inclusion of eigenchannels, and removing them provided a useful decrease in computational com-plexity. Although PLDA techniques are designed to compensate for the speaker and channel variability within the PLDA technique itself, they can benefit from subspace channel compensation being applied be-fore hand as well [6].
Scoring in GPLDA is conducted using the batch likelihood ratio between a target and test i-vector [10]. Given two i-vectors, ˆwnormtargetand ˆwnormtest , the batch likelihood ratio can be calculated as follows,
ln P( ˆw
norm target,wˆ
norm test |H1)
P( ˆwnormtarget |H0)P( ˆwnormtest |H0)
(18)
whereH1denotes the hypothesis that the i-vectors represent the same speakers andH0denotes the hypoth-esis that they do not. GPLDA speaker verification also involves three stages: i-vector feature extraction, session variability compensation using PLDA modelling and scoring using the batch likelihood ratio. Sub-space session variability compensation approaches can be also applied on PLDA approach to compensate additional session variation.
0.8 0.6 0.4 0.2 0.0 0.2 0.4 0.6 0.8 2.6 2.4 2.2 2.0 1.8 1.6 1.4 1.2 1.0 10 sec 20 sec 40 sec 5 sec 100 sec
(a) Original space
0 5 10 15 20 15 10 5 0 5 10 15 10 s e c 20 s e c 40 s e c 5 s e c 100 s e c
(b) PCA projected space
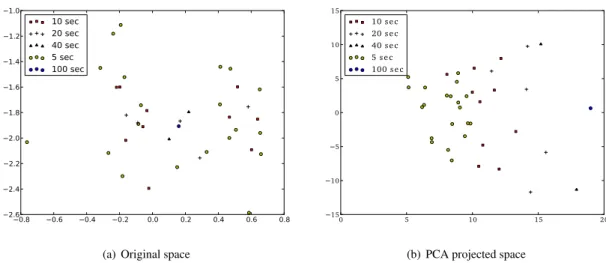
Fig. 3. Distribution of first two dimensions of i-vector features of same speaker and session variability at varying utterance lengths:
(a)Original space,(b)PCA projected space.
3. Short utterance i-vector speaker verification
In the presence of high intersession variability conditions, a significant amount of speech is required for development, and evaluation (enrolment and verification) of state-of-the-art speaker verification systems. Reducing the amount of speech required for development and evaluation while obtaining satisfactory per-formance has been the focus of a number of recent studies in state-of-the-art speaker verification design, including JFA [21, 22], i-vector[7], PLDA [8] and SVM [17] approaches. Previously, investigations of CSS i-vector system with standard session compensation techniques, such as LDA, WCCN, NAP and scatter dif-ference NAP (SD-NAP) has found that when the utterance length is reduced, the performance reduces at an increasing rate rather than proportional [7]. Subsequently, we have investigated the advantages of including short utterances in the development data for the speaker verification design and have found that when score normalization and PLDA are trained using short instead of full-length utterances, speaker verification is im-proved for short utterances during evaluation [8]. This approach also has a useful side-effect for real world speaker verification applications, as it allows the volume of required development data to also be reduced. Recently, Kennyet al.[13] investigated quantifying the uncertainty associated with the i-vector extraction process, including changes in utterance length, and propagated that uncertainty into a PLDA classifier. In addition, Hasanet al.[5] have analysed the effect of shortening utterance on i-vector extraction, finding that duration variability can be modelled as additive noise in the i-vector space, using a PLDA classifier.
3.1. Short utterance variation
In this paper, initially we analyse the performance of i-vector speaker verification when short-length utterance are used as enrolment and verification data. In this initial evaluation, we have chosen the CSS i-vector system for this analysis as it is more computationally efficient than GPLDA, but GPLDA approaches will also be investigated later in this paper. The performance comparison of a WCCN[LDA] CSS i-vector system on short-short evaluation conditions is shown in Figure 2. For these, and all short-utterance experi-ments undertaken in this paper, the short-short evaluation condition utterances were obtained by truncating utterances in theshort2-short3condition of the NIST2008 Speaker Recognition Evaluation (SRE) to the specified length of active speech for both enrolment and verification. It is evident from Figure 2 that when the utterance length reduces, the speaker verification performance reduces at an increasing rate rather than proportional, indicating that very short utterance i-vectors have a significant amount of uncertainty and the current state-of-the-art approaches failed to cope with this uncertainty.
Fig. 4.A flow chart of SUVN[LDA] estimation.
It is well known that typical full-length utterance i-vectors have speaker and session variation [11, 12]. However, we hypothesize that i-vectors extracted from short utterances can also vary considerably with changes in phonetic content between i-vectors. We can illustrate the phonetic-content variation across a range of short utterances by comparing the most significant i-vector features as shown using the first two dimensions of the raw i-vectors in Figure 3(a), and of PCA-projected i-vectors in Figure 3(b). In the original space scatter plot, we have just randomly chosen the two i-vector dimensions and plotted, but there is no guarantee that these two dimensions show the larger variations. In order to see that how the larger variation dimensions behave, the PCA plot was used. These plots show the variation in i-vectors captured from an identical full-length utterance (110400 from NIST2008 SRE), while the length over which the i-vectors are extracted is varied from 5 sec up to 100 sec.
While there is no variation due to change in speaker or session in these plots (as they all come from the same utterance), it can be clearly seen that there is significant difference between the i-vectors, with the difference between the short i-vectors and the 100-second i-vector reducing as the length approaches the 100-second i-vector. Similar results are observed in the PCA projection in Figure 3(b).
These plots clearly demonstrate that there is another source of variation (outside of speaker and ses-sion) when shorter utterances are used for i-vector extraction, which we believe to be largely related to the linguistic content of the short section of the utterance used for i-vector extraction. In traditional longer utterance i-vector extraction, this linguistic variation is averaged over a large variety of linguistic content, and can largely be ignored, but in short utterances it must be considered explicitly. In this paper, we refer to this linguistic content variation as “short utterance variation”, and short utterance variance compensation techniques are introduced to adequately compensate this variation for short utterance i-vector extraction.
3.2. Short utterance variance normalization
In this section, short utterance variance normalization (SUVN) is introduced to compensate the short utterance variations present in CSS i-vector speaker verification. As we have demonstrated previously, short utterances cannot provide adequate information for reliably extracting speaker i-vectors when compared to longer utterances, but we believe that the mismatch between shorter utterances and their longer counterparts can be compensated to improve the performance of short utterance speaker verification.
In order to capture the uncertainty in short utterances, we use a large set of development data and truncate each utterance to produce short utterances. The short utterance variance matrix ,SS UV, can be calculated as
the inner product of the difference between the full and short-length i-vectors, ie:
SS UV =N1PnN=1(w
f ull
n −wshortn )(w f ull
n −wshortn )T (19)
wherewf ullandwshortare respectively the full- and short-length i-vector features, andNis total number of
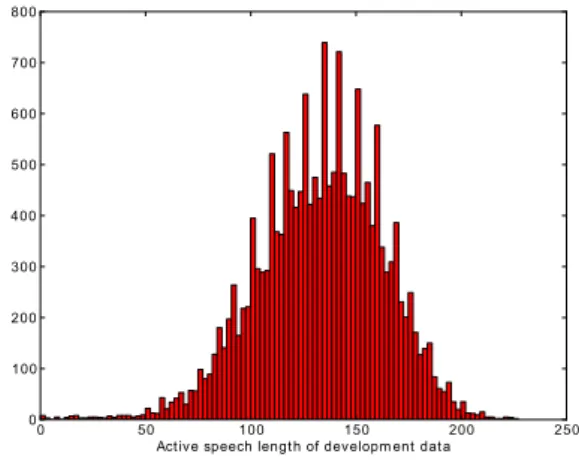
0 50 100 150 200 250 Act ive speech lengt h of developm ent dat a
0 100 200 300 400 500 600 700 800
Fig. 5.Distribution of active speech length of NIST development data.
0 10 20 30 40 50 60 70 80 90 0 10 20 30 40 50 60 70 80 90 100
SSUV[LDA]training utternace length/ sec
trace
(SSUV[LDA]
)
Female development data
Fig. 6. Variance captured in theSS UV[LDA] matrix (measured using the trace) as the utterance lengths approach their full-length
counterparts.
Based upon theSS UVestimation, the SUVN approach is introduced to compensate the utterance
varia-tion between short- and full-length utterances, and the SUVN matrix,D1, is calculated using the Cholesky decomposition ofD1DT1 =SS UV−1. The SUVN compensated i-vector ( ˆwSUVN) is calculated as follows,
ˆ
wSUVN=D1w (20)
In the above approach, the SUVN technique is applied without a dimensionality reduction approach. However, session and utterance variation can be effectively compensated if it is applied on dimension-reduced space. By first transforming the i-vectors into a LDA-projected space, the combined SUVN[LDA] approach can provide further improvement over SUVN alone. In the SUVN[LDA] approach, first a LDA matrix,A, is estimated as described in Section 2.2, and then the SUVN matrix is estimated on the LDA-projected subspace to compensate the utterance variation. The short utterance variance matrix,SS UV[LDA],
0 10 20 30 40 50 60 70 80 90 0.3 0.32 0.34 0.36 0.38 0.4 0.42 0.44 0.46 0.48 0.5
SSUV[LDA]training utternace length/ sec
Average cosine score Raw i−vector LDA projection SUVN[LDA] projection
Fig. 7. The similarity (measured in cosine distance score) between SUVN[LDA] projected full- and short-length utterances, under varying SUVN training length. Raw and LDA projected 10-second utterances are also included for comparison.
on LDA projected space is defined as follows,
SS UV[LDA] = 1 N N X n=1 (AT(wf ull n −wnshort))(AT(w f ull n −wshortn ))T (21)
ForSS UV[LDA] estimation, the actual definition of what constitutes a full and/or short-length utterance needs to be established. The NIST 2004, 2005 and 2006 SRE corpora as well as Switchboard II were used as development data for SUV training, which includes 1386 female and 1117 male speakers. Looking at the distribution of active-speech length (utterance length after voice activity detection) across our develop-ment dataset shown in Figure 5 we can see that most utterances are around 140 seconds in length, with few utterances over 200 seconds. In order to provide a clear representation of a “full-length” utterance for this research we have defined full-length to be an 100-second utterance, and development was therefore done accordingly on only development utterances over 100 seconds in active-speech length, with all utterances trimmed to 100-seconds of active speech. In order to capture the SUV, the short-utterances during develop-ment are represented by utterances trimmed to length of 0, 5, 10, 30, 50, 90 and 99 seconds of active-speech from the original utterances. One short utterance was extracted from the original full-length utterance.
The variation captured by SUV can be quantified simply usingtrace(SS UV[LDA]), and is shown in Fig-ure 6. It is evident that when the utterance length used forSS UV[LDA]training is reduced, theSS UV[LDA]matrix captures more utterance variations due to the higher variation in linguistic content as utterance lengths are reduced.
The LDA projected SUVN matrix, D2, can be calculated using Cholesky decomposition of D2DT2 =
SS UV[LDA]−1. The flow chart of SUVN[LDA] estimation is shown in Figure 4, which is quite similar to the flow chart of WCCN[LDA] estimation. The LDA projected utterance variation compensated i-vector ( ˆwSUVN[LDA]) can be calculated as follows,
ˆ
wSUVN[LDA] =D2ATw (22)
Similarly to the SUVN[LDA] approach outlined above, for the SUVN[SN-LDA] approach, after the i-vectors are first projected into session compensated SN-LDA space, a SUVN matrix is estimated to reduce the utterance variation.
By looking at the cosine distance scores between short (10 sec) and full (100 sec) length utterances captured from the same full-length utterance, shown in Figure 7, we can see that while traditional LDA can
decrease the cosine distance, much better performance can be obtained by SUVN[LDA] by taking advantage of the SUVN transformation. SUVN[LDA] reduces the mismatch between full- and short-length i-vectors for all speakers. As it’s hard to plot individual speaker scores, average cosine score is plotted in the Figure 7. It can also be clearly seen from Figure 7 that when the SUVN transformation is trained on 99 second short utterances (compared to the full-length of 100 seconds), both still have different linguistic content and the SUVN approach effectively compensates the utterance variation. When the SUVN training utterance length reduces further, though theSS UV[LDA] matrix captures more utterance variation (refer Figure 6), the SUVN approach fails to compensate all the utterance variation as the Cholesky decomposition is applied to inverse ofSS UV[LDA]matrix, and it is not guaranteed to compensate for larger utterance variation.
3.3. Modelling the short utterance variance using GPLDA
The alternative approach to modelling the short utterance variance is investigated in this section. This approach is based upon recent work by Hasanet al.[5], where they showed that duration variability can be considered as additive noise in the i-vector space, modelled using the PLDA approach. In this section, a similar approach is taken to model the short utterance variation on LDA and SN-LDA projected spaces.
As short utterance variation is defined in terms of the difference with a full-length utterance, full-length utterances, by definition, do not have short utterance variation. So during development for SUV PLDA, utterance variation information is artificially added to full-length utterances and the simulated SUV is mod-elled using the PLDA approach. The short utterance variance (SUV) matrix,SS UV, can be estimated using
the Equation 19. The SUV decorrelated matrix, D3, is calculated using the Cholesky decomposition of
D3DT3 =SS UV. A random vector with utterance variation information can be generated if random normally
independently distributed vector,d, withµ=0.0 andσ=1.0 is multiplied by the SUV decorrelated matrix,
D3. The SUV-added full-length development vectors can be estimated as follows,
wf ullS UV =wf ull+D3Td (23)
After the SUV-added full-length i-vectors are extracted, the length-normalized GPLDA model parameters are estimated in as described in Section 2.3.
3.3.1. Modelling the SUV on LDA projection
As an extended work of Hasanet al.[5], this paper will investigate extending SUV GPLDA modelling onto LDA and SN-LDA projected spaces. Similarly to the extraction of SUV-added full-length i-vectors, the SUV-added LDA (SUV[LDA]) full-length i-vectors can be extracted as follows,
wf ullS UV[LDA]=ATwf ull+DT4A
Td (24)
The estimation of the LDA matrix,Ais detailed in Section 2.2, and the short utterance variance matrix,
SS UV[LDA], on LDA projected space is estimation using Equation 21. The SUV decorrelated matrix,D4, is calculated using Cholesky decomposition ofD4DT4 = SS UV[LDA]. The SUV-added SN-LDA (SUV[SN-LDA]) full-length i-vectors are also extracted in similar way to SUV[LDA], but using SN-LDA in place of LDA. Once the SUV[LDA] or SUV[SN-LDA] full-length vectors are extracted, the GPLDA model param-eters are estimated as described in Section 2.3.
3.4. Experimental set-up
The proposed methods were evaluated using the the NIST 2008 and NIST 2010 SRE corpora. The shortened evaluation utterances were obtained by truncating the NIST 2008short2-short3and NIST 2010
core-coreconditions to the specified length of active speech for both enrolment and verification. Prior to truncation, the first 20 seconds of active speech were removed from all utterances to avoid capturing similar data across multiple utterances.
For NIST 2008, the performance was evaluated using the equal error rate (EER) and the minimum decision cost function (DCF), calculated using Cmiss = 10, CFA = 1, and Ptarget = 0.01. NIST 2008
Table 1.Performance comparison of baseline systems on NIST 2008 truncated 10 sec-10 sec evaluation conditions. The best perform-ing systems by both EER and DCF are highlighted across each column.
(a)CSS i-vector speaker verification
Approach Interview-interview Interview-telephone Telephone-microphone Telephone-telephone
EER DCF EER DCF EER DCF EER DCF
Uncompensated 25.51% 0.0923 32.70% 0.0975 26.41% 0.0880 23.48% 0.0805
WCCN 19.81% 0.0798 24.33% 0.0896 19.76% 0.0821 17.87% 0.0695
WCCN[LDA] 18.10% 0.0767 22.67% 0.0861 19.03% 0.0817 16.46% 0.0679
WCCN[SN-LDA] 18.01% 0.0771 21.57% 0.0858 18.94% 0.0813 16.56% 0.0683
(b)GPLDA speaker verification
Approach Interview-interview Interview-telephone Telephone-microphone Telephone-telephone
EER DCF EER DCF EER DCF EER DCF
Standard GPLDA 18.32% 0.0786 21.09% 0.0864 18.00% 0.0817 15.07% 0.0673
WCCN-GPLDA 18.36% 0.0786 21.09% 0.0864 18.00% 0.0816 14.99% 0.0674
WCCN[LDA]-GPLDA 17.84% 0.0769 20.38% 0.0843 17.72% 0.0809 15.80% 0.0664
WCCN[SN-LDA]-GPLDA 17.91% 0.0767 20.09% 0.0838 17.66% 0.0807 15.40% 0.0661
evaluation was performed using thetelephone-telephone, interview-interview,telephone-microphoneand
interview-telephoneenrolment-verification conditions [18].
The performance for the NIST 2010 SRE was evaluated using the EER and the old minimum decision cost function (DCFold), calculated usingCmiss=10,CFA=1, andPtarget =0.01, where evaluation was
per-formed using thetelephone-telephone,interview-interview,interview-microphoneandinterview-telephone
condition [19].
We have used 13 feature-warped MFCC with appended delta coefficients and two gender-dependent UBM containing 512 Gaussian throughout our experiments. The UBMs were trained on telephone and microphone speech data from NIST 2004, 2005, and 2006 SRE corpora for telephone and microphone i-vector experiments. These gender-dependent UBMs were used to calculate the Baum-Welch statistics before training a gender-dependent total-variability subspace of dimension Rw = 500. A pooled
total-variability subspace was used to calculate the i-vector speaker representations and the channel compensation approaches and GPLDA parameters were trained using telephone and microphone speech data from NIST 2004, 2005 and 2006 SRE corpora as well as Switchboard II. We empirically selected 120 eigenvoices (N1) as best value according to speaker verification performance. A full precision matrix was used forΛ, rather than the diagonal. 150 eigenvectors were selected for LDA and SN-LDA training by performance on a development dataset. Randomly selected telephone and microphone utterances from NIST 2004, 2005 and 2006 were pooled to form the score normalization dataset. ZT normalization was applied for CSS i-vector speaker verification, and S-normalization for length-normalized GPLDA [20]. The short-length development data was obtained by truncating the telephone and microphone speech data from NIST 2004, 2005 and 2006 SRE corpora as well as Switchboard II to the specified length of active speech.
4. Experimental analysis of proposed techniques
4.1. CSS i-vector and GPLDA baseline systems
In this paper, we have taken the standard CSS i-vector and length-normalised GPLDA systems as our two baseline systems. The CSS i-vector systems, both with and without session variability compensa-tion approaches; and the standard GPLDA approach, and session-compensated i-vector GPLDA approach were all evaluated to provide a reference as the baseline approaches perform on 10 sec-10 sec (enrolment-verification) evaluation conditions.
The performance comparison of the CSS i-vector and GPLDA baseline systems for NIST 2008 truncated 10 sec-10 sec is shown in Table 1. As had been previously shown by Dehak [3] for full-length utterances, we have shown that the WCCN[LDA] CSS i-vector system provides an improvement over WCCN CSS i-vector system on shortened evaluation conditions as well. The results also confirm that the WCCN[SN-LDA] CSS approach provides an improvement over the WCCN[LDA] CSS approach on mismatched conditions, confirming and extending the full-length results shown by McLaren [15]. However, the WCCN-projected GPLDA system has not shown any improvement over standard GPLDA as the full rank precision matrix, Λ, in GPLDA, effectively models the intra-speaker variance. However, the WCCN[LDA] and WCCN[SN-LDA] projected-i-vector GPLDA systems do show improvement over standard GPLDA system in mis-matched conditions as the session variability compensation does provide a benefit in this case.
0 10 20 30 40 50 60 70 80 90 14 16 18 20 22 24 26 28 30 32 34
SUVN estimation data length/ sec
EER/
%
WCCN[LDA] based CSS i−vector (Baseline) WCCN[SN−LDA] based CSS i−vector (Baseline) SUVN based CSS i−vector
SUVN[LDA] based CSS i−vector SUVN[SN−LDA] based CSS i−vector
(a) interview-interview condition
0 10 20 30 40 50 60 70 80 90 14 16 18 20 22 24 26 28 30 32 34
SUVN estimation data length/ sec
EER/
%
WCCN[LDA] based CSS i−vector (Baseline) WCCN[SN−LDA] based CSS i−vector (Baseline) SUVN based CSS i−vector
SUVN[LDA] based CSS i−vector SUVN[SN−LDA] based CSS i−vector
(b) interview-telephone condition 0 10 20 30 40 50 60 70 80 90 14 16 18 20 22 24 26 28 30 32 34
SUVN estimation data length/ sec
EER/
%
WCCN[LDA] based CSS i−vector (Baseline) WCCN[SN−LDA] based CSS i−vector (Baseline) SUVN based CSS i−vector
SUVN[LDA] based CSS i−vector SUVN[SN−LDA] based CSS i−vector
(c) telephone-microphone condition 0 10 20 30 40 50 60 70 80 90 14 16 18 20 22 24 26 28 30 32 34
SUVN estimation data length/ sec
EER/
%
WCCN[LDA] based CSS i−vector (Baseline) WCCN[SN−LDA] based CSS i−vector (Baseline) SUVN based CSS i−vector
SUVN[LDA] based CSS i−vector SUVN[SN−LDA] based CSS i−vector
(d) telephone-telephone condition
Fig. 8. Comparison of SUVN, SUVN[LDA] and SUVN[SN-LDA] against WCCN[LDA] and WCCN[SN-LDA] on the common subset of the 2008 NIST SRE truncated 10 sec-10 sec training and testing condition: (a)interview-interview,(b)interview-telephone,(c)
telephone-microphone, and(d)telephone-telephone.
4.2. Compensating short utterance variance using SUVN approach
In this section, we conducted experiments to examine whether our proposed short utterance variance normalization technique can improve over existing approaches for short utterance i-vector extraction.
Ini-Table 2. Comparison of the SUVN[LDA] and SUVN[SNLDA] systems against the WCCN[LDA] and WCCN[SN-LDA] systems on the common set of the 2008 NIST SRE truncated 10 sec-10 sec and 2010 NIST SRE truncated 10 sec-10 sec conditions. The best performing systems by both EER and DCF are highlighted down each column.
(a) NIST 2008 truncated 10 sec-10 sec condition
System Interview-interview Interview-telephone Telephone-microphone Telephone-telephone
EER DCF EER DCF EER DCF EER DCF
Baseline (WCCN[LDA]) 18.10% 0.0767 22.67% 0.0861 19.03% 0.0817 16.46% 0.0679
New approach (SUVN[LDA]) 15.99% 0.0718 21.22% 0.0840 18.28% 0.0800 14.75% 0.0618
Relative improvement (%) 13.20% 6.82% 6.83% 2.50% 4.10% 2.13% 11.59% 9.87%
Baseline WCCN[SN-LDA] 18.01% 0.0771 21.57% 0.0858 18.94% 0.0813 16.56% 0.0683
New approach SUVN[SN-LDA] 16.03% 0.0708 19.83% 0.0787 17.12% 0.0780 14.73% 0.0620
Relative improvement (%) 10.99% 8.17% 8.07% 8.28% 9.61% 4.06% 11.05% 9.22%
(b)NIST 2010 truncated 10 sec-10 sec condition
System Interview-interview Interview-telephone Interview-microphone Telephone-telephone
EER DCFold EER DCFold EER DCFold EER DCFold
Baseline WCCN[LDA] 22.22% 0.0834 20.45% 0.0779 20.45% 0.0750 16.64% 0.0714
New approach SUVN[LDA] 20.74% 0.0798 20.45% 0.0756 18.60% 0.0708 14.55% 0.0657
Relative improvement (%) 6.66% 4.32% 0.00% 2.95% 9.05% 5.60% 12.56% 7.98%
Baseline WCCN[SN-LDA] 22.40% 0.0839 20.58% 0.0779 20.80% 0.0754 16.38% 0.0712
New approach SUVN[SN-LDA] 20.84% 0.0796 19.17% 0.0727 18.72% 0.0697 14.41% 0.0670
Relative improvement (%) 6.96% 5.13% 6.85% 6.68% 10.00% 7.56% 12.03% 5.90%
tially, the SUVN, SUVN[LDA] and SUVN[SN-LDA] approaches were analysed against WCCN[LDA] and WCCN[SN-LDA] on NIST 2008 SRE truncated 10sec-10sec training and testing condition. The SUVN compensation approach was trained using different short utterances lengths, from 0 seconds to 99 seconds, as shown being evaluated against 10sec-10sec training-testing conditions in Figure 8. The special case of 0 seconds, indicate that the SUVN matrix is just estimated as the inner-product of the full-length (100 second) i-vectors. It can be observed in Figure 8 that when the SUVN compensation matrix is trained on “short” utterances above 90 seconds, the SUVN[LDA] and SUVN[SN-LDA] approaches achieves the best perfor-mance as the SUVN approach effectively compensates the utterance variation even when SUVN is trained on almost similar sized full- and short-length utterances.
When the SUVN training reduces below the 10 second length of the evaluation (train-test) utterances, even though the SUV matrix captures more utterance variance (as was seen in Figure 6), the SUVN ap-proaches are not as effective in improving the speaker verification as the very short-length i-vector estimate has a significant amount of uncertainty, and Cholesky decomposition ofD2DT2 =SS UV[LDA]−1cannot com-pensate the utterance variation adequately. Due to space limitations, this paper is only showing evaluation on 10 sec-10 sec conditions, but similar findings exist for other shortened evaluation data, with SUVN per-formance degrading considerably in all cases as the development lengths go below the evaluation lengths.
The performance of the SUVN[LDA] and SUVN[SN-LDA] systems depends heavily on the short ut-terance development data used for estimation of the SUVN transformation, and the best short utut-terance lengths were selected for SUVN[LDA] and SUVN[SN-LDA] estimation for each condition. Using the short-utterance lengths chosen from Figure 8 to provide the lowest EER, the results of the SUVN ap-proaches against the baseline systems using 10sec-10sec train-test evaluation utterances across the NIST 2008 and NIST 2010 evaluation datasets are shown in Table 2. These results suggest that the SUVN[LDA] approach shows over 10% improvement over the WCCN[LDA] approach ontelephone-telephoneand inter-view-interviewconditions as it adequately compensates the utterance variation between short and full-length utterances. The SUVN[SN-LDA] approach has also shown over 8% improvement when compared to the WCCN[SN-LDA] approach in theinterview-telephoneandtelephone-microphonemismatched conditions as it is compensating the utterance and source variation present. These results suggest that the traditional session variability compensation approaches, including WCCN[LDA] and WCCN[SN-LDA] should be
re-0 10 20 30 40 50 60 70 80 90 16 17 18 19 20 21 22 23 24
SUVN & SUV estimation data length/ sec
EER/
%
WCCN[LDA] projected GPLDA (Baseline) SUVN[LDA] projected GPLDA SUV modelling using GPLDA SUV[LDA] modelling using GPLDA SUV[SN−LDA] modelling using GPLDA SUVN[SN−LDA] based CSS i−vector
(a) interview-interview condition
0 10 20 30 40 50 60 70 80 90 19 20 21 22 23 24 25 26 27 28
SUVN & SUV estimation data length/ sec
EER/
%
WCCN[LDA] projected GPLDA (Baseline) SUVN[LDA] projected GPLDA SUV modelling using GPLDA SUV[LDA] modelling using GPLDA SUV[SN−LDA] modelling using GPLDA SUVN[SN−LDA] based CSS i−vector
(b) interview-telephone condition 0 10 20 30 40 50 60 70 80 90 16 17 18 19 20 21 22 23 24
SUVN & SUV estimation data length/ sec
EER/
%
WCCN[LDA] projected GPLDA (Baseline) SUVN[LDA] projected GPLDA SUV modelling using GPLDA SUV[LDA] modelling using GPLDA SUV[SN−LDA] modelling using GPLDA SUVN[SN−LDA] based CSS i−vector
(c) telephone-microphone condition 0 10 20 30 40 50 60 70 80 90 14 15 16 17 18 19 20 21 22
SUVN & SUV estimation data length/ sec
EER/
%
WCCN[LDA] projected GPLDA (Baseline) SUVN[LDA] projected GPLDA SUV modelling using GPLDA SUV[LDA] modelling using GPLDA SUV[SN−LDA] modelling using GPLDA SUVN[SN−LDA] based CSS i−vector
(d) telephone-telephone condition
Fig. 9. Comparison of SUV, SUV[LDA], SUV[SN-LDA] modelling using GPLDA approach against WCCN[LDA], SUVN[LDA] pro-jected GPLDA and SUVN[SN-LDA] based CSS i-vector systems on the common subset of the 2008 NIST SRE truncated 10 sec-10 sec training and testing condition: (a)interview-interview,(b)interview-telephone,(c)telephone-microphone, and(d) telephone-telephone.
placed with the SUVN[LDA] and SUVN[SN-LDA] for short-utterance CSS speaker verification.
Subsequently, the SUVN approach was also analysed with GPLDA speaker verification; however our ex-periment studies have found that the SUVN[LDA] projected GPLDA system doesn’t show any improvement over the WCCN[LDA] projected GPLDA system as it appears the full-rank precision matrix of GPLDA ap-proach effectively reduces the mismatch between full- and short-length i-vectors. In the interest of brevity, these results have therefore been omitted.
4.3. Modelling the short utterance variance using GPLDA
In this section, we will demonstrate an alternative approach extending upon the work of Hasanet al.[5], to show that the SUV GPLDA approach outlined in Section 3.3 can effectively model the short utterance variance in a GPLDA i-vector approach.
A performance comparison of the SUV GPLDA approaches (SUV[LDA] and SUV[SN-LDA]), against GPLDA and session-compensated baseline GPLDA approaches (WCCN[LDA], SUVN[LDA]) is shown in
Table 3.Comparison of SUV, SUV[LDA], SUV[SN-LDA] modelling using GPLDA approach against WCCN[LDA] projected GPLDA system on the common set of the 2008 NIST SRE truncated 10 sec-10 sec and 2010 NIST SRE truncated 10 sec-10 sec conditions. The best performing systems by both EER and DCF are highlighted down each column.
(a) NIST 2008 truncated 10 sec-10 sec condition
System Interview-interview Interview-telephone Telephone-microphone Telephone-telephone
EER DCF EER DCF EER DCF EER DCF
Baseline system
WCCN[LDA]-GPLDA 17.84% 0.0769 20.38% 0.0843 17.72% 0.0809 15.80% 0.0664 Modelling utterance variation using GPLDA
SUV modelling 17.84% 0.0718 20.38% 0.0840 17.92% 0.0739 14.10% 0.0644 Relative improvement (%) 0.00% 6.63% 0.00% 0.36% -1.13% 8.65% 10.76% 3.01% SUV[LDA] modelling 17.21% 0.0735 19.82% 0.0854 17.25% 0.0775 14.81% 0.0617 Relative improvement (%) 3.53% 4.42% 2.75% -1.30% 2.65% 4.20% 6.27% 7.08% SUV[SN-LDA] modelling 17.19% 0.0697 19.56% 0.0804 16.59% 0.0715 14.66% 0.0646 Relative improvement (%) 3.64% 9.36% 4.02% 4.63% 6.38% 11.62% 7.22% 2.71%
(b)NIST 2010 truncated 10 sec-10 sec condition
System Interview-interview Interview-telephone Interview-microphone Telephone-telephone
EER DCFold EER DCFold EER DCFold EER DCFold
Baseline system
WCCN[LDA]-GPLDA 21.51% 0.0844 19.84% 0.0787 19.70% 0.0757 16.55% 0.0701 Modelling utterance variation using GPLDA
SUV modelling 21.06% 0.0810 19.12% 0.0775 18.42% 0.0709 14.83% 0.0685 Relative improvement (%) 2.09% 4.03% 3.63% 1.52% 6.50% 6.34% 10.39% 2.28% SUV[LDA] modelling 21.37% 0.0822 19.04% 0.0761 18.69% 0.0729 14.96% 0.0686 Relative improvement (%) 0.65% 2.61% 4.03% 3.30% 5.13% 3.70% 9.61% 2.14% SUV[SN-LDA] modelling 21.42% 0.0820 19.41% 0.0768 19.30% 0.0729 15.11% 0.0670 Relative improvement (%) 0.42% 2.84% 2.17% 2.41% 2.03% 3.70% 8.70% 4.42%
Figure 9. The best-performing SUVN[LDA] CSS approach from the previous section is also included for comparison. From these results, it can be observed that SUV GPLDA approaches are shown to provide a clear improvement over the WCCN[LDA] and SUVN[LDA] GPLDA approaches on the matched telephone-telephone condition. On the other hand, the SUV[LDA] and SUV[SN-LDA] GPLDA approaches are shown to provide improvement over the WCCN[LDA] and SUVN[LDA] GPLDA approaches across all condi-tions when the GPLDA SUV process is trained using 30 sec utterances, allowing the GPLDA approach to explicitly model the short utterance variation and capture more speaker discriminant information.
It can be seen in Figure 9, that when the SUV training utterance length goes below 5 sec, the speaker verification performance reduces drastically as very short utterance i-vectors have a large level of uncertainty and provide an unreliable estimate of the ’true’ full-length i-vector. In addition, we also observe that when the SUV training utterances are longer than 50 seconds, the captured utterance variation reduces (as seen in Figure 6), and the lesser variation available between the short and full-length utterances produces a related reduction in speaker verification performance.
Similarly to the CSS i-vector results reported earlier, the performance of the SUV GPLDA approaches depend heavily on the length of the short utterance development data used for calculating the SUV-added GPLDA modelling, and the best short utterance lengths were selected for SUV, SUV[LDA] and SUV[SN-LDA] estimation for each condition. Using the short-utterance lengths chosen from Figure 9 that provide the lowest EER, the results of the SUV GPLDA approaches against the baselines systems using 10sec-10sec train-test evaluation utterances against the NIST 2008 and NIST 2010 evaluation datasets are shown in Table 3. It can be seen that the SUV GPLDA modelling approaches show an improvement over the baseline systems, as the SUV-added GPLDA approach can effectively model the short utterance variance. Based upon these results, we believe that using SUV-added full-length utterances instead of full-length utterances for GPLDA modelling is a better approach for short utterance evaluation of GPLDA speaker verification.
5. Conclusions
The performance of i-vector speaker verification systems degrade rapidly as the available amount of en-rolment and/or verification speech decreases, limiting the utility of speaker verification in real world appli-cations. This paper proposes techniques to improve the performance of i-vector based speaker verification systems when only short speech utterances are available. Our study has been based on two state-of-the-art i-vector based speaker recognition systems: the cosine similarity scoring (CSS) i-vector and length-normalised Gaussian PLDA (GPLDA).
Previous research studies had found that a typical i-vector contains both speaker and session variation. In this paper, we have studied the shortcoming of short utterance i-vector features, and in the process, provided two major insights. The first insight is that, in addition to speaker and session variation, short utterance i-vectors also exhibit considerable utterance variation arising from differences in linguistic content, whereas long utterance i-vectors linguistic variation can normally be averaged out over the length of the utterance. The second insight is that the utterance variation due to the differences in the linguistic content of short utterances can be learned using the development data of i-vectors. Based upon these observations the concepts of SUVN and SUV have been introduced to compensate the session and utterance variations in CSS i-vector and PLDA speaker verification systems. The performance of the speaker verification systems with these utterance variation compensation techniques combined with various state-of-the-art session variability compensation have been investigated for short-duration speech.
There are two key recommendations arising from our research for i-vector based speaker verification with short utterances: (i) when a CSS i-vector approach is used, we recommend the use of SUVN[LDA] and/or SUVN[SN-LDA] instead of standard session variability compensation approaches, such as WCCN[LDA] and/or WCCN[SN-LDA], (ii) when a PLDA approach is used, we recommend the use of WCCN[LDA] and/or WCCN[SN-LDA] followed by SUV modelling using PLDA. It is important in this implementation to artificially add utterance variation information to the length i-vectors for SUV modelling, as full-length short utterances do not, by definition, have any utterance variation.
6. Acknowledgements
This project was supported by an Australian Research Council (ARC) Linkage grant LP130100110 and by the European Commission Marie Curie ITN Bayesian Biometrics for Forensics (BBfor2) network and the Spanish Ministerio de Economia y Competitividad under the project TEC2012-37585-C02-01.
References
[1] Dehak, N., Dehak, R., Glass, J., Reynolds, D., Kenny, P., 2010. Cosine similarity scoring without score normalization techniques. Odyssey Speaker and Language Recognition Workshop.
[2] Dehak, N., Dehak, R., Kenny, P., Brummer, N., Ouellet, P., Dumouchel, P., 2009. Support vector machines versus fast scoring in the low-dimensional total variability space for speaker verification. In: Proceedings of Interspeech. p. 1559 1562.
[3] Dehak, N., Kenny, P., Dehak, R., Dumouchel, P., Ouellet, P., 2010. Front-end factor analysis for speaker verification. Audio, Speech, and Language Processing, IEEE Transactions on PP (99), 1 –1.
[4] Garcia-Romero, D., Espy-Wilson, C., 2011. Analysis of i-vector length normalization in speaker recognition systems. In: Inter-national Conference on Speech Communication and Technology. pp. 249–252.
[5] Hasan, T., Saeidi, R., Hansen, J., Leeuwen, D., 2013. Duration mismatch compensation for i-vector based speaker recognition systems. In: IEEE Int. Conf. on Acoustics, Speech and Signal Processing.
[6] Kanagasundaram, A., Dean, D., Sridharan, S., Vogt, R., 2012. PLDA based speaker verication with weighted LDA techniques. In: Proc. Odyssey Workshop.
[7] Kanagasundaram, A., Vogt, R., Dean, D., Sridharan, S., Mason, M., 2011. i-vector based speaker recognition on short utterances. In: Proceed. of INTERSPEECH. International Speech Communication Association (ISCA), pp. 2341–2344.
[8] Kanagasundaram, A., Vogt, R. J., Dean, D. B., Sridharan, S., 2012. PLDA based speaker recognition on short utterances. In: The Speaker and Language Recognition Workshop (Odyssey 2012). ISCA.
[9] Kenny, P., 2005. Joint factor analysis of speaker and session variability: Theory and algorithms. Tech. rep., CRIM.
[10] Kenny, P., 2010. Bayesian speaker verification with heavy tailed priors. In: Proc. Odyssey Speaker and Language Recogntion Workshop, Brno, Czech Republic.
[11] Kenny, P., Boulianne, G., Ouellet, P., Dumouchel, P., 2006. The geometry of the channel space in GMM-based speaker recogni-tion. In: IEEE Odyssey 2006: The Speaker and Language Recognition Workshop, 2006. pp. 1–5.
[12] Kenny, P., Ouellet, P., Dehak, N., Gupta, V., Dumouchel, P., 2008. A study of inter-speaker variability in speaker verification. IEEE Transactions on Audio, Speech, and Language Processing 16 (5), 980–988.
[13] Kenny, P., Stafylakis, T., Ouellet, P., Alam, M., Dumouchel, P., 2013. PLDA for speaker verification with utterances of arbitrary duration. In: IEEE Int. Conf. on Acoustics, Speech and Signal Processing.
[14] McLaren, M., van Leeuwen, D., 2011. Improved speaker recognition when using i-vectors from multiple speech sources. In: Acoustics, Speech and Signal Processing (ICASSP), 2011 IEEE International Conference on. pp. 5460–5463.
[15] McLaren, M., van Leeuwen, D., 2011. Source-normalised and weighted LDA for robust speaker recognition using i-vectors. In: Acoustics, Speech and Signal Processing (ICASSP), 2011 IEEE International Conference on. pp. 5456–5459.
[16] McLaren, M., van Leeuwen, D., 2012. Source-normalized LDA for robust speaker recognition using i-vectors from multiple speech sources. Audio, Speech, and Language Processing, IEEE Transactions on 20 (3), 755–766.
[17] McLaren, M., Vogt, R., Baker, B., Sridharan, S., 2010. Experiments in SVM-based speaker verification using short utterances. In: Proc. Odyssey Workshop.
[18] NIST, 2008. The NIST year 2008 speaker recognition evaluation plan. Tech. rep., NIST. URLhttp://www.itl.nist.gov/iad/mig/tests/sre/2008/
[19] NIST, 2010. The NIST year 2010 speaker recognition evaluation plan. Tech. rep., NIST. URLhttp://www.itl.nist.gov/iad/mig/tests/sre/2010/
[20] Shum, S., Dehak, N., Dehak, R., Glass, J., 2010. Unsupervised speaker adaptation based on the cosine similarity for text-independent speaker verification. Proc. Odyssey.
[21] Vogt, R., Baker, B., Sridharan, S., September 2008. Factor analysis subspace estimation for speaker verification with short utterances. In: Interspeech 2008. Brisbane, Australia.
[22] Vogt, R., Lustri, C., Sridharan, S., 2008. Factor analysis modelling for speaker verification with short utterances. In: Odyssey: The Speaker and Language Recognition Workshop.
[23] Vogt, R., Sridharan, S., 2008. Explicit modelling of session variability for speaker verification. Computer Speech & Language 22 (1), 17–38.
[24] Zhao, X., Dong, Y., Zhao, J., Lu, L., Liu, J., Wang, H., 2009. Variational Bayesian joint factor analysis for speaker verification. In: Acoustics, Speech and Signal Processing, 2009. ICASSP 2009. IEEE International Conference on. IEEE, pp. 4049–4052.
![Fig. 2. Performance comparison of WCCN[LDA] based CSS i-vector system on short-short evaluation conditions (the same length was used for enrolment (training) and verification (testing)).](https://thumb-us.123doks.com/thumbv2/123dok_us/10055748.2905273/7.892.320.589.181.403/performance-comparison-evaluation-conditions-enrolment-training-verification-testing.webp)
![Fig. 4. A flow chart of SUVN[LDA] estimation.](https://thumb-us.123doks.com/thumbv2/123dok_us/10055748.2905273/9.892.242.665.183.341/fig-a-flow-chart-of-suvn-lda-estimation.webp)
![Fig. 7. The similarity (measured in cosine distance score) between SUVN[LDA] projected full- and short-length utterances, under varying SUVN training length](https://thumb-us.123doks.com/thumbv2/123dok_us/10055748.2905273/11.892.290.590.181.417/similarity-measured-cosine-distance-projected-utterances-varying-training.webp)

![Fig. 8. Comparison of SUVN, SUVN[LDA] and SUVN[SN-LDA] against WCCN[LDA] and WCCN[SN-LDA] on the common subset of the 2008 NIST SRE truncated 10 sec-10 sec training and testing condition: (a) interview-interview, (b) interview-telephone, (c) telephone-micr](https://thumb-us.123doks.com/thumbv2/123dok_us/10055748.2905273/14.892.148.775.378.940/comparison-truncated-condition-interview-interview-interview-telephone-telephone.webp)
![Table 2. Comparison of the SUVN[LDA] and SUVN[SNLDA] systems against the WCCN[LDA] and WCCN[SN-LDA] systems on the common set of the 2008 NIST SRE truncated 10 sec-10 sec and 2010 NIST SRE truncated 10 sec-10 sec conditions](https://thumb-us.123doks.com/thumbv2/123dok_us/10055748.2905273/15.892.145.753.252.374/table-comparison-snlda-systems-systems-truncated-truncated-conditions.webp)
![Fig. 9. Comparison of SUV, SUV[LDA], SUV[SN-LDA] modelling using GPLDA approach against WCCN[LDA], SUVN[LDA] pro- pro-jected GPLDA and SUVN[SN-LDA] based CSS i-vector systems on the common subset of the 2008 NIST SRE truncated 10 sec-10 sec training and te](https://thumb-us.123doks.com/thumbv2/123dok_us/10055748.2905273/16.892.160.774.184.733/comparison-modelling-gplda-approach-jected-systems-truncated-training.webp)
