R E P O R T
Ray BerkelmansÆ Glenn De’athÆ Stuart Kininmonth William J. Skirving
A comparison of the 1998 and 2002 coral bleaching events on the
Great Barrier Reef: spatial correlation, patterns, and predictions
Received: 7 March 2003 / Accepted: 30 June 2003 / Published online: 10 January 2004
Springer-Verlag 2004
Abstract Detailed mapping of coral bleaching events provides an opportunity to examine spatial patterns in bleaching over scales of 10 s to 1,000 s of km and the spatial correlation between sea surface temperature (SST) and bleaching. We present data for two large-scale (2,000 km) bleaching events on the Great Barrier Reef (GBR): one from 1998 and another from 2002, both mapped by aerial survey methods. We examined a wide range of satellite-derived SST variables to determine which one best correlated with the observed bleaching patterns. We found that the maximum SST occurring over any 3-day period (max3d) during the bleaching season predicted bleaching better than anomaly-based SST variables and that short averaging periods (3– 6 days) predicted bleaching better than longer averaging periods. Short periods of high temperature are therefore highly stressful to corals and result in highly predictable bleaching patterns. Max3d SST predicted the presence/ absence of bleaching with an accuracy of 73.2%. Large-scale (GBR-wide) spatial patterns of bleaching were similar between 1998 and 2002 with more inshore reefs bleached compared to offshore reefs. Spatial change in patterns of bleaching occurred at scales of 10 s km, indicating that reefs bleach (or not) in spatial clusters, possibly due to local weather patterns, oceanographic conditions, or both. Approximately 42% of reefs
bleached to some extent in 1998 with 18% strongly bleached, while in 2002,54% of reefs bleached to some extent with 18% strongly bleached. These statistics and the fact that nearly twice as many offshore reefs bleached in 2002 compared to 1998 (41 vs. 21%, respectively) makes the 2002 event the worst bleaching event on record for the GBR. Modeling of the rela-tionship between bleaching and max3d SST indicates that a 1C increase would increase the bleaching occurrence of reefs from 50% (approximate occurrence in 1998 and 2002) to 82%, while a 2C increase would increase the occurrence to 97% and a 3C increase to 100%. These results suggest that coral reefs are pro-foundly sensitive to even modest increases in tempera-ture and, in the absence of acclimatization/adaptation, are likely to suffer large declines under mid-range International Panel for Climate Change predictions by 2050.
Keywords Climate change ÆCoral bleachingÆ Great Barrier ReefÆ Sea-surface temperatureÆSpatial correlation
Introduction
Mass coral-bleaching events, evident as regional-scale episodes of stress in reef corals, have occurred over at least the last two decades. Bleaching events have oc-curred prior to the 1980s, but it is difficult to gauge the spatial extent or the relative intensity of these episodes because of lack of reporting, documentation, and understanding. The first reported thermal bleaching event was in 1911 at Bird Key Reef in the Florida Keys when large numbers of corals were ‘‘injured’’ during unusually hot and calm weather conditions, which also killed many fish, Diadema, and molluscs (Mayer 1914). In 1929, a bleaching event was noted at Low Isles on the GBR, also during hot, calm condi-tions, which killed many corals on the reef flat (Yonge and Nicholls 1931). Further bleaching events were not
DOI 10.1007/s00338-003-0353-y
R. Berkelmans (&)ÆG. De’athÆS. Kininmonth Australian Institute of Marine Science,
Townsville, Q4810, Australia
E-mail: [email protected] Tel.: +61-7-47534268
Fax: +61-7-47534429
R. BerkelmansÆG. De’athÆS. Kininmonth
Cooperative Research Centre for the Great Barrier Reef World Heritage Area, Townsville, Q4810, Australia W. J. Skirving
National Oceanic and Atmospheric Administration,
National Environmental Satellite, Data and Information Service, Office of Research and Applications,
recorded until 1961 when bleaching was observed at Key Largo in the Florida Keys (Shinn 1966). Since 1979, the number, scale, and intensity of reported coral bleaching events has grown dramatically and this trend has been linked to climate change (e.g., Hoegh-Guld-berg 1999). To better understand the link between coral bleaching and climate change, and the implica-tions of climate change for coral reefs, it is important to document large-scale bleaching events in detail. In doing so, we improve our knowledge of the nature, dynamics, contributing factors, and impact of such disturbances. This knowledge will, in turn, help us to better assess the future risk to reefs from climate change at regional scales.
Mass coral-bleaching events do not necessarily affect all reefs in a reef province during a bleaching episode and rarely are bleached reefs affected equally severely. An aerial survey of coral bleaching on the Great Bar-rier Reef during the 1998 event, the worst on record up to that time, showed that up to 72% of surveyed reefs offshore and 13% inshore remained unbleached (Berkelmans and Oliver 1999). In addition, bleaching severity ranged from moderate (1–10% of cover) to extreme (>60% of cover) with all reefs in the latter category occurring on inshore fringing and patch reefs and none occurring offshore (Berkelmans and Oliver 1999). Documentation is important because it provides a context for repeated bleaching episodes and allows reef managers to target the worst affected reefs for special management efforts to ensure that their recov-ery is not hindered by additional anthropogenic stres-ses. Understanding spatial patterns, or ‘‘patchiness,’’ in coral bleaching events is also important because it can help shed light on causal relationships, especially when environmental data are available at suitable spatial scales and can be related to observed bleaching patterns.
Although bleaching is a generalized stress response by zooxanthellate organisms (e.g., Glynn 1993), mass coral bleaching events are most often correlated with temperature stress in conjunction with high light levels (e.g., Dennis and Wicklund 1993; Drollet et al. 1994; Winter et al. 1998; Hoegh-Guldberg 1999; McField 1999; Berkelmans 2002). However, correlating bleaching events with temperature and other environmental data have until now only ever been undertaken with temporal data from one, or a few, specific locations. The spatial correlation of temperature to bleaching remains to be investigated and the capacity of satellite-derived, sea-surface temperatures (SSTs) to predict bleaching is lar-gely untested.
In January and February 2002, the Great Barrier Reef experienced another large-scale coral-bleaching event. We present the results of a dedicated aerial survey to document this event and compare it to the 1998 event that was surveyed in the same manner. We examine the relationship between SST and bleaching, the predictive capacity of SST, and assess the spatial patterns associ-ated with each bleaching event.
Methods Aerial surveys
A dedicated aerial survey was conducted to document the spatial extent and intensity of bleaching on the Great Barrier Reef in the austral summer of 2002. This survey was conducted after early warnings of coral-bleaching conditions were received from several sources: reports from automatic weather stations (Berkelmans et al. 2002; Hendee and Berkelmans 2002); field observations of coral bleaching at sites visited regularly during the summer (Magnetic Island, 1905¢S, 14652¢E, and Davies Reef, 1830¢S, 14723¢E); and numerous bleaching reports from reef visitors. This survey was identical to that conducted in 1998 using fixed-wing aircraft to cover a latitudinal distance of >3,000 km (Berkelmans and Oliver 1999). Surveys were conducted at a flying height of160 m over 11 days between 3 March and 20 March 2002 and covered a total of 641 reefs. This compared with 654 reefs surveyed in 1998, al-though for logistical reasons, the same reefs were not necessarily surveyed in both years. The timing of the surveys was a compro-mise between ensuring that bleaching on reefs was as advanced as it was likely to be during the summer, but before major mortality had a chance to set in. The surveys were conducted soon after the hottest period was over, so most reefs that ultimately bleached are likely to have been recorded as such. Substantial recovery of reefs from bleaching prior to the surveys is unlikely; however, it is possible that there has been some mortality prior to the surveys at some of the worst affected reefs. Overall, it should be noted that the aerial surveys generally give an underestimate of the true extent and severity of bleaching because substantial whitening of corals has to take place before it can be seen from the air (Andre´foue¨t et al. 2002; Berkelmans and Oliver 1999). Reefs were classified into five bleaching categories based on the proportion of coral cover that appeared white in a zone covering the reef crest and upper reef slope. To conform to convention, the category labels were changed from the 1998 survey (Berkelmans and Oliver 1999), but the cate-gory bins remain the same. The categories used were 0 (<1% bleached), 1 (1–10% bleached), 2 (10–30% bleached), 3 (30–60% bleached), and 4 (>60% bleached).
SST data
Spatial sea surface temperature (SST) data were derived from ad-vanced high resolution radiometer sensors aboard the NOAA14 and NOAA16 satellites at a spatial resolution of 1 km (Skirving and Guinotte 2001). Data were processed using the National Oceanic and Atmospheric Administration (NOAA) non-linear SST algorithm, which is designed to give an estimate of SST at a depth of 1 m (Barton 1995; Skirving et al. 2002). SST data used in this analysis for 1998 and 2002 covered the period 20 December to 7 March and included the austral summer and the warmest SSTs on the GBR. Data were averaged to give means for 25 consecutive 3-day periods. Data for 2002 appeared2–3C higher than for 1998 due in large part to calibration problems associated with the change from NOAA14 to NOAA16 satellites in November 2001. Because relative SSTs within years are the primary focus of this study, be-tween-year variation did not present a problem. Nevertheless, to enable a visual comparison of bleaching and SST patterns to be made between bleaching events, the 1998 and 2002 data sets were aligned by applying an offset based on weather station data.1
1In situ temperature data were collected using high-precision (0.02C) data loggers (Dataflow Systems) at 1- and 6-m depths at Magnetic Island and an automatic weather station at Davies Reef at 2-m depth. Logger and weather station sensors were calibrated/ corrected to an accuracy of ±0.1C.
Statistical analysis
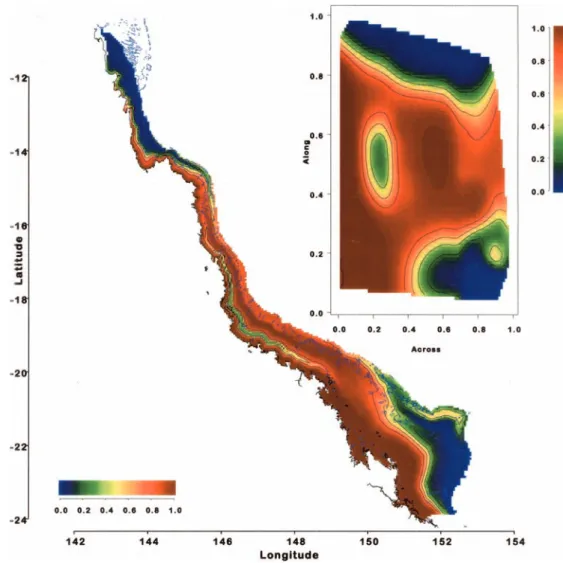
The presence–absence of bleaching in 1998 and 2002 was modeled in terms of temperature characteristics derived from the satellite SST data and spatial location. The latter was based on relative distance across and along the GBR (Fig. 1), in preference to lati-tude and longilati-tude. This coordinate system results in isoclines that are typically orthogonal or parallel to the physical structures and prevailing currents of the GBR. The directions of the isocline axes generally correspond to maximum (or minimum) rates of change of biophysical measures and, thus, more effectively account for changes in ecosystem properties (Fabricius and De’ath 2001). In this system, ‘‘inshore reefs’’ typically lie within the first 30% of the shelf width whereas ‘‘offshore reefs’’ typically lie within the last 70% of shelf width. Analyses were based on generalized additive models (Hastie and Tibshirani 1990). These models are an exten-sion of generalized linear models in that they can include smoothed relationships between the response and the predictor variables. Smoothers such as regression splines and local regression smoo-thers can be used, and this enables more general and complex relationships to be modeled. Together with variograms, these models were used to assess (1) the potential of the various tem-perature-based predictors; (2) the relationship between bleaching and non-temperature based predictors, such as relative distance across and along the GBR, year (1998 or 2002), and other cova-riates; and (3) the spatial correlation between bleaching events.
A number of SST-based variables were used to assess which one best predicted the 1998 and 2002 bleaching events. These included maxima and various quantiles of temperature distributions over periods varying from 3 days to 1 month. Measures of cloud cover
were also used based on counts of missing data observations in the SST data. Cloud cover is the most usual reason for these missing values. Other covariates were included in the predictive models including area, perimeter, geomorphological reef type (Hopley 1982), and depth of surrounding waters (Lewis 2001). Spatial correlation was modeled by including a Gaussian covariance term in the error component of all models.
The bleaching status was predicted for all GBR reefs in order to quantify overall bleaching levels for 1998 and 2002. This was necessary because many reefs surveyed in 1998 were not surveyed in 2002 and vice-versa. Predictions were made using nearest-neighbor-analyses. Based on cross validation, three nearest neighbors were most effective. Bleaching was predicted as a three-level response (none, moderate, heavy) and a two-level response (no/yes).
All analyses were conducted using S-Plus software (Statistical Sciences 1999).
Results and discussion
In-situ bleaching observations in 2002
Bleaching in 2002 was widespread and occurred in pat-ches over most of the 2,000-km length and 300-km width of the GBR. Environmental conditions were monitored throughout the summer. These data, together with those from field observations and anecdotal reports,
Fig. 1 Illustration of the
across–along coordinate system. The response variable modeled in terms of across– along is bleaching in 2002
confirmed that extensive in-situ bleaching was indeed occurring and helped optimize the timing of the aerial surveys (e.g., Berkelmans and Willis 1999). The first field evidence of coral bleaching in 2002 was noted on 7 January 2002 at Magnetic Island, an inshore reef in the central GBR off Townsville (Fig. 2). No corals were bleached 17 days earlier. On 7 January, species in ther-mally sensitive genera such as Acroporaand Montipora
had started to pale, but few if any colonies were white (C. Smith, personal communication). Water tempera-tures at this time had exceeded the 20-day threshold of 30.3C by 5 days and the 10-day threshold of 30.8C by 3 days (Fig. 3a; Berkelmans 2002). By 8 February, bleaching had intensified and up to 30% of hard corals on the reef crest were estimated to be white with another
50% pale. These bleaching observation are approxi-mately 3 weeks earlier than in 1998 at an equivalent bleaching intensity (Berkelmans and Oliver 1999).
At Davies Reef, a mid-shelf reef off Townsville, no appreciable bleaching was noted on 14 January 2002. Most pocilloporids and a few Acropora sp. colonies were slightly pale on top, but not more than the pig-ment reduction often noted in non-bleaching summers (e.g., Fitt et al. 2000). Water temperatures had been above 29.1C for 15 days, still 5 days short of the 20-day limit at this temperature (Fig. 3b; Berkelmans 2002). Six weeks later, on 28 February, approximately 10–15% of corals were assessed as white with another 60–70% pale in the lagoon. Bleaching on the reef front was less intense. Temperatures at this stage had
Fig. 2 Raw aerial survey results
of coral bleaching in 1998 and 2002 overlaid on the maximum 3-day SST for every pixel during the warmest austral summer months (December– March)
exceeded the 20-day threshold for this site by 10 days and the 10-day threshold of 29.5C by 1 day (Fig. 3b).
Satellite SSTs and correlation with bleaching
To investigate the relationship between bleaching and SSTs, it was first necessary to establish which satellite-derived SST variable best matched the observed bleaching patterns. Preliminary analyses showed the majority of information lay in the dichotomy of bleaching (bleaching categories 1–4) versus no bleaching (category 0). Subsequent analyses dealt only with pres-ence–absence of bleaching. Analyses based on general-ized additive models showed that the best predictor of presence–absence of bleaching for the years 1998 and 2002 was the maximum temperature over any 3-day period (max3d SST) in the ‘‘bleaching window’’ of mid-Dec to early March. The timing of max3d SSTs varied from location to location on the GBR with some reefs in the far-northern GBR experiencing the warmest tem-peratures in late December whereas reefs in the central
and southern GBR generally experienced the warmest temperatures in early-mid-February. Other SST-based predictors were assessed, including maximum and vari-ous quantiles of temperature distributions over periods varying from 3 days to 1 month (Table 1). High quan-tiles (>90%) over short to moderate periods (3–6 days) were typically the best predictors with little to choose between some of them. Several anomaly-based variables, based on deviation from fixed reference temperatures of 28, 29, and 30C with varying periods of time averag-ing, were also tried. These predictors generally per-formed less well, with accuracies of68–69% over short averaging periods (Table 1). ‘‘Degree-days’’ above thresholds of 28, 29, and 30C indicated that these variables were marginally worse than max3d SST (Ta-ble 1). Although the ‘‘hotspot’’ anomaly of Goreau and Hayes (1994) and Strong et al. (1997) and the ‘‘degree-heating-weeks’’ index of Gleeson and Strong (1995) could not be replicated due to calibration problems be-tween early and later years in our data set, our analyses do suggest that the ‘‘degree-heating weeks’’ index should perform better than ‘‘hotspots’’ (based on monthly means), simply because of the shorter time-averaging
Fig. 3 Temperatures and
timing of onset of bleaching at aMagnetic Island (Nelly Bay) andbDavies Reef in early 2002. Magnetic Island temperatures measured with an in-situ temperature logger and the mean calculated over a 10-year period with a 14-day smoothing function applied. Davies Reef temperatures from an automatic weather station and the mean calculated over a 15-year period with a 14-day smoothing function applied
Table 1 Summary statistics of
the accuracy of the four main classes of sea surface tempera-ture measures used in predicting the presence–absence of bleaching in 1998 and 2002 during the ‘‘bleaching window’’ mid-December to early March. Temporal averaging of pixels in two category ranges: 3–9 and 9–30 days % accuracy (±SD) % accuracy (±SD) Averaging period: 3–9 days Averaging period: 9–30 days 1. High temp: e.g., max., >90 percentile 73 (2) 64 (3) 2. Moderate temp: e.g., 50–90 percentile,
mean, median
66 (2)
3. Days above threshold: 28, 29, 30C 69 (3) 62 (4)
4. Degree-days above threshold: 28, 29, 30C 68 (3) 65 (4) 5. Spatial adjustment of temps by long-term
average to 1–4 above: average change in prediction )
period. In fact, a consistent feature of our analysis is that prediction accuracy deteriorated as the period lengths were increased. This suggests that short periods of high temperature are highly stressful to corals and are more likely to produce an unequivocal bleaching response than other SST indices.
Predictors were also adjusted for long-term SST averages (latitudinal gradient), but this did not improve the presence–absence predictions. This result was unex-pected. The bleaching curves of Berkelmans (2002) indicate that substantial latitudinal variation exists in
bleaching curves, suggestive of long-term adaptation in coral communities. However, two factors probably contribute to this lack of improved prediction. First, the bleaching curves indicate that at high temperatures and short exposures (e.g., 3 days), the latitudinal variation from the far northern to the southern GBR is <1 C, less than the amount of the spatial adjustment of long-term means (2C). Second, the presence–absence bleaching predictions in this study are essentially a function of the spatial structure in the SST data. This spatial structure essentially separates out ‘‘no bleaching’’
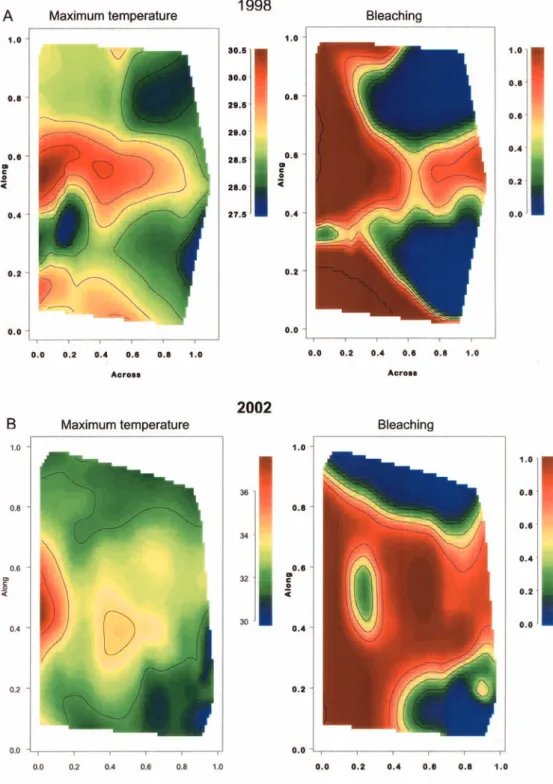
Fig. 4 Patterns of bleaching
and 3-day maximum
temperature (the best predictor of bleaching) fora1998 and b2002. The patterns are modeled with spatial smoothers based on relative distance across and along the reef, and do not take into account spatial correlation
in the blue areas (<28 C) from ‘‘bleaching’’ in the yellow/orange/red areas of the maps (>29.5 C, Fig. 2). These relatively large SST (and bleaching) differences occurred over small spatial scales (10 s km) in both the northern and southern GBR during 1998 and 2002, and, thus, mask any smaller systematic variation in bleaching thresholds from north to south.
The relationship between the presence–absence of bleaching and max3d SST did not depend on year (1998–2002) or location on the GBR. There was also no dependence of bleaching status on reef characteristics such as area, perimeter, type of reef, or depth of sur-rounding waters. Wooldridge and Done (2003) found that a weighted distance from the 100-m isobath (‘‘cost100’’) was a good predictor of bleaching using Bayesian Belief Networks. Since this is a proxy for the potential of mixing with cooler oceanic water, this may have been a better variable to include in the model than depth of surrounding water per se. Cloud cover was estimated by the missing pixels for 2002 (not possible for 1998 due to missing data from causes other than cloud). Although this looked promising with more cloudy days suggesting less bleaching, insufficient data from the 1998 data set were available to make a strong inference. As more data on cloud cover and perhaps other environ-mentally relevant parameters (e.g., turbidity, chloro-phyll, salinity, wind stress, etc.) become available during future bleaching events, further improvement in predic-tion of bleaching may be possible.
Based solely on max3d SST, 73.2% of reef status (bleached or not bleached) was correctly predicted. This compares with 56.7% by ‘‘informed guessing,’’ i.e., guessing all reefs bleached, and 50% by ‘‘blind guessing.’’ Thus, high-resolution (1 km)
satellite-derived SST data can provide a generally reliable spatial overview of the extent of bleaching during a ‘‘bleaching year.’’ These spatial overviews can be undertaken at the scale ‘‘reefs’’ or even below, which is the scale of most relevance to reef managers concerned with resource state and disturbance. Given an inter-nally consistent time-series of spatial data (i.e., accu-rate between years), the extent of bleaching can also be hind-cast from past years with relatively high confi-dence.
Bleaching patterns
As with 1998, inshore reefs in 2002 generally had higher levels of bleaching than offshore reefs. Reefs with >60% of coral cover bleached occurred predominantly inshore whereas only a few offshore reefs were classed in this category (Fig. 2). Modeling of these bleaching patterns with spatial smoothers based on relative distance across and along the reef (without accounting for spatial cor-relation) confirmed that there was a strong inshore– offshore effect in 1998 (Fig 4a) and a somewhat weaker one in 2002 (Fig. 4b). In both years, there was also a strong offshore bleaching pattern in the central GBR, with bleached reefs covering slightly more latitude in 2002 than 1998.
Apart from broad along and across similarities, there were also many smaller scale (10 s km) differ-ences in the bleaching patterns between 1998 and 2002. Reefs in the Princess Charlotte Bay area, for example, suffered major bleaching in 2002, but not in 1998. In contrast, many inshore reefs north of Princess Char-lotte Bay bleached in 1998, but not in 2002 (Fig. 2).
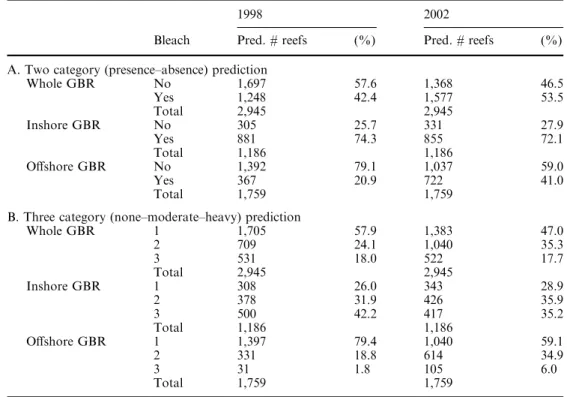
Table 2 Summary statistics
showing predicted levels of bleaching for 1998 and 2002 based on numbers of reefs inA two categories (presence-absence) andBthree categories (none-moderate-heavy). In the three-category predictions, category 1 = aerial survey category 0; category 2 = aerial survey categories 1 and 2; and category 3 = aerial survey categories 3 and 4
1998 2002
Bleach Pred. # reefs (%) Pred. # reefs (%)
A. Two category (presence–absence) prediction
Whole GBR No 1,697 57.6 1,368 46.5 Yes 1,248 42.4 1,577 53.5 Total 2,945 2,945 Inshore GBR No 305 25.7 331 27.9 Yes 881 74.3 855 72.1 Total 1,186 1,186 Offshore GBR No 1,392 79.1 1,037 59.0 Yes 367 20.9 722 41.0 Total 1,759 1,759
B. Three category (none–moderate–heavy) prediction
Whole GBR 1 1,705 57.9 1,383 47.0 2 709 24.1 1,040 35.3 3 531 18.0 522 17.7 Total 2,945 2,945 Inshore GBR 1 308 26.0 343 28.9 2 378 31.9 426 35.9 3 500 42.2 417 35.2 Total 1,186 1,186 Offshore GBR 1 1,397 79.4 1,040 59.1 2 331 18.8 614 34.9 3 31 1.8 105 6.0 Total 1,759 1,759
Similarly, the Capricorn Bunker Group in the southern GBR had major bleaching in 1998, but not in 2002. Also, a group of reefs in the southeast Swains Reefs area, protruding into the Coral Sea, showed moderate to heavy bleaching in 2002, but not in 1998 (Fig. 2). Thus, small-scale patterns are not consistent across years. The spatial correlation of bleaching between closely located reefs within years was moderately strong. Changes in patterns of bleaching occurred at scales of 10 s km, suggesting that reefs tend to bleach (or not) in spatial clusters. The scale of this spatial correlation was estimated in terms of relative distance across and along the reef. The correlation was negligible for reefs separated by >15% of the width
and/or length of the GBR. For reef managers, these results mean that there may be consistent broad-scale patterns between bleaching events with inshore reefs generally more susceptible to bleaching than offshore reefs. This may be due to the fact that shallow inshore waters generally exhibit greater extremes in tempera-ture during summer compared with offshore reefs, especially in bleaching years (Berkelmans 2001). However, at the scale of reefs or reef clusters, the cause of patchiness is more difficult to define. It may be simply due to variation in local weather conditions or a combination of weather, bathymetry, current patterns, and coral community type (e.g., Wooldridge and Done 2003).
Fig. 5 Three-level
(none-moderate-heavy) predictions of bleaching for all reefs ina1998 andb2002 based on nearest-neighbor classification. The size of each colored shape
represents actual drying reef area for each reef. Bleaching categories as for Table 2b
Quantitative comparison of 1998 and 2002
To enable a quantitative comparison of bleaching be-tween 1998 and 2002 on all GBR reefs to be made (not just those surveyed), the bleaching status of reefs was predicted as two-level (presence-absence) and three-level (none-moderate-heavy) responses. Error rates for two-level bleaching were10% and for three-level responses
19% for both 1998 and 2002. Over the whole GBR, approximately 54% of reefs bleached in 2002 compared to 42% in 1998 (Table 2, Fig. 5). Inshore reefs showed higher bleaching rates (>70%) compared to offshore reefs in both 1998 and 2002, many of them to high intensity (42% in 1998 and 35% in 2002). The major difference between events, however, is the occurrence of bleaching on offshore reefs with around 21% of offshore reefs bleached in 1998 compared with 41% in 2002. The incidence of high intensity bleaching on offshore reefs was also slightly greater with 6% of reefs in cate-gory 3 in 2002 compared with 2% in 1998. Thus, the 2002 bleaching event has eclipsed the 1998 event as the worst on record for the GBR.
Bleaching-rate predictions
An examination of the parameter estimates of the model provides insights into the sensitivity of reefs to climate change (Fig. 6). The simple probability model used in this analyses is:
P¼1=1þeðabxÞ
where bis the slope. Therefore,
Odds¼P=ð1PÞ ¼eðaþbxÞ
Thus, a change of 1 unit inxcorresponds to a change ofe(b)in the odds of a bleaching event occurring.
Since the slope of the regression in the models is 1.76 (Fig. 6), the odds of a reef bleaching increase by a factor of 5.8 (95% CI=2.7, 12.7) for each 1C increase in maximum temperature. Because50% of reefs bleached in 1998 and 2002, a 1C increase on 1998/2002 tem-peratures would raise the bleaching occurrence to 82%. Extending this further, a 2C increase would raise the proportion of bleached reefs to 97%, whereas a 3C increase would see 100% of reefs bleached. These pre-dictions may be conservative since the regression slope would be steeper if two outliers, representing reefs that had very high temperatures and bleaching, were re-moved from the model (Fig. 6). Alternative models that were smooth, rather than linear, and therefore ‘‘better’’ accommodated these two points, did not perform better overall. Therefore, although the two outliers do have high leverage, they do not have an undue effect on the model. These bleaching sensitivities are consistent with independent modeling approaches by Hoegh-Guldberg (1999) and Done et al. (2003) on future bleaching sce-narios that indicate that coral reefs are likely to be greatly impacted by climate change. Because average GBR temperatures are expected to rise by 1.2–1.9C by 2050 (Done et al. 2003, based on mid-range IPCC scenarios) and short-term (days–weeks) extremes will probably rise by more, substantial autonomous adap-tation/acclimatization of coral communities will be re-quired over the next few decades to avoid a highly depressed state of coral abundance by the middle of the 21st century.
In summary, this study contributes a greater understanding of coral bleaching patterns over small (km) to large (1,000 s km) scales covering two mass bleaching events on the GBR. These patterns are un-derpinned by high SSTs, some measures of which (e.g., max3d SST) can be used with relatively high accuracy to now- or hind-cast presence–absence of bleaching. Patterns of bleaching indicate that inshore reefs have so far been more vulnerable to bleaching than offshore reefs. While the 2002 bleaching event surpassed the previous worst bleaching event of 1998 on the GBR in terms of numbers reefs and intensity of bleaching, this may be nothing compared to bleaching and mortality levels we are likely to see when temperature extremes increase just 1 or 2C above current levels as our cli-mate warms.
AcknowledgementsWe gratefully acknowledge David Wachenfeld,
Paul Marshall, and Jessica Hoey for their role in documenting, synthesizing, and communicating the results of the 2002 bleaching event. We also thank Tim Phillips, the crew of the RV Lady Basten, and Queensland Parks and Wildlife Service for their assistance during field surveys. We are also grateful to Coast-watch (Australian Customs Service), their flight crews (Surveil-lance Australia P/L), and Day-to-Day Management (Queensland Parks and Wildlife Service and the Great Barrier Reef Marine
Fig. 6 Effect of maximum temperature on bleaching for 1998–
2002. Since the slope of the regression is 1.76, the odds of bleaching increase by a factor of e1.76=5.8 (95% CI=2.7, 12.7) for each degree increase in maximum temperature
Park Authority) for their cooperation in allowing the principal author to survey many reefs during their routine aerial patrols. The Great Barrier Reef Marine Park Authority funded the bal-ance of the aerial surveys. We are also indebted to Mike Ma-honey who shouldered the burden of processing the satellite SST images.
References
Andre´foue¨t S, Berkelmans R, Odriozola L, Done TJ, Oliver JK, Muller-Krager, FE (2002) Choosing the appropriate spatial resolution for monitoring coral bleaching events using remote sensing. Coral Reefs 21:147–154
Barton IJ (1995) Satellite-derived sea surface temperatures: Current status. J Geophys Res 100:8777–8790
Berkelmans R (2001) Bleaching, upper thermal limits and tem-perature adaptation in reef corals. PhD Thesis, James Cook University, Townsville
Berkelmans R (2002) Time-integrated thermal bleaching thresholds of reefs and their variation on the Great Barrier Reef. Mar Ecol Prog Ser 229:73–82
Berkelmans R, Oliver JK (1999) Large scale bleaching of corals on the Great Barrier Reef. Coral Reefs 18:55–60
Berkelmans R, Willis BL (1999) Seasonal and local spatial patterns in the upper thermal limits of corals on the inshore central Great Barrier Reef. Coral Reefs 18:219–228
Berkelmans R, Hendee JC, Marshall PA, Ridd PV, Orpin AR, Irvine D (2002) Automatic weather stations: tools for managing and monitoring potential impacts to coral reefs. Mar Technol Soc J 36:29–38
Dennis GD, Wicklund RI (1993) The relationship between envi-ronmental factors and coral bleaching at Lee stocking Island, Bahamas in 1990. In: Case histories for the colloquium and forum on global aspects of coral reefs: health, hazards and history, 1993, F15-F21
Done T, Whetton P, Jones R, Berkelmans R, Lough J, Skirving W, Wooldridge S (2003) Global climate and coral bleaching on the Great Barrier Reef. Final report to the State of Queensland Greenhouse Task Force, Department of Natural Resources and Mining, 33 pp, www.nrm.qld.gov.au/science/climate.html Drollet JH, Faucon M, Maritorena S, Martin PMV (1994) A
survey of environmental physico-chemical parameters during a minor coral mass bleaching event in Tahiti in 1993. Aust J Mar Freshwater Res 45:1149–1156
Fabricius KE, De’ath G (2001) Biodiversity on the Great Barrier Reef: large-scale patterns and turbidity-related loss of taxa. In: Wolanski E (ed) Biological–physical links: oceanographic processes on the Great Barrier Reef. CRC Press, Boca Raton Fitt WK, McFarlane FK, Warner ME, Chilcoat GC (2000)
Sea-sonal patterns of tissue biomass and densities of symbiotic di-noflagellates in reef corals and relation to coral bleaching. Limnol Oceanogr 45:677–685
Gleeson MW, Strong AE (1995) Applying MCSST to coral reef bleaching. Advance Space Res 16:151–154
Glynn PW (1993) Coral reef bleaching: ecological perspectives. Coral Reefs 12:1–17
Goreau TJ, Hayes RL (1994) Coral bleaching and ocean ‘Hot Spots’. Ambio 3:176–180
Hastie TJ, Tibshirani RJ (1990) Generalized additive models. Chapman and Hall, London
Hendee JC, Berkelmans R (2002) Expert System generated coral bleaching alerts for Myrmidon and Agincourt Reefs, Great Barrier Reef, Australia. Proc 9th Int Coral Reef Symp, Bali, 2000, vol 2, pp 1099–1104
Hoegh-Guldberg O (1999) Climate change, coral bleaching and the future of the world’s coral reefs. Mar Freshwater Res 50:839– 866
Hopley D (1982) The geomorphology of the Great Barrier Reef : Quaternary development of coral reefs. Wiley-Interscience, New York
Lewis A (2001) Great Barrier Reef Depth and Elevation Model: GBRDEM, CRC-Reef technical report #33, CRC Reef Re-search Centre, Townsville
Mayer AG (1914) The effects of temperature upon marine animals. Carn Inst Washington Pub Papers Mar Lab Tortugas, vol 6, pp 3–24
McField MD (1999) Coral response during and after mass bleaching in Belize. Bull Mar Sci 64:155–172
Shinn EA (1966) Coral growth-rate, an environmental indicator. J Paleontol 40:233–241
Skirving WJ, Guinotte J (2001) The sea surface temperature story on the Great Barrier Reef during the coral bleaching event of 1998. In: Wolanski E(ed) Oceanographic process of coral reefs: physical and biological links in the Great Barrier Reef. CRC Press, Boca Raton
Skirving WJ, Mahoney M, Steinberg CR (2002) Sea surface atlas of the Great Barrier Reef, 1990–2000. CD Rom, Australian Institute of Marine Science and the CRC Reef Research Center, Townsville
Statistical Sciences (1999) S-PLUS, Version 2000 for Windows, Seattle, a division of Mathsoft Inc., vols 1–4
Strong AE, Barrientos CS, Duda C, Sapper J (1997) Improved satellite techniques for monitoring coral reef bleaching. Proc 8th Int Coral Reef Symp, vol 2, pp 1495–1498
Winter A, Appeldoorn RS, Bruckner A, Williams EH, Goenaga C (1998) Sea surface temperatures and coral reef bleaching off La Parguera, Puerto Rico (northeastern Caribbean Sea). Coral Reefs 17:377–382
Wooldridge S, Done TJ (2003) Learning to predict large-scale coral bleaching from past events: a Bayesian approach using remotely sensed data, in-situ data, and environmental proxies. (in prep-aration)
Yonge CM, Nicholls AG (1931) Studies on the physiology of corals. IV. The structure, distribution and physiology of the zooxanthellae. Sci Rep Gt Barrier Reef Exped 1928–1929 1:135–176