Analysis of MAC-level Throughput in LTE Systems
with Link Rate Adaptation and HARQ Protocols
Raffaele Bruno
∗, Antonino Masaracchia
∗,†, Andrea Passarella
∗and Stefano Mangione
† ∗Institute of Informatics and Telematics (IIT)CNR, Pisa, Italy
Email:{name.surname}@iit.cnr.it
†Department of Electrical Engineering
Universit´a di Palermo, Italy, Email:{name.surname}@unipa.it
Abstract— LTE is rapidly gaining momentum for building fu-ture 4G cellular systems, and real operational networks are under deployment worldwide. To achieve high throughput performance, in addition to an advanced physical layer design LTE exploits a combination of sophisticated mechanisms at the radio source management layer. Clearly, this make difficult to develop analyt-ical tools to accurately assess and optimise the user perceived throughput under realistic channel assumptions. Thus, most existing studies focus only on link-layer throughput or consider individual mechanisms in isolation. The main contribution of this paper is a unified modelling framework of the MAC-level downlink throughput in LTE cells that caters for wideband CQI feedback schemes, AMC and HARQ protocols as defined in the LTE standard. We have validated the accuracy of the proposed model through detailed LTE simulations carried out with the ns-3 simulator extended with the LENA module for LTE.
I. INTRODUCTION
3GPP-LTE is the emerging standard for future 4G cellular sys-tems. To achieve high throughput performance, in addition to an advanced physical layer design LTE exploits a combination of sophisticated radio resource management functionalities, such as Channel Quality Indicator (CQI) reporting, link rate adaptation through Adaptive Modulation and Coding (AMC), and Hybrid Automatic Retransmission Request (HARQ) [1]. Specifically, a base station (eNB) can simultaneously serve multiple users on orthogonal subcarriers that are grouped into frequency resource blocks (RBs). Then, each user (UE) periodically measures channel state information that is fed back to the eNB in terms of CQI reports. Typically, only aggregate CQI values are reported to reduce channel feedback information. CQI measurements are used by eNBs for schedul-ing and link rate adaptation on the downlink [2]. For instance, the modulation and coding scheme (MCS) is typically selected in order to maximise the data rate to the scheduled UE subject to a constraint on the error probability. Errors at the physical layer are also mitigated by exploiting automatic retransmis-sion protocols with channel coding (HARQ). More precisely, HARQ procedures use the classical stop-and-wait algorithm, in which the eNB decides to perform a retransmission based on the exchange of ACK/NACK messages with the UE. Then, UEs try to decode the packet by combining the retransmitted copies.
Since user, cell and radio link throughputs are among the most important performance indicators that the operators adopt to asses the QoS in an LTE system [3], an extensive literature exists that investigates LTE throughput performance based on analytical models [4]–[6], simulation tools [2] or field tests [7], [8]. However, it is evident that a complex interplay exists among the various mechanisms that operate at the MAC layer to improve communication reliability and to increase data rates. This makes accurate LTE throughput analysis notably difficult. Thus, most studies limit the analysis only to the radio link throughput or consider single MAC functions in isolation [9]. Furthermore, simplified error models are typically considered that only allow deriving upper bounds for the LTE throughput [5].
In this paper we develop a unified modelling framework of the MAC-level downlink throughput that is valid for ho-mogeneous cells [10] and Rayleigh-distributed fading. Our model simultaneously caters for CQI feedback schemes that use spectral efficiency to generate CQI, as well as AMC and HARQ protocols. Furthermore, we include in the analysis an accurate link layer abstraction model that uses the Mean Mutual Information per coded Bit (MMIB) metric to derive the physical error probability [11]. The throughput estimates of our model are accurate, as validated using the ns-3 simulator extended with the LENA module for LTE1
. Furthermore, our results confirm that the IR-HARQ mechanism is very effective in improving error correction. However, the effectiveness of the IR-HARQ scheme depends on the appropriate selection of the modulation and coding scheme of the first transmission attempt.
After a brief review of the some related work (Section II) we introduce the LTE MAC model (Section III). Then, we develop our analytical method to calculate the MAC-level downlink throughput of LTE systems in the presence of Rayleigh fading (Section IV). We validate the analysis with simulation results in two general network scenarios (Section V), and we conclude this paper with final remarks and an outlook of future work (Section VI).
1http://networks.cttc.es/mobile-networks/software-tools/lena/
II. RELATEDWORK
As pointed out previously, several analytical and simulation models, as well as experimental studies, have been proposed for characterising the throughput performance of LTE systems. It is out of the scope of this section to provide an extensive overview of all these studies and we only focus on reviewing analytical models that are most related to this work.
Several works are reported in the literature that focuses on analysing the bit error probability (BER) for OFDM systems under various channel configurations and in the presence of channel estimation errors. For instance, in [12] closed-form expressions for the BER performance of equalised OFDM signals in Rayleigh fading are derived for various signal con-stellations. The analytical results of [12] are extended in [13] to calculate the BER of an OFDM system in the presence of channel estimation errors. In [14] the BER performance of uncoded OFDM systems are analysed for Rayleigh and Rice frequency-selective fading channels in the presence of trans-mitter nonlinearities. Significant research efforts have been also dedicated to generalise the BER performance analysis to multiple-input multiple-output (MIMO) channels [15]–[17].
Most related to our work are the studies that focus on analysing the capacity of LTE systems with scheduling, rate adaptation and limited channel-state feedback. In [5] an upper bound is derived for the achievable throughput in LTE sys-tems using the so-called “best-M” CQI reduction scheme and max-SNR user scheduling. Closed-form expressions for the throughput achieved in LTE systems under different schedulers (proportional fair, greedy, and round robin), multiple-antenna diversity modes and CQI feedback schemes are derived in [4], [18]. Specifically, the model in [4] applies to LTE systems that use EESM to generate CQI reports (an explanation of the EESM method is provided in Section III), while the model in [18] applies to LTE systems that generate CQI reports by simply taking an arithmetic average of the SNRs of the subcarriers. A SNR quantisation feedback scheme is also analysed in [6]. However, most of these papers assume a simplified model for the channel outage, which does not take into account HARQ procedures as specified in the LTE standard. The performance of HARQ with rate adaption for the LTE downlink is studied in [9], but only through simulations.
III. LTE MAC PROTOCOL SPECIFICATION
We now briefly describe relevant details of the LTE MAC for downlink transmissions, with special attention to frame structure, CQI feedback mechanisms and HARQ protocols. We also introduce the system model and notation, and we discuss the main assumptions that underlay our analysis.
In the downlink, LTE uses the Orthogonal Frequency Di-vision Multiple Access (OFDMA) scheme. Specifically, in the frequency domain the system bandwidth, W, is divided into several orthogonal subcarriers. Each subcarrier has a bandwidth of 15 kHz. In the time domain, the duration of one LTE radio frame is 10 ms. One frame is divided into ten transmission time intervals (TTIs) of 1 ms each. Furthermore, each TTI consists of two 0.5 ms slots. Each slot contains either
six or seven OFDM symbols, depending on the Cyclic Prefix (CP) length. A set of twelve consecutive subcarriers over the duration of one slot is called a physical Resource Block (RB). Then, OFDMA has the ability to dynamically assign RBs to individual users. Hereafter, we denote withqthe total number of RBs available over the system bandwidth.
Since the RB bandwidth is only 180 kHz, it is reasonable to assume that the channel response is frequency-flat across all the twelve subcarriers of the RB2. Then, let us denote withγi,k the SNR of theith RB of thekth UE. Clearly, the statistics of the SNR depend on the channel model and the multi-antenna diversity mode of operation. As commonly adopted in other LTE models, e.g. [4], in this study we assume that the fading from the eNB to the UEs isRayleigh distributed. This implies that the SNR of each RB is an exponential random variable (RV) [19]. Furthermore, we also assume anhomogeneous cell model [10], i.e. the SNR is independent for different users and RBs. This also means that the SNRs of all RBs are uncorrelatedin frequency and space, andγi,k can be regarded as independent and identically distributed (i.i.d.) RV.
Popular methods (e.g., EESM and MIESM) that are typi-cally used in LTE to compute CQI values rely on the concept ofeffectiveSNR. Basically, the UEs map the SNRs of multiple subcarriers/RBs into a single value by applying complex non-linear transformations. Then, the effective SINR is used to estimate the BLER experienced by a user and to determine the appropriate MCS, i.e. the MCS that allows the UE to decode the transport block with an error rate probability not exceeding 10%. However, the statistics of the effective SNR generated by EESM and MIESM techniques are not known in closed-form. Thus, they must be approximated or computed numerically, which makes performance analysis difficult [4], [20]. An alternative approach proposed in [21] to implement AMC capabilities is based on the spectral efficiency. Specifically, let us denote the with ηi,k the spectral efficiency of the ith RB of the kth UE. Then, it holds that [22]
ηi,k= log2 ! 1 + γi,k Γ " , (1)
where Γ=−ln(5β)/1.5 and β is BLER upper bound. Now a static mapping can be determined between the spectral efficiency and the CQI index, as well as between the CQI index and the MCS value [21]. More formally, let us denote with
Ci,k the CQI index for the ith RB of the kth UE. Typically the value of CQI can range between 1 and L. Then,Ci,k=j
(j = 1, . . . , L) if Sj ≤ ηi,k ≤ Sj+1, with S0 = 0 and
SL+1 = ∞. In other words the CQI value is a quantised
version of the spectral efficiency3. Closely related to the MCS
selection is also the transport block (TB) size determination. More precisely, let nk the number of RBs allocated to the 2This assumption will not hold for highly dispersive channels with long
delay spread.
3Note that in the 3GPP-LTE standard,L= 15and theS
j thresholds are specified in Table 7.2.3-1 of [23]. Furthermore, in the 3GPP-LTE standard the available MCS indexes are 32 but a 4-bit CQI allows selecting only 15 MCS. Thus, in practical LTE systems only a subset of available MCS is typically used.
B bits
data bits CRC bits B > Z
segmentation
24 CRC bits Filler (zero) bits
C output blocks
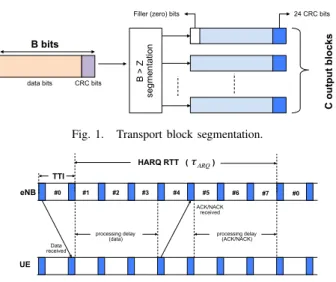
Fig. 1. Transport block segmentation. HARQ RTT ( )
processing delay
(data) processing delay (ACK/NACK) Data received ACK/NACK received TTI #0 #1 #2 #3 #4 #5 #6 #7 τARQ #0 eNB UE
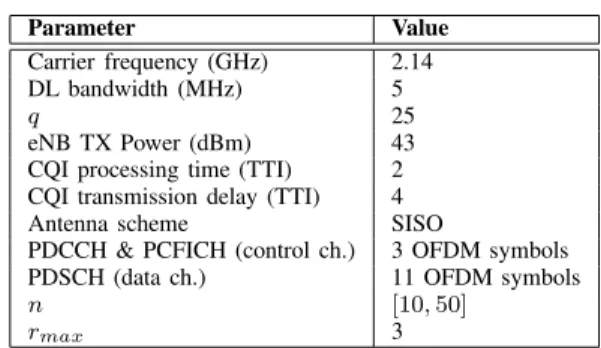
Fig. 2. HARQ processes and timing in FDD-LTE DL.
kth UE during a frame. Then, the numberB of bits that can be delivered in those RBs, which is called transport block, is a function of the MCS index4. Furthermore, if B > Z
(with Z = 6144 bits in 3GPP-LTE) the transport block is segmented into a number C of code blocks (CBs) that are independently encoded. Note that the CB size highly impacts the actual BLER performance for a given MCS [11]. Figure 1 exemplifies the transport block segmentation.
Regarding the HARQ protocol, LTE employs two types of HARQ schemes. In HARQ type-I, each encoded data frame is retransmitted until the frame passes the CRC test or the maximum number of retransmissions is reached. Erroneous frames are simply discarded. In contrast, in HARQ type-II, each transmission contains incremental redundancy (IR) about the data frame. Thus, consecutive transmissions can be com-bined at the receiver to improve error correction. Although our model is valid for all HARQ types, in the following we only consider HARQ type-II that is the most widely used in LTE. Note that in LTE systems retransmissions typically use the same MCS index as the initial transmission. It is also important to point out that the transmission of HARQ feedbacks (i.e. ACK/NACK messages) is not instantaneous but each received packet experiences a processing delay. According to the LTE standard, the processing delay at the receiver is about 3 ms. Thus, assuming the same delay to process data transmissions and ACK/NACK messages, the HARQ round trip time, say τARQ, is 7 TTIs, as shown in Figure 2. For this reason, an eNB must support up to 8 parallel HARQ processes for each UE to enableuninterrupted communications. In this way, an eNB can continue to transmit new TBs while the UEs are decoding already received TBs.
IV. MAC-LEVELTHROUGHPUTANALYSIS
In this section we develop the mathematical model of the MAC-level downlink throughput for a single LTE cell withn
4See Table 7.1.7.2.1-1 of [23] for the static mapping between TB size, MCS
and number of RBs allocated to the UE.
1 2 3 4 5 6 7 8 1 2 3 4 5 6 7 8 1 2 3 4 5 6 7 8 1 2 3 4 5 6 7 8 1 2 3 4 5 6 7 8 1 2 3 4 5 6 7 8 q RBs (1+τARQ)TTIs RBG = 2 RBs
Fig. 3. RR operations withq= 12,P= 2andn= 8.
randomly deployed UEs. Without loss of generality we assume asymptotic traffic conditions, i.e., infinite traffic is waiting for each user at the transmission buffer of the eNB. As discussed in Section III, the packet scheduler at the eNB is responsible for both allocating RBs to UEs every TTI, and controlling up to 8 HARQ processes per UE. Intuitively, the maximum number of HARQ processes that can be concurrently activated by the scheduler during an HARQ period is bounded by the number of times the same UE is scheduled during aτarqtime interval. For the sake of simplicity, in this study we consider a Round Robin (RR) scheduler, which works by dividing the total amount of available radio resources in a fair manner among the UEs. More precisely, a RR scheduler allocates to each UE a set of consecutive resource blocks, called resource block groups (RBGs), whose size P depends on the system bandwidth [23]. Consequently the number b of RBs assigned to each UE is simply given by
b= max#P,$q n
%&
. (2)
Without loss of generality we consider a non-adaptive HARQ strategy, in which the scheduler maintains the same RBG and MCS configuration of the original TB when scheduling the retransmissions.
To illustrate the dependency between the number of times a UE is scheduled during an HARQ period, the RGB size and the total number of UEs in Figure 3 we exemplify the scheduling decisions that are cyclically performed by the RR scheduler during an HARQ period with q = 12, P = 2and
n= 8. As shown in the figure, each UE is scheduled six times during an HARQ period. In general, the average number of times each UE is scheduled in (1 +τARQ) TTIs is simply given by
nRR=
q(1 +τARQ)
n·b . (3)
It must be noted that not all the transmission opportunities allocated by the eNB to an UE result into a successful transmission due to signal attenuation, shadowing and fading. In the following we denote with Pe(m, k, r) the TB error probability at the r retransmission for the kth UE when m is the adopted MCS, withPs(m, k, r)the probability that the
kth UE correctly decodes a TB after rretransmissions when
that the kth UE discards a packet when m is the adopted MCS because it has reached the maximum number of failed retransmissions. In Section IV-B we provide closed-form ex-pressions forPs(m, k, r),Pe(m, k, r)and Pd(m, k). Finally, to perform the throughput analysis we observe the system at the end of each successful transmission, because all the processes that define the occupancy pattern of the channel (i.e., HARQ processing delays and retransmissions) regenerate with respect to the sequence of time instants corresponding to the completion of a successful transmission. Then, it follows that the MAC-level throughput for thekth UE is
ρk=nRR
E[T B|Succ]k
E[TARQ]k , (4)
where E[T B|Succ]k is the average number of information bits that are delivered with a successful transmission of the
kth UE, and E[TARQ]k is the average time needed by an HARQ process to complete a successful transmission of the
kth UE. In equation (4), the multiplying factor n
RR is used to take into account that nRR independent HARQ processes run in parallel. The following theorem provides closed-form expressions forE[T B]k andE[TARQ]k.
Theorem 1: By assuming an homogenous cell with Rayleigh-distributed fading, and a RR scheduling policy
E[T B|Succ]k= L ' j=0 T BS(m(j), b) [1−Pd(m, k)]gk[j], (5a) E[TARQ]k= L ' j=0 (rmax ' r=0 (r+ 1)(1 +τARQ)Ps(m, k, r) ) gk[j], (5b) whereT BS(m(j), b)is a function that computes the number of data bits transmitted in bRBs using the MCS m(j)5, and
gk[j]is the PMF of the CQI value reported by thekth UE. Proof: See Appendix.
In the remaining sections we develop the analysis for the unknowns in (5a) and (5b).
A. CQI feedback scheme and AMC strategy
The objective of this section is twofold. First, we develop the analytical tools to characterise the wideband CQI feedback scheme of LTE. Second, we analyse the performance of a link rate adaptation techniques based on wideband CQI reports.
Let us assume that nUEs are randomly distributed in the cell, and letdkbe the distance of thekthUE from the eNB. As discussed in Section III we also assume thatγi,k∼Exp(λk), where the rate parameterλk of the exponential distribution de-pends on the UE position. Under this assumption the statistics of the spectral efficiency for each RB can be expressed in a closed-form as given by the following Theorem.
5For the sake of notation brevity, we indicate withm(j)the MCS that the
eNB uses when the CQI value reported by a UE is equal toj.
Theorem 2: If γi,k ∼ Exp(λk) then the cumulative dis-tribution function (CDF) of the spectral efficiency ηi,k in equation (1) is computed as:
Fη(x;i, k) =
*
1−e−λkΓ(2x−1) ifx≥0
0 ifx <0. . (6)
Proof: See Appendix.
LTE specifies different types of CQI reporting:widebandand subband. Specifically, the wideband CQI represents the SNR observed by the UE over the whole channel bandwidth, while the subband CQI represents the SNR observed by the UE over a collection of adjacent RBs. Note that a vector of CQI values should be transmitted to the eNB when using the latter feedback scheme. Thus, the subband-level feedback scheme ensures a finer reporting granularity but it also generates a higher overhead. In this study, we focus on the wideband feedback scheme and we assume that the CQI reported by the kth UE, sayC+
k is thearithmetic meanof the CQI values computed over all RBs6. Then, we use the spectral efficiency to generate the CQI values from the SNR measures of all RBs. The statistics of the wideband CQI are mathematically derived below.
Claim 1: The probability mass function (PMF) of the CQI value for the ith RB assigned to the kth UE is given by
gi,k[j] =Fη(Sj+1;i, k)−Fη(Sj;i, k). (7)
Proof: See Appendix.
Claim 2: In an homogenous cell the PMF of the wideband CQI value reported by thekth UE is given by
gk[j] =
q(j+1)−1
' l=qj
gk(q)[l], (8)
wheregk(q)[l]is the q-fold convolution ofgi,k[j]. Proof: See Appendix.
As described in Section III a static mapping is typically established between the CQI value received at the eNB and the MCS for the downlink transmissions. Thus, gk[j] also characterizes the distribution of the MCS index m(j) that is used by the eNB for the downlink transmission to thekth UE when the reported wideband CQI is j.
B. Physical layer error model
We now conclude the analysis by introducing the physical layer error model. In this study we adopt the general ap-proach initially proposed in [24] to accurately approximate the BLER curves of OFDMA-based wireless systems, and later specialised for the LTE case in [25]. Specifically, we assume that the mutual information per coded bit (MIB) of MCS m, as defined in [24], can be accurately approximated by a combination of Bessel functions of the SNRγas follows
Im(γ)≈
H ' h=1
αhJ(ψh√γ), (9) 6Note that an alternative solution would be to report the worst CQI value
whereH,αh andψhparameters are empirically calibrated as a function of the MCS index. Subsequently, the mean MIB (MMIB) value for each UE is computed by averaging the corresponding mutual information of all RBs allocated to that UE. Specifically, letΩ(k)be the set of RBs that are allocated to the kth UE by the scheduler. Then, the MMIB value over the vector of SNR values for each RB assigned to thekth UE whenm is the adopted MCS is simply given by
+ Im,k= 1 ω(k) ' i∈Ω(k) Im(γi,k), (10)
whereω(k)is the cardinality of theΩ(k)set. The non-linear nature of (9) makes an exact analysis difficult. Thus, previous studies limit the computational complexity of deriving MMIB values in multi-user scenarios by considering a quantised version of the Im(γ) function (9) in order to discretise the MIB metric [25]. More precisely, let us define a set Vm =
{µm[0], µm[1], . . . , µm[vm]}for each MCSm such that
µm[v] =Im(Qm,v), (11)
where (Qm,v+1−Qm,v) =δγ is the quantisation step size,
and Qm,0 is the minimum usable SNR for MCS m. Now,
let us denote with Hi,m,k the discrete MIB value for the
ith RB scheduled to the kth UE when m is the adopted MCS. Similarly to the approach adopted for CQI mapping, we assume thatHi,m,k=µm[v](v= 0, . . . , V) if Qm,v≤γi,k≤
Qm,v+1. In other words the discrete MIB value is associated
to arangeof SNRs. It is straightforward to derive the statistics of the discretised MIB metric as follows.
Claim 3: In an homogenous cell with Rayleigh-distributed fading, the PMF ofHi,m,k is given by
hi,m,k[v] =Fγ(Q(v+1),m;i, k)−Fγ(Qv,m;i, k), (12) wherehi,m,k[v] =P r{Hi,m,k=µm[v]}.
Proof: See Appendix.
Similarly, we introduce a discrete MMIB metric, say H+m,k, computed over the set of RBs allocated to the kth UE when
m is the adopted MCS. In particular,H+m,k can be obtained as the mean of theHi,m,k values over the setΩ(k). Thus, the statistics of the discretised MMIB value are derived using the same technique of Claim 2.
Claim 4: In an homogenous cell the PMF ofH+m,kis given by.
hm,k[v]≈ '
l∈Φv
h(i,m,kω(k))[l]. (13)
whereh(i,m,kω(k))[l]is theω(k)-fold convolution ofhi,m,k[l]. The definition of theΦv set is quite involved and is given in the proof.
Proof: See Appendix.
Once the MMIB value is given, a direct MMIB to BLER mapping can be used to obtain the code block error rate, without necessarily defining an effective SINR. Following the approach proposed in [24], the empirical BLER curve for MCS
mcan be approximated with a Gaussian cumulative model as follows CBLERm(y, e) =1 2 , 1−erf -y −be ce ./ , (14)
where y is the MMIB value, while be andce are parameters used to fit the Gaussian distribution to the empirical BLER curve7. These parameters depend on the Effective Code Rate
(ECR), i.e. the ratio between the number of downlink infor-mation bits (including CRC bits) and the number of coded bits. Intuitively, the ECR value is a result of the selected TB size, MCS, andΩ(k). Then, the overall error probability for a transport block transmitted as a combination ofCcode blocks, each one associated with a MMIB and ECR value, can be computed as T BLERm(y, e) = 1− C 0 i=1 (1−CBLERm(yi, ei)) . (15)
However equation (15) does not take into account the impact of an IR-HARQ mechanism that combines retransmissions to improve error correction. To generalise equation (15) for a sys-tem with incremental redundancy we adopt the same approach as in [26]. In particular, we introduce an equivalent MMIB metric as the average of the mutual informations per HARQ block received on the total number of retransmissions. More precisely, let us assume that the original transport block has been retransmittedrtimes. Then, let(I+m,k(0),I+m,k(1), . . . ,I+m,k(r))be the vector of MMIB values for each of these transmissions. The equivalent MMIB for the rth retransmission can be computed as follows + Im,k,r= 1 r+ 1 r ' i=0 + Im,k(i) , (16)
Then, the PMF of the equivalent MMIB value for therth re-transmission ish(m,kr) [v] =P r{I+m,k,r=µm[v]}. This PMF can be obtained using the same technique as in Claim 4 and it is not reported here for the sake of brevity. Similarly, we compute the effective ECR afterrretransmissions, saye(r), by dividing
the number of information bit of the original transmission with the sum of the number of coded bits of each retransmissions. Finally, by applying the law of total probability the average TB error probability at the r retransmission for the kth UE when mis the adopted MCS can be computed as
Pe(m, k, r) = vm ' v=0 T BLERm(µm[v], e(r)) ·h(m,kr) [v]. (17) Finally to evaluate Ps(m, k, r) we can observe that the rth retransmission of the kth UE, when m is the adopted MCS, is a success only if the previous (r−1) transmissions were TBs received erroneous and the rth transmission is correctly 7Empirical BLER curves can be obtained through field measurements or
decoded. Hence, it immediately follows that Ps(m, k, r) = (r0−1 i=0 Pe(m, k, i) ) ×[1−Pe(m, k, r)] . (18)
We conclude this section by noting that the probability
Pd(m, k) that the kth UE discards a packet when m is the adopted MCS because it has reached the maximum number of failed retransmissions is simple given by:
Pd(m, k) =
r0max
i=0
Pe(m, k, i). (19)
Finally, it is straightforward to observe that the average probability of discarding a packet for thekthUE is computed as Pd(k) = L ' j=0 Pd(m(j), k)gk[j]. (20) V. PERFORMANCEEVALUATION
In this section we assess the accuracy of our throughput analysis in two different scenarios. In the first one, we assume that the mapping function that is used to convert spectral efficiency into CQI feedbacks, and then into MCS indexes is sufficiently accurate. As better explained in the following, in this condition error probabilities are typically small and retransmissions may have a negligible impact on the MAC layer throughput with respect to other protocol overheads. In the second scenario we assume that a fixed CQI is fed back to the eNB by each UE. Thus, the eNB necessarily selects a fixed MCS independently of the current channel conditions. This clearly represents a worst-case scenario, which is useful to assess the robustness of our modelling framework even when the reported CQI provides a very poor prediction of channel performance. Furthermore, it is also useful to better highlight the ability of the HARQ scheme to improve the overall system throughput without relying on per-subcarrier information. A. Simulation setup
All the following experiments have been carried out using the ns3 packet-level simulator, which includes a detailed implementation of the LTE radio protocol stack. The main simulation parameters are summarised in Table I. Specifically, we consider an Urban Macro scenario, in which path loss and shadowing are modelled according to the COST231-Hata model [27], which is widely accepted in the 3GPP community. The fading is Rayleigh distributed. To limit the computation complexity of the simulator pre-calculated fading traces are included in the LTE model. Given the downlink system bandwidth (see Table I) a RBG comprises two RBs [23], i.e.,
P= 2. Regarding the network topology, we considered a single cell with a varying number of static UEs, chosen in the range [1,50]. Note that, in our settings a maximum number of 96 (i.e.,8⌊q/P⌋) unique UEs can be scheduled within an HARQ period. Indeed, if n > 96 the RR period is longer than the HARQ period. All results presented in the following graphs are averaged over multiple simulation runs with different fading
traces and topology layouts. Confidence intervals are generally very tight and they are not shown in the figures if below 1%. Each simulation run lasts 300 seconds.
TABLE I SIMULATION PARAMETERS Parameter Value Carrier frequency (GHz) 2.14 DL bandwidth (MHz) 5 q 25 eNB TX Power (dBm) 43 CQI processing time (TTI) 2 CQI transmission delay (TTI) 4
Antenna scheme SISO
PDCCH & PCFICH (control ch.) 3 OFDM symbols PDSCH (data ch.) 11 OFDM symbols
n [10,50]
rmax 3
B. Results with adaptive CQI
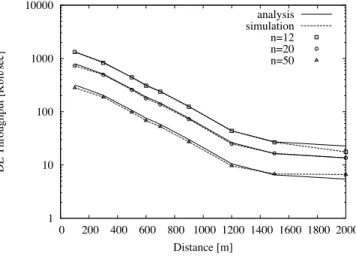
In this section we validate the accuracy of our modelling ap-proach by evaluating the throughput of an individual UE under varying channel conditions and congestion levels. Specifically, we assume that n UEs are randomly deployed in a cell and they are static. Then, an additionaltaggedUE is deployed at a known distancedfrom the center of the cell. Figure 4 shows a comparison between the model predictions and the simulation results for the MAC-level downlink throughput of the tagged UE versus its distance from the eNB and for different n
values. As a first important consideration, Figure 4 proves that our analysis provides a very accurate approximation of the MAC-level throughput independently of the fading intensity. Furthermore, the results confirm that increasing the total number of UEs in the cell has the effect of reducing in a proportional manner the throughput of the tagged UE. This is due to the fact that RR is a channel-unaware scheduler that performs fair sharing of time resources among UEs. Finally, it is also important to point out that the IR-HARQ mechanism is very effective in improving error correction. As discussed in Section III the modulation and coding scheme are selected in such a way that the error probability is well below 10%. As a matter of fact, our results (not shown here) indicate that the actual error probability for the first transmission attempt is below 5% up to a distance of 1000 meters, and the probability to perform more than one retransmission is negligible. C. Results with fixed CQI
In this second set of simulations we consider the same network scenario as in Section V-B. However, independently of the UE position the CQI feedback is assumed constant. Figure 5 shows a comparison between the model predictions and the simulation results for the MAC-level downlink throughput of the tagged UE versus its distance from the eNB whenn= 12. Note that twelve is the maximum number of UEs such that
nRR = 8. In other words, with n = 12 all the UEs are scheduled during one TTI and 8 HARQ process needs to be managed simultaneously. As expected a high value for the
1 10 100 1000 10000 0 200 400 600 800 1000 1200 1400 1600 1800 2000 DL Throughput [Kbit/sec] Distance [m] analysis simulation n=12 n=20 n=50
Fig. 4. Adaptive CQI: Comparison of analytical and simulation results for the MAC-level throughput of a tagged UE versus its distance from the eNB and the total number of UEs in the cell.
reported CQI results into the use of a very efficient MCS, which provides a high data rate at the cost of high vulnerability to channel fading. Consequently, the tagged UE obtains a high throughput when close to the eNB, but the throughput performance rapidly degrades as it gets farther from the eNB. On the contrary a low reported CQI provides a much more stable throughput performance due to the robustness of the selected MCS. However, in this case we must compromise between robustness and efficiency. To quantify this trade-off in Figure 6 we show the probability to discard a packet as given by formula (20) in the same network configurations of Figure 5. Interestingly, we can observe that there is a critical distance after which thePd(k)probability rapidly increases up to the value of one. Hence, after this critical distance even the IR-HARQ scheme becomes incapable of controlling the error probability. Furthermore, results in Figure 6(b) indicate that our model underestimates the actual Pd(k) for less reliable MCSs, while results in Figure 6(a) indicate that our model overestimates the actualPd for robust MCS.
VI. CONCLUSIONS
In this paper we have developed an analytical framework to estimate the MAC-level downlink throughput in a LTE system, which carefully models practical mechanisms of the MAC layer of the LTE technology. As a matter of fact, LTE systems achieve high communication reliability by adopting a combination of link adaptation and error correction schemes. This study is a first attempt to tackle the complexity of modelling the interplay between these mechanisms and to obtain a realistic evaluation of the throughput performance at the MAC level. Our results confirm that the IR-HARQ mechanism is very effective in improving error correction. However, the effectiveness of the IR-HARQ scheme depends on the appropriate selection of the modulation and coding scheme of the first transmission attempt.
Although there is still the need for detailed system-level simulations, we believe that the proposed analytical approach
0 200 400 600 800 1000 1200 1400 1600 0 200 400 600 800 1000 1200 1400 1600 1800 2000 DL Throughput [Kbit/sec] Distance [m] analysis simulation CQI=7 CQI=15
Fig. 5. Fixed CQI: comparison of analytical and simulation results for the MAC-level throughput of a tagged UE versus its distance from the eNB for different CQI values andn= 12.
0 0.1 0.2 0.3 0.4 0.5 0.6 0.7 0.8 0.9 1 0 200 400 600 800 1000 1200 1400 1600 1800 2000 Pd (k) Distance [m] analysis simulation (a) CQI=7 0 0.2 0.4 0.6 0.8 1 0 200 400 600 800 1000 1200 1400 1600 1800 2000 Pd (k) Distance [m] analysis simulation (b) CQI=15
Fig. 6. Fixed CQI: comparison of analytical and simulation results for the probability of discarding a packet for a tagged UE versus its distance from the eNB for different CQI values andn= 12.
will be useful to an LTE system designer for dimensioning the LTE system and configuring the optimal set of radio MAC parameters. Furthermore, there are several possible avenues of future research. Specifically, we are working to include in the analysis channel-aware scheduling strategies (e.g., the proportional fair scheduler), and additional radio resource management aspects of LTE (e.g., the ARQ retransmission functionality of the RLC layer). Finally, we also intend to generalise our analysis to incorporate correlation in frequency and space.
APPENDIX
Proof of Theorem 2: By definition, the CDF of the spectral efficiency in equation (1) is computed as
Fη(x;i, k) =P r{ηi,k≤x} (21) =P r#log2 ! 1 +γi,k Γ " ≤x& =P r#1 + γi,k Γ ≤2 x& =P r{γi,k ≤Γ(2x−1)} . Given thatγi,k∼Exp(λk)it follows that
Fη(x;i, k) =
1 Γ(2x−1)
0
λke−λkydy . (22) Solving the integral in (22) provides the formula in (6).
Proof of Claim 1: Following the procedure described in [21] to derive the CQI index from the corresponding spectral efficiency we can write that
gi,k[j] =P r{Ci,k=j} (23)
=P r{Sj ≤ηi,k≤Sj+1}
=P r{ηi,k≤Sj+1}−P r{ηi,k≤Sj}. By substituting (6) in (23) we obtain (7), and this concludes the proof.
Proof of Claim 2: The widband CQI for thekth UE is defined as follows + Ck= 2 1 q q ' i=1 Ck 3 . (24)
Let us denote withZk the sum of the CQI values for each RB, i.e.Zk=4qi=1Ci,k. Note thatZkis a discrete random variable and Zk ∈ [0, qL] since Ci,k ∈[0, L]. Let zk[j] be the PMF ofZk. it is a well-known results that the pdf of the sum of i.i.d. RVs is the convolution of the pdf of the constituent RVs. Thus, it follows thatzk[j] =g
(q)
k [j], i.e. theq-fold convolution ofgi,k[j]. Now we can write that
gk[j] =P r{C+k=j} (25) =P r 56 1 qZk 7 =j 8 =P r{qj ≤Zk< q(j+ 1)−1} = q(j+1)−1 ' l=qj P r{Zk=l}.
By substitutingg(kq)[l]in (25) we obtain (8), and this concludes the proof.
Proof of Claim 3: By definition Hi,m,k=µm[v] is Qm,v ≤ γi,k≤Qm,v+1. The probabilityhi,m,k[v]thatHi,m,kis equal toµm[v]is thus hi,m,k[v] =P r{Qm,v≤γi,k≤Qm,v+1} (26) = 1 Q(v+1),m Qv,m fγ(x;i, k)dx .
Solving the integral in (26) provides the formula in (12). Proof of Claim 4: Let us denote withZm,k=4i∈Ω(k)Hi,m,k. Thus,Zm,kis a discrete random variable which takes on any value equal to the sum of all possible ω(k)-combinations of theV elements in the setVm. Then, it holds that
+
Hm,k=
Zm,k
ω(k) . (27)
However, the analysis is complicated by the fact that the MMIB-to-BLER mapping is defined only over the discrete setVm. Thus, approximations are needed to map Zm,k/ω(k) onto one of theµm[v]values. First of all, we observe that the PMF ofZm,kis the convolution of the PMFs of the individual constituents becauseHi,m,k RVs are independent. Now, let us define withΦvthe set of all attainable values forZm,kthat are
betweenω(k)µm[v]andω(k)µm[v+1]. Then, we approximate the probabilityhm,k[v]thatHi,m,k is equal toµm[v]as
hm,k[v] =P r{H+m,k=µm} (28)
≈P r{µm[v]≤ Zωm,k(k) ≤µm[v+ 1]}
=' l∈Φv
h(i,m,kωk)[l].
In other words, in formula (28) the discrete MMIB value is associated to a range of values for the variableZm,k. Proof of Theorem 1: By exploiting the law of total probability we can write that
E[T B|Succ]k= L ' j=0 E[T B|Succ, M CS=m(j)] (29) P r{Succ|M CS=m(j)}P r{C+k=j} = L ' j=0 T BS(m(j), b) [1−Pd(m, k)]gk[j],
whereC+k is the CQI value reported by thekth UE. Similarly, by considering the HARQ protocol behaviours
E[TARQ]k = (30) = L ' j=0 E[TARQ|M CS=m(j)}]kP r{C+k=j} = L ' j=0 (rmax ' r=0 E[TARQ|M CS=m(j), nrtx=r}]k P r{nrtx=r|M CS=m(j),} 9 P r{C+k=j}.
By considering the HARQ timing as illustrated in Figure 2 it immediately follows that
E[TARQ|M CS=m(j), nrtx=r}]k = (1 +r)(1 +τARQ). (31) Finally, by substituting (31) in (30) we obtain (5b).
REFERENCES
[1] M. Rinne and O. Tirkkonen, “LTE, the radio technology path towards
4G,”Computer Communications, vol. 33, pp. 1894–1906, 2010.
[2] F. Capozzi, G. Piro, L. Grieco, G. Boggia, and P. Camarda, “Downlink Packet Scheduling in LTE Cellular Networks: Key Design Issues and a Survey,”IEEE Communications Surveys & Tutorials, vol. 15, no. 2, pp. 678–700, 2013.
[3] “Key Performance Indicators (KPI) for Evolved Universal Terrestrial Radio Access Network (E UTRAN): Definitions,” TS 32.450, Version 9.1.0 Release 9, June 2010.
[4] S. Donthi and N. Mehta, “An Accurate Model for EESM and its Application to Analysis of CQI Feedback Schemes and Scheduling in LTE,”IEEE Transactions on Wireless Communications, vol. 10, no. 10, pp. 3436–3448, October 2011.
[5] N. Varanese, J. Vicario, and U. Spagnolini, “On the Asymptotic Throughput of OFDMA Systems with Best-M CQI Feedback,”IEEE
[6] J. Leinonen, J. Hamalainen, and M. Juntti, “Capacity Analysis of Down-link MIMO-OFDMA Resource Allocation with Limited Feedback,”
IEEE Transactions on Communications, vol. 61, no. 1, pp. 120–130,
January 2013.
[7] A. Elnashar and M. El-Saidny, “Looking at LTE in Practice: A Perfor-mance Analysis of the LTE System Based on Field Test Results,”IEEE
Vehicular Technology Magazine, vol. 8, no. 3, pp. 81–92, September
2013.
[8] V. Buenestado, J. Ruiz-Aviles, M. Toril, S. Luna-Ramirez, and A. Mendo, “Analysis of Throughput Performance Statistics for Bench-marking LTE Networks,”IEEE Communications Letters, vol. 18, no. 9, pp. 1607–1610, September 2014.
[9] Z. He and F. Zhao, “Performance of HARQ With AMC Schemes In LTE Downlink,” inProc. of IEEE CMC’10, 2010, pp. 250–254. [10] M. Sharif and B. Hassibi, “On the capacity of MIMO broadcast
chan-nels with partial side information,” IEEE Transactions on Information
Theory, vol. 51, no. 2, pp. 506–522, February 2005.
[11] K. Brueninghaus, D. Astely, T. Salzer, S. Visuri, A. Alexiou, S. Karger, and G.-A. Seraji, “Link performance models for system level simulations of broadband radio access systems,” inProc. of IEEE PIMRC’05, 2005. [12] M.-X. Chang and Y.-T. Su, “Performance analysis of equalized OFDM systems in Rayleigh fading,” IEEE Transactions on Communications, vol. 1, no. 4, pp. 721–732, October 2002.
[13] P. Tan and N. Beaulieu, “Effect of channel estimation error on bit error probability in ofdm systems over rayleigh and ricean fading channels,”
IEEE Transactions on Communications, vol. 56, no. 4, pp. 675–685,
April 2008.
[14] P. Banelli, “Theoretical analysis and performance of ofdm signals in nonlinear fading channels,” IEEE Transactions on Wireless
Communi-cations, vol. 2, no. 2, pp. 284–293, March 2003.
[15] H. Bolcskei, D. Gesbert, and A. Paulraj, “On the capacity of OFDM-based spatial multiplexing systems,”IEEE Transactions on
Communi-cations, vol. 50, no. 2, pp. 225–234, February 2002.
[16] E. Lo, P. Chan, V. Lau, R. Cheng, K. Letaief, R. Murch, and W. Mow, “Adaptive Resource Allocation and Capacity Comparison of Downlink Multiuser MIMO-MC-CDMA and MIMO-OFDMA,” IEEE
Transac-tions on Wireless CommunicaTransac-tions, vol. 6, no. 3, pp. 1083–1093, March
2007.
[17] H. Li, G. Ru, Y. Kim, and L. H., “Ofdma capacity analysis in mimo channels,”IEEE Transactions on Information Theory, vol. 56, no. 9, pp. 4438–4446, September 2010.
[18] S. Donthi and N. Mehta, “Joint Performance Analysis of Channel Quality Indicator Feedback Schemes and Frequency-Domain Scheduling for LTE,”IEEE Transactions on Vehicular Technology, vol. 60, no. 7, pp. 3096–3109, September 2011.
[19] Z. Lin, P. Xiao, and B. Vucetic, “SINR distribution for LTE downlink multiuser MIMO systems,” inProc. of IEEE ICASSP’09, April 2009, pp. 2833–2836.
[20] H. Song, R. Kwan, and J. Zhang, “General results on SNR statistics involving EESM-based frequency selective feedbacks,” IEEE
Transac-tions on Wireless CommunicaTransac-tions, vol. 9, no. 5, pp. 1790–1798, May
2010.
[21] 3GPP, “Conveying MCS and TB size via PDCCH,” R1-081483, Septem-ber 2010.
[22] H. Seo and B. Lee, “Proportional-fair power allocation with CDF-based scheduling for fair and efficient multiuser OFDM systems,”IEEE
Transactions on Wireless Communications, vol. 5, no. 5, pp. 978–983,
May 2006.
[23] 3GPP, “Evolved Universal Terrestrial Radio Access (E-UTRA): Physical layer procedures (Release 9),” TS 36.213 V9.3.0, September 2010. [24] IEEE 802.16 Broadband Wireless Access Working Group, “Evaluation
Methodology for PAdvanced Air Interface,” IEEE 802.16m-08/004r2, 2008.
[25] M. Mezzavilla, M. Miozzo, M. Rossi, N. Baldo, and M. Zorzi, “A Lightweight and Accurate Link Abstraction Model for the Simulation of LTE Networks in Ns-3,” in Proc. of ACM MSWiM ’12, 2012, pp. 55–60.
[26] WiMAX Forum, “WiMAX System Evaluation Methodology,” V2.1, July 2008.
[27] COST Action 231, “Digital mobile radio future generation systems,” Final Report - EUR 18957, 1999.