Copyright by
Benjamin Patai Wing 2015
The Dissertation committee for Benjamin Patai Wing
Certifies that this is the approved version of the following dissertation:
Text-Based Document Geolocation and its Application to the
Digital Humanities
APPROVED BY
Dissertation Committee:
Supervisor:
Jason Baldridge Katrin Erk David Beaver Ray Mooney Matt LeaseText-Based Document Geolocation and its Application to the
Digital Humanities
by
Benjamin Patai Wing, A.B.; B.A.; M.A.; M.S.C.S.
Dissertation
Presented to the Faculty of the Graduate School of the University of Texas at Austin
in Partial Fulfillment of the Requirements for the Degree of
Doctor of Philosophy
The University of Texas at Austin
December 2015Acknowledgments
This dissertation could not have been completed without the generous help of my advisor, Jason Baldridge, as well as the constant encouragement and support of Jennifer Schneider, William Wing, Jacqueline Sharkey, Tamra Zehner, Diandra Ford and Grant DeLozier. Heartfelt thanks also go to the remaining committee members (David Beaver, Katrin Erk, Matt Lease, Ray Mooney) and to Nora England and Ben Rapstine of the Department of Linguistics.
B
ENJAMINP
ATAIW
INGThe University of Texas at Austin December 2015
Text-Based Document Geolocation and its Application to the
Digital Humanities
by
Publication No.
Benjamin Patai Wing, Ph.D. The University of Texas at Austin, 2015
SUPERVISOR: Jason Baldridge
This dissertation investigates automatic geolocation of documents (i.e. identification of their location, expressed as latitude/longitude coordinates), based on the text of those documents rather than metadata. I assert that such geolocation can be performed using text alone, at a sufficient accuracy for use in real-world applications. Although in some corpora metadata is found in abun-dance (e.g. home location, time zone, friends, followers, etc. in Twitter), it is lacking in others, such as many corpora of primary-source documents in the digital humanities, an area to which document geolocation has hardly been applied. To this end, I first develop methods for accurate text-based geolocation and then apply them to newly-annotated corpora in the digital humanities. The geolo-cation methods I develop use both uniform and adaptive (k-d tree) grids over the Earth’s surface, culminating in a hierarchical logistic-regression-based technique that achieves state of the art results on well-known corpora (Twitter user feeds, Wikipedia articles and Flickr image tags).
In the second part of the dissertation I develop a new NLP task, text-based geolocation of historical corpora. Because there are no existing corpora to test on, I create and annotate two new corpora of significantly different natures (a 19th-century travel log and a large set of Civil War archives). I show how my methods produce good geolocation accuracy even given the relatively small amount of annotated data available, which can be further improved using domain adapta-tion. I then use the predictions on the much larger unannotated portion of the Civil War archives to generate and analyze geographic topic models, showing how they can be mined to produce interest-ing revelations concerninterest-ing various Civil War-related subjects. Finally, I develop a new geolocation technique for text-only corpora involving co-training between document-geolocation and toponym-resolution models, using a gazetteer to inject additional information into the training process. To evaluate this technique I develop a new metric, the closest toponym error distance, on which I show improvements compared with a baseline geolocator.
Contents
Acknowledgments v
Abstract vi
Chapter 1 Introduction 1
1.1 Core theses . . . 3
1.2 Structure of a text-based geolocation system . . . 5
1.3 Toponym identification, toponym resolution and document geolocation . . . 10
1.4 Previous work . . . 12
1.5 Applications of document geolocation . . . 13
1.6 Application to digital humanities . . . 18
1.7 Outline . . . 22
1.8 Contributions . . . 23
Chapter 2 Data 27 2.1 Introduction . . . 27
2.2 Modern geolocation datasets . . . 28
2.2.1 Twitter datasets . . . 28
2.2.2 Wikipedia datasets . . . 30
2.2.3 Flickr datasets . . . 32
2.3.1 Western Wilds. . . 33
2.3.2 Official Records of the War of the Rebellion . . . 35
2.4 Toponym resolution datasets . . . 44
Chapter 3 Document geolocation models 47 3.1 Introduction . . . 47
3.2 Grid types . . . 48
3.2.1 Uniform grid . . . 48
3.2.2 Adaptivek-d tree grid . . . 49
3.2.3 City-based grid . . . 51
3.3 Grid construction . . . 52
3.4 Information retrieval models . . . 53
3.4.1 Training . . . 54
3.4.2 Kullback-Leibler divergence . . . 58
3.4.3 Naive Bayes . . . 59
3.4.4 Average cell probability . . . 60
3.5 Logistic regression . . . 60
3.6 Feature selection . . . 61
3.7 Hierarchical classification . . . 62
3.8 Simple baselines . . . 65
Chapter 4 Experiments on modern corpora 66 4.1 Experimental setup . . . 66
4.1.1 Configurations . . . 66
4.1.2 Evaluation metrics . . . 69
4.2 Results . . . 70
4.2.1 Small Twitter corpus . . . 70
4.2.2 Large Twitter corpora . . . 72
4.2.4 CoPhIR . . . 76
4.2.5 Summary and discussion . . . 77
4.3 Feature selection . . . 79
Chapter 5 Document geolocation for the digital humanities 81 5.1 Extending geolocation to historical corpora . . . 83
5.1.1 The applicability of domain adaptation . . . 84
5.1.2 Domain adaptation techniques . . . 86
5.2 Geolocation experiments on BEADLE . . . 87
5.2.1 Cross-domain geolocation . . . 88
5.2.2 Within-domain geolocation . . . 91
5.3 Geolocation experiments on WOTR . . . 94
5.3.1 Within-domain geolocation . . . 94
5.3.2 Cross-domain geolocation and domain adaptation . . . 99
5.4 Investigation of the data in theWar of the Rebellion . . . 102
5.4.1 Evaluating the unannotated portion using the annotated portion . . . 103
5.4.2 Other ways of evaluating full data . . . 104
5.5 Application of topic models toWar of the Rebellion . . . 113
5.5.1 Geographic distribution of topics in topic models . . . 118
5.5.2 Dynamic topic models . . . 124
Chapter 6 Document geolocation and toponym resolution 136 6.1 Introduction . . . 136
6.2 Toponym resolution techniques . . . 137
6.2.1 Baseline toponym resolution results . . . 139
6.2.2 New method WISTR∗(variant of WISTR) . . . 140
6.2.3 Variants of SPIDER . . . 141
6.3 Co-training . . . 142
6.3.2 Basic algorithm . . . 143
6.3.3 Interpolation . . . 146
6.3.4 Additional considerations . . . 147
6.3.5 Results . . . 149
Chapter 7 Conclusion 150 7.1 Further corpus annotation . . . 151
7.2 Improvements to the information-retrieval model . . . 152
7.2.1 Improvements in language-model creation . . . 152
7.2.2 Improvements in grid-cell selection . . . 154
7.2.3 Improvements in choosing a representative point in a cell . . . 155
7.3 Grid partitioning . . . 157
7.4 Geographic topic model improvements . . . 158
7.5 Statistical relations among document predictions . . . 159
7.6 Error analysis and significance testing . . . 160
7.7 Remaining issues and final thoughts . . . 161
Chapter 1
Introduction
Georeferencing, the relation between information and geographic location, is an important compo-nent of textual understanding (Hill, 2006). Georeferencing is extensively used in knowledge organi-zation, and geographic references are found throughout general conversion and writing (Buchel and Hill, 2009). It has been estimated that 50-80% of textual documents contain geographic references (Petras, 2004; Ridley et al., 2005). Automated georeferencing has become increasingly important in day-to-day life through the ubiquity of location-based services in many components of smart phones.
This dissertation focuses on one georeferencing task, that ofdocument geolocation, which locates an abstract document (a stretch of text, which may in reality be a paragraph, article, chapter, etc.) in geographic space. In other words, it identifies the location that forms the primary focus of each document—for example, identifying an article whose focus is on Austin, Texas with a lati-tude/longitude coordinate that represents the city (perhaps its geographic center or downtown area). This can be thought of as one way to summarize the geographic content of the document.
Figure 1.1 shows the kind of summary possible using document geolocation, plotting on a per-chapter level the paths followed in John Beadle’sWestern Wilds, and the Men Who Redeem Them, published in 1878 (§2.3.1). Each location corresponds to a paragraph and is labeled by the chapter in which it occurs (using a Roman numeral). Lines are drawn connecting adjacent
para-Figure 1.1: Plot of locations in Beadle’sWestern Wildslabeled by chapter, with lines connecting locations for adjacent paragraphs within a given chapter.
Figure 1.2: Plot of one interpretation of the paths and locations followed in Homer’sOdyssey, from Google Lit Trips.
graphs within a given chapter, with different colors for each chapter. This map is similar to the maps produced by the Google Lit Trips project1, as shown in Figure 1.2, which plots an interpretation of
the locations found in Homer’sOdyssey. Both are great teaching tools and serve as points of ref-erence for further discussion of entire historical worlds. The diffref-erence between the two is that the locations in the Odyssey map are subject to a great deal of interpretation and thus the map can only be drawn by hand, but the map ofWestern Wildscould potentially be drawn automatically using document geolocation, particularly in the presence of a carefully tailed sequence model (§7.5).
This dissertation focuses on document geolocation, in particular using a document’s text rather than its metadata.2 The motivation for this, including the core theses of this dissertation, is covered in §1.1. The structure of a text-based geolocation system is described in §1.2, and §1.4 discusses previous work in document geolocation. Further discussion of the applications of geolo-cation in general is found in §1.5, and appligeolo-cations to the digital humanities, a core component of the second half of this dissertation, are discussed in §1.6. Finally, §1.7 presents an outline of the rest of this dissertation.
1.1
Core theses
The primary thesis of this dissertation is thatgeolocation can be performed with accuracy suf-ficient for useful real-world applications by using only the text of a document, even without any available metadata associated with the document. Themetadataof a document is any in-formation associated with the document other than its raw text, e.g. hyperlinks to other documents, the social media profile of the author of the document in a social network, a user’s self-declared location, the set of other users connected to such an author through a friend or follower relationship, etc.
Metadata-based approaches can achieve great accuracy,3but are very specific to the
partic-1http://www.googlelittrips.com/GoogleLit/Home.html
2This dissertation is partly based upon Wing (2011); Wing and Baldridge (2011); Roller, Speriosu, Rallapalli, Wing and
Baldridge (2012); and Wing and Baldridge (2014).
3For example, Schulz et al. (2013) obtain 79% accuracy within 100 miles for a US-based Twitter corpus, compared with
ular corpus and the types of metadata it makes available. Twitter,4 for example, includes a great deal of metadata with its tweets, most of which is unavailable e.g. for Wikipedia documents.5 In
some domains, such as the digital humanities, documents are typically pure text, lacking any meta-data. Text-based approaches can be applied to all types of corpora; metadata can be additionally incorporated when available.
In the first part of this dissertation I present numerous methods for supervised text-based ge-olocation, including novel ones I have developed. These methods divide the Earth into a grid of cells, each covering a particular region, using either a uniform or adaptive (k-d tree) grid (Roller, Speriosu, Rallapalli, Wing and Baldridge, 2012). I then treat geolocation as a classification problem. In this case, the number of cells is often very large. This leads to another thesis of this dissertation, that geolocation as a classification problem can be successfully solved using discriminative methods despite having thousands or tens of thousands of classes. I do this using ahierarchical
classifi-cationmethod that I introduce, which achieves state-of-the-art results in text-based classification.
In the second part of this dissertation I investigate a particular use case of my methods, text-only historical corpora in the digital humanities (§1.6). By hand-annotating part of some dig-ital humanities texts, I show that, if even a fraction of the paragraphs of a document can be annotated with geographic coordinates, sufficient accuracy can be achieved to facilitate inter-esting real-world applications. I hand-annotated part of a 19th-century travel log and supervised the annotation of a portion of a major primary-source archive of Civil War documents (§2.3). I train models on this annotated data and use these models to label the remainder of the data, which allows for applications relevant to the digital humanities, such as geographic topic models (§5.5.1).
One way to increase the accuracy of predictions given a fairly small set of labeled data is through domain adaptation(Daumé III, 2007; Chen et al., 2011; Daumé III et al., 2010), incor-porating a model trained on a different (out-of-domain) corpus for which abundant labeled data is available (in my case, the English Wikipedia) in addition to or instead of the smaller amount of
in-domainlabeled data available. My experiments show that purely using Wikipedia with no in-domain
labeled data performs surprisingly well. Judiciously combining the two sources of labeled data
4http://www.twitter.com/ 5http://www.wikipedia.org/
can producelearning curves(curves showing performance over differing amounts of training data) that significantly outperform only in-domain datawhen only a small amount of in-domain data is available, and at least do no worse when a larger amount is available. This produces a curve that is flatter and with greater averaged accuracy over differing amounts of training data. Such curves can be computed dynamically while annotation is taking place to determine how much data needs to be annotated.
Another avenue I explore isusing document-geolocation techniques to inform and im-prove upon toponym resolution, expanding upon the work of Speriosu (2013). Among other things, I demonstrate a means of using co-training to simultaneously train a document geolocator and a toponym resolver on a combination of document-geolocated Wikipedia text and toponym-resolved Civil War text. The potential advantages of this method are great; as in other methods for joint inference, the two knowledge sources can inform each other, each with their own separate training data and each one potentially providing separate sets of constraints. (For example, some of Speriosu’s toponym resolution methods, such as SPIDER (§6.2), do joint inference over toponyms.) I produce improvements on a metric that generates a document-geolocation-inspired error distance from a set of toponym resolutions. In addition, I develop some new toponym-resolution techniques, variants on existing techniques which incorporate feedback from document-level annotations when it is available. It is hoped that this work will serve as a springboard for further research in the combination of document geolocation and toponym resolution.
1.2
Structure of a text-based geolocation system
Geocoordinates are real-valued latitude/longitude pairs, and thus theoretically geolocation should be treated as a regression problem. However, the function that needs to be predicted is highly complex and irregular, and for this reason it is common to discretize the Earth’s surface into grid cells, which allows the task to be treated as a classification problem. This is the approach followed in this dissertation, and it allows for geolocation techniques that fall under the rubric oflanguage
modeling approaches in information retrieval(Ponte and Croft, 1998; Manning et al., 2008). The
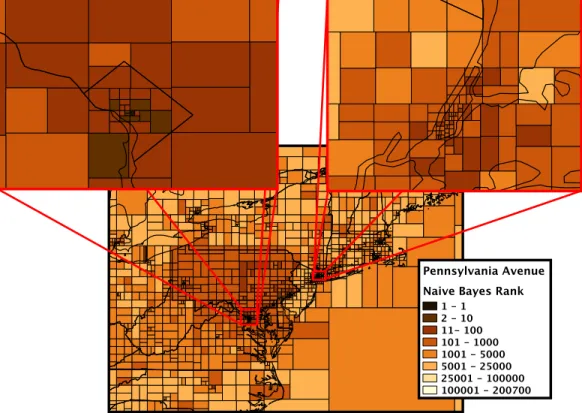
Figure 1.3: Ranking of a test document in a uniform 0.1◦grid. Relative Naive Bayes rank is shown for cells for test document Pennsylvania Avenue (Washington, DC)in ENWIKI13 (§2.2.2), sur-rounding the true location. (Constructed with assistance from Grant DeLozier.)
it. The set of training documents associated with a cell is concatenated into apseudo-document, and
thelanguage modelof this pseudo-document (i.e. the statistical description of the distribution of
words in the document) computed. The language model of the test document is likewise computed, and some method (e.g. Naive Bayes) is then used to compare the two, generating a score. The centroid of the highest-scoring cell is then chosen as the predicted location of the test document. Figure 1.3 shows an example of this process for a document in the English Wikipedia that describes Pennsylvania Avenue in Washington, DC.
The location that a document geolocation system associates with a document can be spec-ified at various levels of resolution, for example an exact point in space, an address, a city, or a higher-leveladministrative region(e.g. a state, province or country), and can be identified by name (i.e. in the form of atoponym), by latitude/longitude coordinate, or by a polygon of such coordi-nates. Such a polygon can be either in the form of abounding box(a rectangle in latitude/longitude space, identified by the coordinates of two opposite corners) or a more complex shape. It should be understood that the identification of a location by coordinates does not necessarily indicate that the level of resolution of this location should be taken as an exact point. For example, a document whose focus is on a state or other higher-level administrative region may nonetheless begeotagged
in a corpus with a point coordinate, typically chosen as either the geographic center, population cen-troid, or location of the seat of government. In this dissertation, I typically identify locations by point coordinates, but it should be understood that this can be problematic for large administrative regions (e.g. treating the United States as a point in Kansas or Washington, D.C.). An alternative, suggested by Speriosu (2013), is to treat administrative regions as sets of representative points derived from a
gazetteer(a list of named locations and associated coordinates), spanning the entire region.
Document geolocation makes the assumption that a document can be adequately associated with a singlelocation—akin to theone sense per discourseassumption commonly used in word sense disambiguation (Yarowsky, 1995). This is only a well-posed problem for certain documents, generally of fairly small size. Nonetheless, there are many natural situations in which such collec-tions arise. For example, a great number of articles in Wikipedia have been manually geotagged with a coordinate; this allows those articles to appear in their geographic locations while geobrowsing in
an application like Google Earth. Images in social networks such as Flickr6may be geotagged by a camera and their textual tags can be treated as documents. Likewise, tweets in Twitter are often geotagged, particularly when sent from a mobile phone in which the geotagging feature has been enabled. In this case, it is possible to view either an individual tweet or the collection of tweets for a given user as a document, respectively identifying the document’s location as the place from which the tweet was sent or the home location of the user (assumed to be nearby the tweets sent by that user). In the case of a long document, e.g. a book, the treatment normally used in this dissertation is to break up the document into chunks, either at the paragraph level or a fixed number of sentences in length (e.g. 10 or 20).
The document geolocation methods used in this dissertation break the Earth into ageodesic grid, i.e. a grid of cells that tile the Earth into regions. This allows geolocation to be treated as a type of classification problem, as discussed in §1.1. An algorithm is used to provide arankingof the cells based on the document being geolocated, and the top-ranked cell is used to predict the document’s location. In particular, the predicted location is thecentroidof the training documents in the cell, where the centroid is computed by separately averaging the latitudes and longitudes of the training documents. (This was shown by Roller et al. (2012) to be superior to using the geographic center, as was done in Wing and Baldridge (2011), because it better handles the situation where the training documents—and hence, by assumption the test document—are bunched near one of the edges of the cell in question.)
The ranking of a cell is determined by scoring each cell separately, comparing the language model of the test document with the language model of the concatenation of the training documents in a given cell. Simple unigram (bag-of-words) language models are generally used. (Experiments using bigram models performed by me and by Han et al. (2014), yielded little gain, but van Laere et al. (2014) was able to demonstrate improvements.) The technique used to compute the ranking may be Naive Bayes (Lewis, 1998), Kullback-Leibler (KL) divergence (Zhai and Lafferty, 2001), logistic regression (Hosmer Jr. and Lemeshow, 2004), a hierarchical classifier (Silla Jr. and Freitas, 2011), or other strategies.
In some situations, the actual scores of cells other than the top-ranked are used. For
ple, an alternative to simply using the centroid of the top-ranked cell as the predicted cell is to use
themean shiftalgorithm. The motivation is that the cells near the top in rank may tend to cluster
in a particular region whereas the top-ranked cell may happen to be located elsewhere; in this case the weight of evidence may be taken to be in favor of the cluster. (However, experiments I per-formed using mean shift did not produce improvements.) More generally, the set of scores of cells can be viewed as a probability distribution over the cells—an approximation to a continuous prob-ability distribution over the Earth. Some applications, for example some of the toponym-resolution techniques discussed in §6.2, make use of this entire distribution.
The layout of the grid is an important component of the document-geolocation process. Perhaps the simplest layout is auniform gridof cells, each of which forms a square in latitude-longitude space (for example, having 1◦ per side). Such squares are not all of equal area, because longitude lines move closer together as one moves away from the Equator towards either pole. Equal-area alternatives, such as thequaternary triangular mesh, have been considered (Dias et al., 2012). A different issue with uniform grids is that they over-represent rural areas at the expense of urban areas, which I handle through the use of an adaptivek-d grid(§3.2.2). Another alternative is to directly use a grid constructed from a gazetteer of cities (Han et al., 2014).
Measurement of the accuracy of a particular geolocation prediction can be done in various ways. A simple possibility, used by some researchers, iscell accuracy, i.e. the fraction of correctly predicted cells. However, this has the disadvantage that the metric cannot easily be used to compare different grid layouts, particularly with different-sized cells. I use alternative metrics based onerror
distance(the distance between the predicted and correct location), namelymeanandmedian. I also
useacc@161, the fraction of documents where the error distance is within 161 km (100 miles), from
Cheng et al. (2010) and approximating the concept of “within the same metro area”.
It is possible to do away entirely with a grid and directly model the continuous nature of the Earth’s surface. For example, Eisenstein et al. (2010) use Gaussian distributions and variational Bayes methods to model the locations of Twitter users in the United States of America. How-ever, there are two problems with this. One is that Gaussian distributions are unsuited to modeling spherical surfaces, which have no natural endpoints; instead, spherical distributions like the von
Mises-Fisher distribution (Dhillon and Sra, 2003) would need to be employed. More fundamentally, however, this and related works (Ahmed et al., 2013; Hong et al., 2012; Eisenstein et al., 2011b) have been tested only on quite small corpora, and there are serious questions as to whether the meth-ods can be scaled to large corpora of the sort I consider in this dissertation. Grid-based models, on the other hand, are simpler to construct and are known to have good performance over large datasets.
1.3
Toponym identification, toponym resolution and document
geolocation
Closely related to document geolocation aretoponym identificationandtoponym resolution. All three fall under the general rubric of georeferencing. It is important to understand how document geolocation differs from the other two, and why it is not sufficient to simply identify and resolve the toponyms in a text.
Toponym identification is the extraction of place names in text, such as identifying the place name “Springfield” and determining that it is, in fact, a place name rather than e.g. a personal name. This is normally viewed as a subtask ofnamed entity recognition(NER). Toponym resolution (Leidner, 2008; Yuan, 2010; Speriosu, 2013; Rupp et al., 2013) is the attachment of coordinates to place names, including the resolution of ambiguous place names, such as disambiguating the textual mention “Springfield” to the city of Springfield, Massachusetts.
Document geolocation is clearly related to toponym resolution in that both seek to resolve text to a location, but the scope is quite different. Toponym resolution often occurs with the aid of
agazetteer, which lists, for each ambiguous toponym, the possible locations that it can be mapped
to. The resolution step then boils down to a choice among fixed alternatives, making use of various sorts of context information such as the surrounding text or the possible or actual identities of other, nearby toponyms. (Muddying the waters somewhat is the fact that it is possible to do toponym resolution without a gazetteer, making use of document-level geolocation annotations, such as in DeLozier et al. (2015).)
forms the primary focus of an entire document. That document may well contain toponyms, which may be a strong hint as to the location of the document. Thus, toponym resolution could serve as an ancillary component of a document geolocation system. However, toponym resolution by itself is insufficient for document geolocation, both because there are often non-toponym words that are highly geographically indicative and because some or all of the toponyms in a text may not be near the actual location of the document.
The relation between them can be seen in the following text from John Beadle,Western
Wilds(§2.3.1):
From this region goes most of the lumber used along the road, as far asSalt Lake City; but over all that interior there is an ever increasing scarcity of good timber. Woods are found only upon the mountains; the inner plains of theGreat Basin are as bare of trees as if blasted by the breath of a volcano. At Verdi Station, 5,000 feet above sea-level, we pass the State line and enterCalifornia. Crossing theTruckee, we take an additional locomotive and enter upon the steepest ascent of theSierras. The first large curve brings us aboveDonner Lake, so named in memory of those unfortunate emigrants fromQuincy, Illinois, who here starved and froze and suffered away the long cold winter of 1846. Next we look down uponLake Bigler, and another hour brings us toSummit Station, highest point on the Central Pacific, 7,042 feet above sea-level, 1,669 miles fromOmaha, and 105 fromSacramento.
This text is discussing an area in the Sierra Nevada mountains of eastern California, along the Central Pacific railroad, but includes toponyms corresponding to several locations in the United States, some of which are directly relevant to the subject at hand and some of which are not, and some of which are ambiguous (e.g. “Truckee” and “Sacramento” are both towns and rivers, and there are in fact several places in the United States named “Omaha” and “Sacramento”).
Toponym resolution rather than whole-document geolocation is more common in real-world georeferencing tools, perhaps because document-level geolocation isn’t always a well-defined task for a given document, even when divided up into small chunks such as paragraphs. However, to the extent that it is applicable,I assert that document geolocation is more useful than toponym
resolution because of its ability to summarize the whole topic of the document (or document chunk) in one location.Examples of these summaries are found elsewhere in this dissertation; see, for example, Figure 1.1 and Figure 5.11.
1.4
Previous work
Early work on document geolocation used heuristic algorithms, predicting locations based on to-ponyms in the text (Ding et al., 2000; Smith and Crane, 2001). More recently, various researchers have used topic models for document geolocation (Ahmed et al., 2013; Hong et al., 2012; Eisen-stein et al., 2011b; EisenEisen-stein et al., 2010) or other types of geographic document summarization (Mehrotra et al., 2013; Adams and Janowicz, 2012; Hao et al., 2010). More recent work in doc-ument and/or user geolocation tends to make use of either the text of the docdoc-ument in the form of a language model—as this dissertation does—or metadata of various sorts, such as document links and social network connections. This research has sometimes been applied to Wikipedia (Overell, 2009; van Laere et al., 2013), Facebook (Backstrom et al., 2010) or Flickr (Serdyukov et al., 2009; O’Hare and Murdock, 2013), but more commonly to Twitter (see below). Some work involving domain adaptation has been done, such as applying data from Twitter to Flickr estimation (C. Hauff, 2012) and data from both Twitter and Flickr to Wikipedia (van Laere et al., 2014).
Much work on Twitter makes use of the extensive metadata provided with tweets and users, focusing on features such as time zone (Mahmud et al., 2012), declared location (Hecht et al., 2011), language identification (Graham et al., 2014), or a combination of these (Schulz et al., 2013). A recent, fruitful area of research has been the creation ofnetwork-basedmodels that make use of either the friends and followers (Compton et al., 2014; McGee et al., 2013; Sadilek et al., 2012) or the unidirectional or reciprocal @-mentions in tweets, i.e. cases where one user refers to another user in a tweet (Jurgens, 2013; Rahimi et al., 2015b). This makes the assumption that theego network
of users directly connected to a given user tend to be located nearby that user, an assumption that has been demonstrated in the case of mutual friend/follower relationships (Takhteyev et al., 2011; McGee et al., 2011). Using this assumption, a global distribution of locations can be computed using techniques such as label propagation (Talukdar and Crammer, 2009) and total variation minimization
(Rudin et al., 1992).
The primary alternative line of research, followed by this dissertation, focuses on text-based geolocation using language models. The overall structure of such a system is described in detail in §1.2. Earlier models (Wing and Baldridge, 2011; Serdyukov et al., 2009; O’Hare and Murdock, 2013) used Naive Bayes models over a uniform grid, which was then extended to an adaptivek-d grid (Roller, Speriosu, Rallapalli, Wing and Baldridge, 2012) and to the use of logistic regression (Wing and Baldridge, 2014; Han et al., 2014), and further to hierarchical logistic regression (Wing and Baldridge, 2014). An additional area of research has been the use of smoothing of neighbor-ing areas to increase geolocation accuracy, such as through kernel density methods (Hulden et al., 2015; Lichman and Smyth, 2014; Thom et al., 2012). van Laere et al. (2013) proposed a two-step process for geolocating Flickr images in which a language-model-based approach is followed by a similarity search within a given grid cell, greatly improving the accuracy. Current research involves the combination of network-based and language-model-based methods (Rahimi et al., 2015a).
1.5
Applications of document geolocation
Document-level geolocation has numerous applications. It is a critical component oflocation-based
services, which are concerned more generally with locating users of cell phones, social networks,
etc. and directing location-specific content to them, for example navigational directions; recommen-dations for local social events or restaurants (Quercia et al., 2010); directions to nearest businesses of various types; alerts of traffic, adverse weather, or local sales; person-to-person location services; and targeted advertisements. Other applications are possible as well given the ability to locate the source of a document in geographic space, e.g. trend detection of epidemic dispersion (Lampos et al., 2010; Paul and Dredze, 2011), earthquake prediction (Sakaki et al., 2010), or election forecasting (Tumasjan et al., 2010).
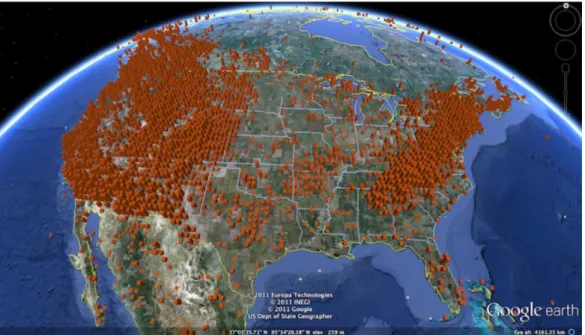
Numerous applications of document-level geolocation focus specifically on the text of the document in question. One major issue is the grounding of word meaning and language usage in geography. For example, distributions of words in geographic space can be generated using a method similar to the Average Cell Probability (ACP) inference algorithm (§3.4.4), as in Figure 1.4
Figure 1.4: Wikipedia distribution ofmountainin geotagged articles, plotted using Google Earth.
Figure 1.5: Geographic topics found in a food dataset based on geotagged, term-tagged images, from Yin et al., 2011.
Figure 1.6: Usage of vague geographic terms to refer to areas of Chicago, based on geotagged, term-tagged images from Flickr. From Hollenstein and Purves, 2010.
(Baldridge et al., 2012). These can be viewed as representations of word meaning complementary to the context-based vector space models of word meaning in distributional semantics (Erk, 2013). Topic models can also be adapted to geographic space, as in Figure 1.5 (Yin et al., 2011).
Geolocation, especially of social media, can also serve in sociological studies of word meaning and usage (Eisenstein et al., 2011a). Examples are the prevalence of different second languages across a metropolitan area (Mocanu et al., 2013) (Figure 1.7) or the extent of use of vague geographic terms such as “downtown” to refer to particular neighborhoods in a city (Hollenstein and Purves, 2010) (Figure 1.6).
Only about 2.02% of tweets are geotagged with a location, either a city or neighborhood chosen from a list (1.8%) or exact latitude-longitude coordinates (1.6%); these numbers do not add up to the total of 2.02% because many tweets have both types of geotags (Leetaru et al., 2013). Only 8.2% of all users in the period studied by Leetaru et al. produced any geotagged tweets, with over half sending only one geotagged tweet. This suggests that there is a great deal of room for automatic geolocation techniques that make use of other information.
As an example, Leetaru et al. describe a fairly simple algorithm to deduce a location from the free-form user-declared location in users’ profiles, along with related profile information. They claim this allows 34% of tweets to be geolocated, although only at the level of a user rather than
Figure 1.7: Prevalence of second languages in the New York metropolitan area, based on geotagged tweets. Blue = Spanish, Light Green = Korean, Fuchsia = Russian, Red = Portuguese, Yellow = Japanese, Pink = Dutch, Grey = Danish, Coral = Indonesian. From Mocanu et al., 2013.
an individual tweet. In practice, of course, there will be some loss of both precision and accuracy in such a technique compared with annotated tweet-level geotags, especially exact coordinates, al-though in this case the loss may be acceptable: a 0.72 correlation—generally considered high—is claimed between the new predicted locations and the annotated tweet-level geotags.
An additional factor arguing for automatic geolocation is that the set of geotagged tweets may not follow the same word/topic/etc. distribution as the overall set of tweets (Pavalanathan and Eisenstein, 2015). Tweets geotagged with exact coordinates come primarily from cell phones, as opposed to the various other ways of creating tweets (e.g. desktops, laptops, pads), and only when the cell phone user has explicitly enabled this feature, which is not on by default. This suggests that the average user producing geotagged tweets is more likely to use his/her cell phone as the primary means of digital communication and is less concerned about privacy than others. Together they point to young “digital natives”, and anecdotal investigations of geotagged tweets bear this out, with high-school students and Internet slang heavily represented (Pavalanathan and Eisenstein, 2015).
There are significant ethical issues involved in social media geolocation. This is especially the case with methods such as text-based geolocation that are capable of recovering a latent signal representing location that a user might want to hide but has no clear means of doing so. Geolocation techniques that rely on settings over which the user has control, such as explicit latitude/longitude geotags or a voluntarily provided location field, are less problematic, but there is often no way to defeat a text-based or network-based geolocation algorithm other than not to use social media at all. Most users in fact greatly value the privacy of their location (Junglas and Spitzmuller, 2005). Smith et al. (1996) identify four areas of privacy that usually trigger concerns in users:
1. the collection of personal information; 2. the unauthorized use of that information; 3. unauthorized access to that information; 4. errors in the information.
Item #2, unauthorized use, is the most worrisome per the authors, leading to negative outcomes ranging from mildly annoying (e.g. receiving spam) to potentially life-threatening. For this reason, it
is considered critically important to develop standards to protect the privacy of location information (McMullan, 2014). Various researchers have sought to develop such standards (Michael et al., 2008; Anuar and Gretzel, 2011; ISACA, 2011), but laws to enforce these standards are still in the process of being developed.7
1.6
Application to digital humanities
Millions of historical documents exist, and humanities researchers traditionally faced a prohibitive task doing large-scale analyses of such primary sources. As a result, they had to be content with close reading and analysis of a small set of carefully selected sources. However, the development of accurate optical character recognition (OCR) software, combined with computational data analysis techniques, has recently facilitated the development of the field ofdigital humanities(Burdick et al., 2012), allowing such large-scale analyses to be done. Geolocation can be of great assistance in quickly extracting and summarizing the geographic data available in such datasets, and in fact an entire field, known as thespatial humanities(Bodenhamer et al., 2010), has developed around the marriage of geographic information systems (GIS) and the digital humanities. The quantitative methods in this field have allowed for a revolution in the detailed and large-scale understanding of historical and literary phenomena that heretofore had resisted analysis. The techniques pursued in this dissertation are of particular interest to this field because the documents used in the field typically lack the metadata common to social media datasets, forcing geolocation to rely primarily or exclusively on the text itself.
Mapping has long been important to the humanities due to its ability to compactly repre-sent large amounts of data. In the mid 19th century, Charles Joseph Minard produced a series of such maps variously representing the movement of goods and people across Europe, including what “may well be the best statistical graphic ever drawn” (Tufte, 1986) — Minard’s famous 1869 map depicting Napoleon’s disastrous 1812 invasion of Russia (Figure 1.8). At the end of the 19th century, Charles Booth produced a famous series of maps of poverty and crime in London (Booth, 1902).
7In the United States, as of September, 2015 there are laws in various states to protect the privacy of location information
but no federal law, although congressional bills have been introduced to this effect, such as S. 237 and H.R. 491 in 2015, S. 2171 in 2014 and H.R. 983 in 2013.
Figure 1.8: Charles Joseph Minard’s famous 1869 map of Napoleon’s Russia Campaign. However, before the so-called “spatial turn” in the humanities beginning in the 1990’s (Guldi, 2009) that led to the emergence of the spatial humanities, such maps were difficult and time-consuming to produce. Recent years have seen an explosion of map-related research projects in the humanities (Cohen, 2011). Through mining historical texts, researchers have mapped topics as disparate as the spread and retreat of cholera and other diseases in 19th century Britain, as shown in Figure 1.9 (Murrieta-Flores et al., in press); the maritime transmission of Buddhism from India to China along trade routes (Lancaster, 2014); Robert E. Lee’s knowledge (or lack thereof) of troop movements during the Battle of Gettysburg (Knowles, 2013); the spread of accusations of witchcraft during the Salem witch trials of the late 1600’s (Ray, 2002); the reasons underlying the Dust Bowl of the 1930’s (Cunfer, 2008); and other issues. Current work is focused on moving beyond simply connecting GIS and the humanities to incorporate advances in computational linguistics (Gregory et al., 2013).
To aid the digital humanities, I have defined a new task—text-based historical-corpus docu-ment geolocation. For use with this task I annotated, or supervised the annotation of, two historical digital humanities corpora, a larger one (War of the Rebellion or WOTR, based on U.S. Civil War archives) and a smaller one (Western Wildsor BEADLE, a 19th-century travel log). These corpora come with careful annotations as well as a larger set of unannotated data from the same distribu-tion. I demonstrate good accuracy using the same methods I developed earlier in my dissertation,
achieving 72% accuracy with a median of less than 50 km error on WOTR, and 59% accuracy and less than 100 km median error on the smaller BEADLEdata set. I also investigate various types of domain adaptation using Wikipedia as an out-of-domain training corpus, and I show with learning curves the additional benefit that out-of-domain data yields.
Researchers in the digital humanities often make use oftopic models (Blei and Lafferty, 2009), particularly those derived usinglatent Dirichlet allocation(Blei et al., 2003). Topic models are automatically derived collections of statistically related words, where words that tend to co-occur in the same contexts are grouped together into “topics” that frequently (although not always) can be identified with a coherent, real-world subject. Topic models, when properly analyzed — often with the aid of well-designed visualizations — can reveal a great deal about the a data set. In §5.5, I compute topic models segmented in various ways by geography, which is possible through taking my geolocation models trained on the annotated portion of the data (possibly in conjunction with out-of-domain data in a domain adaptation setting), applying them to the full set of unannotated data (§2.3), and dividing up the unannotated text according to the predicted location. This allows me to computedynamic topic models(Blei and Lafferty, 2006) that show the change in topic membership of particular words over geography and/or over time, producing a detailed picture of differences in subject matter and approach over time and space. This in turn allows for careful variationist analysis to be performed (§5.5.2). The results reveal a mixture of expected and unexpected results, where the expected results can be used to calibrate the accuracy of the topic model and the unexpected results used to produce genuine new insights.
Finally, in Chapter 6 I develop a new text-based document geolocation method based on co-training between document-level annotations and toponym identification and resolution. This method works on text-only corpora, such as the digital humanities corpora described above, and allows me to introduce additional, outside domain knowledge (in the form of a gazetteer) while still remaining within a pure-text scenario. Co-training has many variants; I include careful analysis of the relative strengths and weaknesses of different approaches. I also develop and justify a metric for evaluating the success of my co-training algorithm.
1.7
Outline
Chapter 2 describes my sources of data, including three separate Twitter corpora (originally con-structed by Eisenstein et al. (2010), Roller et al. (2012) and Han et al. (2014)); recent processed dumps of the English, German and Portuguese versions of Wikipedia; the COPHIR corpus of tagged Flickr images (Bolettieri et al., 2009); the BEADLEcorpus derived from the 19th century travel log
Western Wildsby John Beadle, which I annotated myself; and WOTR, derived from the official
Civil War archives (War of the Rebellion), whose annotation I supervised. In addition, I describe three toponym-resolution corpora that are used for applying document geolocation techniques to toponym resolution.
Chapter 3 describes in detail the construction of a grid of cells and the supervised models used for document geolocation that are built on them. The cells can be constructed using either uni-form or adaptive (k-d tree) grids. The various models described include those based on information retrieval techniques, as well as higher-accuracy techniques that rely on logistic regression, either by itself or as part of a hierarchical process that uses multiple logistic-regression classifiers. I also implement a feature-selection technique based on information gain ratio (IGR), for comparison with Han et al. (2014).
Chapter 4 describes the experiments I carried out on the various modern corpora (from Wikipedia, Twitter and Flickr) and the results I obtained. Hierarchical classification is the clear winner, beating the other methods on all of the large corpora I evaluate. Flat logistic regression is also fairly effective and able to beat Naive Bayes on many of the corpora, while IGR works only on the Twitter corpora. Naive Bayes and KL divergence are of comparable performance.
Chapter 5 investigates applications of document geolocation to some 19th-century digital humanities corpora that I either annotated myself or supervised the annotation of. I show how my methods can be extended to work well in this context, with improved results obtained using domain adaptation with the English Wikipedia as an out-of-domain source of labeled data. I then take the predicted locations of the documents in the full set of Civil War documents (§2.3), group them according to membership in a set of hand-drawn “theater of war” regions, and apply dynamic topic models to these regions, which allows for careful, variationist analysis across the geographic and
temporal scope of the Civil War.
Chapter 6 describes experiments in informing toponym resolution with document-level ge-olocation, expanding upon the work of Speriosu (2013). I develop a means of using co-training to simultaneously train a document geolocator and a toponym resolver on a combination of document-geolocated Wikipedia text and toponym-resolved Civil War text. This allows me to jointly exploit the complementary knowledge contained in both sources of geographic information, including the outside knowledge contained in a gazetteer of toponyms and their possible resolutions.
Chapter 7 summarizes the work performed for this dissertation and further directions to take the research.
1.8
Contributions
This dissertation includes the following contributions to the field of natural language processing:
• An investigation of various effective methods for supervised geolocation of a test document, i.e. associating the document with a particular set of latitude/longitude coordinates on the Earth. I consider methods that divide the Earth’s surface into rectangular grid cells—either of constant degree size or using an adaptive k-d tree (Bentley, 1975)—and find the single best grid cell, relying exclusively on the text of a document. Many of these methods are simple to implement and fast to run, but give comparable accuracy to more complicated and slower Bayesian methods. These methods are fast enough to be scaled up to a large amount of training material, even with a fine-scale grid mesh, and easy to parallelize. Among these methods are Naive Bayes, KL divergence, Average Cell Probability (which involves inverting unigram distributions to determine a distribution of cells for a given word) and a few different baselines.
• An application and careful analysis of the performance of these methods, along with various smoothing techniques as well as the information gain ratio (IGR) feature selection technique of Han et al. (2014), to several different corpora: Three corpora of Twitter user feeds of dis-tinct natures; dumps of the English, German and Portuguese versions of Wikipedia, processed
by custom-written software; and a large set of image tags corresponding to geotagged Flickr images. I consider a number of different evaluation metrics and show that none of the ge-olocation techniques consistently outperforms Naive Bayes on all the corpora, including IGR, which performs well on the Twitter corpora for which is was designed, but not on the other corpora.
• The application of logistic regression to geolocation. Contrary to the claims of Han et al. (2014), I show that logistic regression can be more accurate than Naive Bayes and KL di-vergence (including variants incorporating feature selection) and fast enough to run on large corpora. Logistic regression itself very effectively picks out words with high geographic sig-nificance. In addition, because logistic regression does not assume feature independence, complex and overlapping features of various sorts can be employed.
• A new method for supervised geotagging, which involves a hierarchical discriminative classi-fier that creates multiple individual classiclassi-fiers at different grid resolutions and combines them to achieve better results than could be done using a classifier at a single level. This method scales well to large training sets and greatly improves results across a wide variety of corpora. In fact, I am able to achieve state-of-the-art results on all of the large corpora I evaluate on. Im-portantly, this is the first method that improves upon straight uniform-grid Naive Bayes on all of these corpora, in contrast withk-d trees (Roller et al., 2012) and the current state-of-the-art technique for Twitter users of geographically-salient feature selection Han et al. (2014).
• The development of a new NLP task,text-based document geolocation of historical corpora, to assist the application of document geolocation techniques to the digital humanities. I apply my techniques to two new corpora (see below), establishing a baseline for further research and showing how good accuracy can be achieved even with text-only documents and with relatively little training material. I further show how domain adaptation techniques that make use of the large amount of geographic annotation available in the English Wikipedia can dra-matically reduce the amount of annotated training data required to achieve equivalent levels of performance. I create learning curves to investigate the minimal amount of annotation
re-quired to achieve a given level of performance, to assist further researchers in deciding how much money and effort to spend on annotation.
• Two new annotated historical corpora for use with the new NLP task I developed (see above). These two corpora are of significantly different size and subject matter—a 19th-century Amer-ican travel log (Western Wildsby John Beadle) and a large set of primary-source documents from the American Civil War archives (War of the Rebellion). The annotations on the Civil War archives are in the form of polygons or multipoints when appropriate, allowing for more sophisticated analyses than can be achieved with typical single-point annotations. I put a sig-inificant amount of work into cleaning up the entire set of Civil War archives (not just the annotated portion) and dividing it into individual documents—some 255,000 in all, spread over 126 volumes. This alone should be of great benefit to digital humanities researchers in-terested in further work onWar of the Rebellion. All the data will be released publicly, along with the source code required to process the data and detailed instructions on how to operate it.
• A new technique for creatinggeographic topic models, based on David Blei’s dynamic topic models (Blei and Lafferty, 2006) and applied to the above Civil War archives. This involves identifying, using a domain expert, a set of regions corresponding to coherenttheaters of war. These are then linearized and treated similarly to the timeslices of a standard dynamic topic model. This has the effect of creating topics that vary over geography, allowing for broad-ranging variationist analyses to be performed.
• A new geolocation technique for text-only corpora involving co-training between document geolocation and toponym resolution, building on the toponym resolution methods previously investigated by Speriosu (2013). This has the effect of introducing external information into the process in the form of a gazetteer of locations, yielding the potential to significantly in-crease the geolocation accuracy beyond what can be extracted from the text alone. This demonstrates superior results on some metrics, and can serve as a branching-off point for further research in this area.
• A program that implements the methods described above.
• Processed versions of all the corpora I use for evaluation (to the extent this is legally possible), and programs for recreating them. (This includes the various modern and toponym-resolution corpora I make use of, not just the two new historical corpora I annotated.) Similarly processed versions from other sources can also be created (e.g. different dumps of Wikipedia, different sets of tweets). These programs are written in a modular fashion, so that the components that do various types of processing can be reused in other programs needing such processing, and new components can be created to do similar operations, e.g. as might be required to analyze the dump of a foreign-language Wikipedia.
Chapter 2
Data
2.1
Introduction
I work with a number of datasets annotated with document-level geotags (locations in the form of latitude/longitude coordinates).1I have nine such datasets available for evaluation — seven modern
(three of tweets, three of Wikipedia articles, and one of Flickr photos) and two historical (a single-book travel log and a multi-volume collection of Civil War archives). Of the modern corpora, one of the Twitter datasets is fairly small, but all of the others are much larger, consisting of at least several hundred thousand training instances. The two historical corpora were annotated manually and as a result consist of fewer annotations than the large modern corpora, but still differ significantly among each other in size. Two of the three Twitter datasets and the two historical datasets are primarily localized to the United States, while the remaining datasets cover the whole world. See Table 2.1 for a summary of the datasets.
For the toponym-resolution work described in Chapter 6, I also make use of various other datasets, which are generally not annotated with document-level geotags but usually do have indi-vidual toponyms annotated. This is documented more below.
1This chapter is partly based on Wing (2011), Wing and Baldridge (2011) and Wing and Baldridge (2014). Jason
Dataset Corpus Document Scope #Docs #Tweets #Types #Tokens #Tokens Source Source (Training) (Total) (Training) (Training) /Doc
GEOTEXT Twitter User feed US 5.69K 378K 114K 1.58M 277.3
TWUS Twitter User feed US 430K 38M 4.75M 244M 568.8
TWWORLD Twitter User feed World 1.37M 12M 95.4K 41.8M 30.6 ENWIKI13 English Wikipedia Article World 691K — 4.32M 174M 251.7 DEWIKI14 German Wikipedia Article World 259K — 4.09M 129M 497.5 PTWIKI14 Portuguese Wikipedia Article World 105K — 608K 18.4M 175.3 COPHIR Flickr Single image tags World 2.27M — 629K 20.5M 9.04
BEADLE Western Wilds Paragraph US 244 — 6.16K 16.6K 67.8
WOTR War of the Rebellion Article US 4008 — 25.9K 526K 131.3 Table 2.1: Summary of datasets with document-level geotags used in the dissertation. Note that type and token counts exclude stopwords, and TWWORLDwas pre-filtered to exclude non-alphabetic words, words shorter than 3 characters in length and words occurring less than 10 times in the entire corpus.
2.2
Modern geolocation datasets
2.2.1
Twitter datasets
This dissertation uses a number of datasets collected from Twitter. These datasets are taken from tweets collected using one of the public streaming API’s. Some of these API’s yield a sample of all publicly-available tweets created (e.g. the Spritzer and Gardenhose API’s). Others allow for tweets to be searched using particular characteristics; for this dissertation, tweets were requested that were geotagged with a specific latitude/longitude coordinate, generally derived from a GPS device embedded in the cell phone used to send the tweet.
Because tweets are so short (at most 140 characters), documents serving as training in-stances are constructed by amalgamating the tweets of a given user. The location of a user is deemed to be the earliest tweet with specific, GPS-assigned latitude/longitude coordinates. This choice fol-lows Eisenstein et al. (2010). It is possible that other methods (e.g. choosing the centroid of all available coordinates) may prove to be more appropriate.
An additional issue to be considered is that the distribution of tweets created by users who post to Twitter through cell phones and allow tweet geotagging may not be the same as the overall distribution. For example, casual inspection reveals that these are generally young users, often in high school, who use a great deal of Internet slang (see example below).
The following is an example of some tweets from a particular user (with references to other users anonymized):
Date/time Coordinates Text 2010-03-03T02:02:04 40.2015,-74.806535 Watching LOST 2010-03-03T12:01:41 40.221968,-74.734795 @USER_89a3500b i did
2010-03-03T20:06:19 40.221968,-74.734795 Maneuver so that I can put my team on, hopefully sooner so that we can live our dreams on 2010-03-03T23:30:45 40.221333,-74.732688 Darko was eating hamburgers in the locker room before they played the knicks. Lol 2010-03-04T02:58:43 40.220681,-74.758761 Girl pack ya bags i’m bout to take you on a ride!
2010-03-04T15:26:50 40.194523,-74.756427 @USER_a9cf8f82 lol, yeah check it out bro
2010-03-04T20:03:07 40.289891,-74.678256 RT @USER_5eae722d: #inhighschool me & Mr. Stavisky dnt lk each other, his breath smelled lk straight ass! - lmao he use 2 chase us dn the hall
2010-03-04T23:57:58 40.221968,-74.734795 #inhighschool trenton high girls basketball team always had the best record out of all the highschool sports teams. Nothing has changed
2010-03-05T00:17:13 40.221968,-74.734795 The cheerleading team need Mrs. Grady back
2010-03-05T00:39:56 40.221968,-74.734795 This girl Ashley Hines from is a beast. They can’t stop her
2010-03-05T01:02:32 40.221968,-74.734795 Da High always had the best fans. Going way back before I was #inhighschool ...
The same user, with tweets amalgamated and converted to a unigram distribution, appears as follows:
USER_6197f95d 40.2015,-74.806535 had:4 everybody:1 we:1 bub:2 funk:1 lights:1 u:1 said:1 he:3 who:1 to:6 of:1 lol:3 she:1 knicks:1 pack:1 room:1 played:1 nothing:1 #inhighschool:3 bags:1 ride:1 &:1 mr:1 be:2 changed:1 any:1 or:1 is:3 i’m:2 if:1 reopen:1 up:2 can’t:1 that:5 eating:1 darko:1 dreams:1 our:1 live:1 sooner:1 hopefully:1 team:3 did:1 locker:1 hamburgers:1 needs:1 union:1 repaired:1 hurry:1 ewing:1 da:1 looking:2 pause:1 down:2 dj:3 life:1 does:2 all:2 see:1 from:1 has:1 2:1 em:1 bro:1 they:2 one:1 so:3 and:1 oh:1 new:2 freezer:1 watching:1 lost:1 ass:1 yo:2 there:1 maneuver:1 put:1 looks:1 cheer:1 sound:1 approach:1 caution:1 burger:1 hit:1 jack:1 daniels:1 stop:1 liquor:1 credit:1 hard:1 best:2 ...
GEOTEXTis a small dataset consisting of 377,616 tweets from 9,475 users tweeting inside of a bounding box consisting of the 48 American states (and some parts of Canada and Mexico), compiled by Eisenstein et al. (2010). It was compiled from tweets collected using the Gardenhose API during the first week of March 2010. Tweets without geotags (GPS-assigned latitude/longitude coordinates) were discarded, as were users with fewer than 20 geotagged tweets. Also discarded were users following or followed by 1,000 or more other users, in order to eliminate marketers, celebrities, news media sources, etc. (Kwak et al., 2010).
TWUS is a dataset of tweets compiled by Roller et al. (2012), designed to address the sparsity problems resulting from the small size of GEOTEXT. Tweets were collected using both the Spritzer and location-search API’s over the period from September 4 to November 29, 2011.
Filtering and amalgamation were done similar to GEOTEXT. However, tweets without geotags were not discarded; instead all users with at least one geotagged tweet were considered. (This may have the effect of lessening somewhat the potential distribution mismatch between geolocated and non-geolocated tweets.) The resulting dataset contains 38M tweets from 450K users, of which 10,000 each are reserved for the development and test sets.
TWWORLDis a dataset of tweets compiled by Han et al. (2012). It was collected using the Spritzer API over the period from September 21, 2011 to February 29, 2012 and differs from TWUS in that it covers the entire Earth instead of primarily the United States, and consists only of geotagged tweets. Non-English tweets and those not near a city were removed, and non-alphabetic, overly short and overly infrequent words were filtered. The resulting dataset consists of 12M tweets from 1.4M users, with 10,000 each reserved for the development and test sets. Note that, even though this dataset contains more users than TWUS, it consists of fewer tweets, meaning that the average document size is significantly smaller (8.6 tweets/user, vs. 84.4 tweets/user for TWUS).
2.2.2
Wikipedia datasets
As of November 2014, Wikipedia has some 34.0 million content-bearing articles in 241 language-specific encyclopedias.2 Among these, 52 have over 100,000 articles and 12 have over 1 million
articles, including 4.8 million articles in the English-language edition alone. Wikipedia articles generally cover a single subject; in addition, most articles that refer to geographically fixed subjects
aregeotaggedwith their coordinates. Such articles are well-suited as a source of supervised content
for document geolocation purposes. Furthermore, the existence of versions in multiple languages means that the techniques in this paper can easily be extended to cover documents written in many of the world’s most common languages.
Wikipedia’s geotagged articles encompass more than just cities, geographic formations and landmarks. For example, articles for events (like the shooting of JFK) and vehicles (such as the frigate USSConstitution) are geotagged. The latter type of article is actually quite challenging to geolocate based on the text content: for example, though the USSConstitutionis moored in Boston,
most of the page discusses its role in various battles along the eastern seaboard of the USA. However, such articles make up only a small fraction of the geotagged articles.
For the experiments in this paper, we used full dumps of versions of Wikipedia in three different languages:3
1. English (ENWIKI13) from November 4, 2013, with 864K geotagged articles out of 4.44M total
2. German (DEWIKI14) from July 5, 2014, with 324K geotagged articles out of 1.71M total
3. Portuguese (PTWIKI14) from June 24, 2014 131K geotagged articles out of 817K total These dumps include not only the content-bearing articles but various types of special-purpose ar-ticles used primarily for maintaining the site (specifically, redirect arar-ticles and arar-ticles outside the main namespace), which were filtered out. For example, although the English Wikipedia version mentioned above has 4.44M content-bearing articles, the dump actually has 14.0M articles in it— i.e. almost 10M of the articles in the dump are special-purpose, non-content-bearing articles.
It is necessary to process the raw dump to obtain the plain text, as well as metadata such as geotagged coordinates. Extracting the coordinates, for example, is not a trivial task, as coordi-nates can be specified using multiple templates and in multiple formats. Automatically-processed versions of the English-language Wikipedia site are provided by Metaweb,4 which at first glance
promised to significantly simplify the preprocessing. Unfortunately, these versions still need signifi-cant processing and they incorrectly eliminate some of the important metadata. In the end, we wrote our own code to process the raw dump, involving about 4,600 lines of Python code and 1,200 lines of shell script. It should be possible to extend this code to handle other languages with little diffi-culty. (An alternative strategy, perhaps better in hindsight, would have been to download and run the MediaWiki software used to process the Wikipedia article source code into HTML, and parse the resulting HTML.) See Lieberman and Lin (2009) for more discussion of a related effort to extract and use the geotagged articles in Wikipedia.
3http://download.wikimedia.org/ 4http://download.freebase.com/wex/
The entire set of articles was split 80/10/10 in round-robin fashion into training, develop-ment, and testing sets after randomizing the order of the articles, which preserved the proportion of geotagged articles.
2.2.3
Flickr datasets
COPHIR (Bolettieri et al., 2009) is a large dataset of images from the photo-sharing social net-work Flickr. It consists of 106M images, of which 8.7M are geotagged. Most images contain user-provided tags describing them. I follow algorithms described in O’Hare and Murdock (2013) in order to make direct comparison possible. This involves removing photos with empty tag sets and performingbulk upload filtering, retaining only one of a set of photos from a given user with identical tag sets. The resulting reduced set of 2.8M images is then divided 80/10/10 into training, development and test sets. The tag set of each photo is concatenated into a single piece of text (in the process losing user-supplied tag boundary information in the case of multi-word tags). The resulting documents tend to be extremely short (often less than 10 words) but consist of words that tend to have high geographic salience.
2.3
Historical texts
No document-level annotations exist for the historical texts I am interested in studying. For this reason, I annotated part of a book-length historical travel log, John Beadle’sWestern Wilds, and the
Men Who Redeem Them, published in 1878. In addition, as part of a project funded by the New
York Community Trust (NYCT), I supervised the annotation of parts ofThe War of the Rebellion:
a Compilation of the Official Records of the Union and Confederate Armies,5 a set of over 100
volumes of archives of the American Civil War.6
I use these texts to demonstrate the feasibility of text-based geolocation with smaller amounts of annotated material, especially in conjunction with domain adaptation (Chapter 5) in-volving additional training on the English Wikipedia (ENWIKI13, §2.2.2).
5http://ehistory.osu.edu/books/official-records
6This work was done in conjunction with Professors Scott Nesbit and Jason Baldridge, as well as a colleague, Grant
2.3.1
Western Wilds
Western Wildsby John Beadle is one of the books from the PCL Travel collection of 19th-century
travel texts.7 This book is an account of Beadle’s travels over a seven year period throughout the Western part of the United States. It includes both direct descriptions of Beadle’s travels and inter-polated travel stories of people that Beadle encountered. Because it is in the form of a travelogue, it is generally possible to identify a location with each stretch of text—for example, the location that the narrator is assumed to have been at when a story is being narrated, or the geographic topic of interest when a description of a location is interpolated into the narrative. The resulting corpus is termed BEADLE.
I annotated both at the paragraph and sub-paragraph level. For the latter type of annotation, I subdivided the paragraph into chunks (as large or as small as necessary) covering a unified geo-graphic topic, whether a political feature (e.g. city, county, state or Indian reservation) or a natural feature (e.g. a lake, river, mountain or mountain range).
All annotations were done in the form of single points, even when the topic of the paragraph was more naturally described by a polygon (e.g. regions, states or rivers). This was done for con-sistency with the automatic annotations of the various modern datasets previously described in this chapter, and for computational convenience. This is admittedly not an ideal situation; however, both the algorithms and their evaluation get significantly more complex when polygonal or even rectan-gular annotations are introduced. Note that in the other text annotated as part of this dissertation,
War of the Rebellion(§2.3.2), textual spans were in fact annotated with polygons when appropriate,
but I still derived a point location from the polygons for use in training and testing.
My actual mechanism for annotating a span of text with a location was in most cases to specify the name of a geolocated feature in Wikipedia, so that I could then use a script to automati-cally tag each such feature with the appropriate coordinates as found in Wikipedia. However, when doing this I avoided specifying a linear feature such as a river or mountain range in favor of using the point feature in Wikipedia (e.g. a city or landmark) that is as close as possible to the portion of the river or mountain range that the text in question is about. This was done to maximize the accuracy of
7This corpus consists of 94 books and approximately 7.7M words, and was collected by the Perry-Castañeda Library at