Clemson University
TigerPrints
All Dissertations Dissertations
5-2016
Product-Process Coupling to Enable Continuous
Improvement of Assembly Processes
Rahul Sharan Renu
Clemson University, [email protected]
Follow this and additional works at:https://tigerprints.clemson.edu/all_dissertations
This Dissertation is brought to you for free and open access by the Dissertations at TigerPrints. It has been accepted for inclusion in All Dissertations by an authorized administrator of TigerPrints. For more information, please [email protected].
Recommended Citation
Renu, Rahul Sharan, "Product-Process Coupling to Enable Continuous Improvement of Assembly Processes" (2016).All Dissertations. 1665.
PRODUCT-PROCESS COUPLING TO ENABLE CONTINUOUS IMPROVEMENT OF ASSEMBLY PROCESSES
A Dissertation Presented to the Graduate School of
Clemson University
In Partial Fulfillment
of the Requirements for the Degree Doctor of Philosophy Mechanical Engineering
by
Rahul Sharan Renu May 2016
Accepted by:
Dr. Gregory M. Mocko, Committee Chair Dr. Georges Fadel, Committee Member
Dr. Laine Mears, Committee Member Dr. Michael Porter, Committee Member
ii ABSTRACT
The objective of this research is to couple product and process design knowledge to enable continuous improvement of assembly processes. Specifically, the use of assembly solid model similarity to mine databases and retrieve assembly process information is investigated. Nine techniques of computing solid model similarity from literature are investigated for their correlation with human interpretation of assembly model similarity. A method of computing solid model similarity by using frequency distributions of tessellation areas is developed and investigated. For each of the nine solid model similarity methods, the results from use of component solid model similarity in conjunction with assembly model similarity are compared to the results when only assembly model similarity is used. A survey is conducted to gather human interpretation of assembly solid models from the perspective of assembly process similarity. From the tests conducted it is found that the method of using tessellation area distributions has weak correlation to human interpretation of assembly solid model similarity from the perspective of assembly processes. The D1 method, which uses distance between centroid and random points on the surface of solid models, was found to have highest correlation to survey results. The use of component model similarity in conjunction with similarity of the assembly model was found to improve the precision of the solid model similarity methods.
Text similarity techniques from literature are investigated for their correlation with human interpretation of assembly work instruction similarity. Through testing, Latent Semantic Analysis is chosen as the method of computing assembly work
iii
instruction similarity since it has moderately positive correlation with respect to survey results and is less sensitive to the use of synonyms than the three other methods of text similarity investigated in this research. The Jaccard method of computing similarity is inherently a measure of consistency in the terminology used between the two texts being compared and this can be used to provide decision support while engineers author assembly work instructions. This will allow authors to understand the level of consistency between their work instructions and the other work instructions within the specific enterprise.
The D1 method of computing solid model similarity and Latent Semantic Analysis to compute assembly work instruction similarity are used to compare assembly solid models and assembly work instructions obtained from a survey. In this survey, participants were presented with assembly solid models and asked to author assembly work instructions. The correlation between the solid model similarity scores and assembly work instruction similarity scores (within and across participants) indicates that regardless of assembly work instruction authors, assembly solid models and assembly work instruction share a moderately positive correlation. These results, coupled with the understanding that the causation between assembly work instructions and solid models is limited to those work instructions which describe handling of components and mating of components, can be used for process design knowledge retrieval and reuse. The results from this research can be used to mine databases by using solid model similarity and retrieve assembly work instructions. This will couple product design and assembly process design and allow for continuous improvement of the latter.
iv DEDICATION
v
ACKNOWLEDGEMENTS
I would like to thank my advisor, Dr. Gregory Mocko, for providing invaluable support, guidance and encouragement through my tenure as a graduate student. Working with him has allowed me to not only develop my engineering skills but also grow as a person. Thank you, Dr. Mocko, for your belief in me. Thank you to my PhD committee members – Drs. Georges Fadel, Laine Mears and Michael Porter, for their guidance through my PhD.
Thank you to BMW and ZF Transmissions for providing me the opportunity to work on industry-related research projects. These experiences have allowed me to gain insight into the manufacturing industry and I will always value these collaborations. Thank you to the Department of Mechanical Engineering at Clemson University for providing me the opportunity to teach and advise undergraduate students; and for providing me with the resources required to complete my PhD. The Graduate School at Clemson University allowed me to not only achieve my academic goals, but also to actively participate in Graduate Student Government and gain experiences in management and leadership. I would like to thank the Graduate School for these opportunities. The staff members at the Department of Mechanical Engineering at Clemson University have made my graduate student experience very enjoyable and I thank them for this.
Over the last four years, I have spent more hours in the CEDAR lab than anywhere else and the members of the CEDAR lab have made this an amazing experience. I would like to extend a special thanks to Smriti Bhargava, Blake Linnerud,
vi
Essam Namouz, Matthew Peterson and Michael Harte for their support and encouragement.
Last, but certainly not least, thank you to my parents, Dakshayini and Anand Sharan for their endless sacrifices and their continued belief in me. Thank you for supporting me through thick and thin. I could not have asked for more loving and caring parents than you both. Thank you for everything.
vii TABLE OF CONTENTS Page ABSTRACT ... ii DEDICATION ... iv ACKNOWLEDGEMENTS ...v LIST OF TABLES ... ix
LIST OF FIGURES ... xii
CHAPTER 1: INTRODUCTION AND MOTIVATION ...1
1.1 Decentralized and Globalized Manufacturing Systems ...1
1.2 Need for Knowledge Management in Globalized, Decentralized Design and Manufacturing Systems ... 3
1.3 A Method to Link Product Design and Assembly Process Design ...4
CHAPTER 2: FRAME OF REFERENCE ...10
2.1 Product Evolution Process (PEP) ...11
2.2 Information available at different PEP phases ...13
2.3 Product-Process coupling ...17
2.4 Computational methods to analyze and compare assembly solid models ...26
2.5 Computational methods to analyze and compare assembly work instructions ...39
2.6 Summary of research opportunities ...43
CHAPTER 3: COMPUTATIONAL SOLID MODEL SIMILARITY FOR ASSEMBLY PROCESS INFORMATION RETRIEVAL ...47
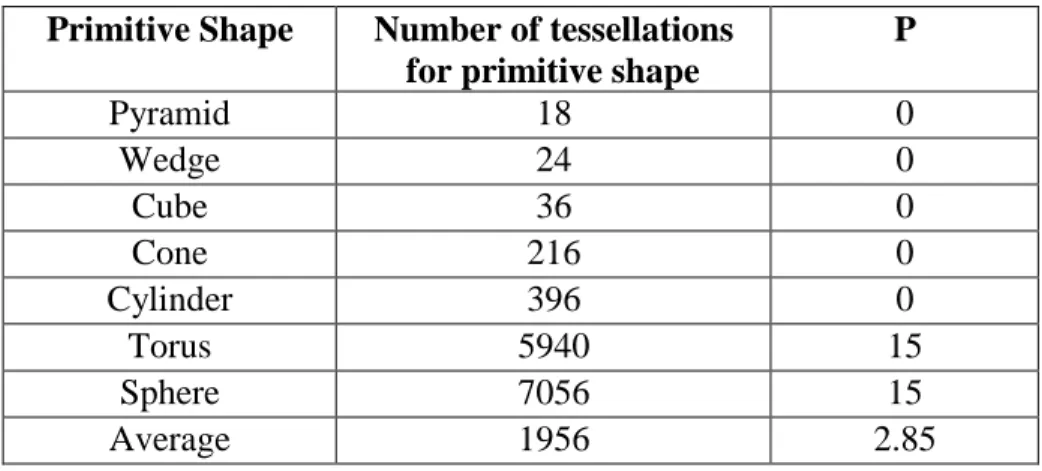
3.1 Use of tessellation areas to determine solid model similarity ...51
3.2 Comparison of existing solid model similarity methods to tessellation area frequency distribution solid model similarity ... 56
3.3 D1 method to compute solid model similarity and visualizing differences in solid models ... 73
CHAPTER 4: COMPUTATIONAL ANALYSIS OF ASSEMBLY WORK INSTRUCTIONS ...77
viii
Page
4.1 Surveys for assembly work instruction similarity ...79
4.2 Results from Comparing Text Similarity Algorithm Results to Survey Results ...84
5.1 Overview of recommended methods to compute assembly solid model similarity and assembly work instruction similarity ...102
5.2 Survey to analyze product-process correlations ...104
5.3 Data analysis and results ...106
5.4 Example of assembly work instruction retrieval based on solid model similarity ... 126
6.2 Future research paths ...133
CHAPTER 6: REFERENCES ...136
APPENDICES ...145 Table of Contents (Continued)
ix
LIST OF TABLES
Table Page
Table 1: Summary of DFMA methods reviewed ... 22
Table 2: Overview of product-process coupling methods ... 25
Table 3: Abstractions of solid models ... 27
Table 4: Summary of solid model comparison techniques explored in this research ... 29
Table 5: Qualitative analysis of solid model similarity computation methods ... 49
Table 6: Summary of computational solid model similarity assessment methods ... 50
Table 7: Likert scale used in survey ... 57
Table 8: Complexity of assembly models used in pilot survey ... 60
Table 9: Complexity of assembly models used in revised survey ... 60
Table 10: Comparison of pilot and revised survey ... 62
Table 11: Snippet of raw data collected from revised survey ... 63
Table 12: Ranks assigned to solid model pairs based on overall score ... 64
Table 13: IRR scores for all solid model sets ... 65
Table 14: Number of solid model sets with specific IRR cut-offs ... 66
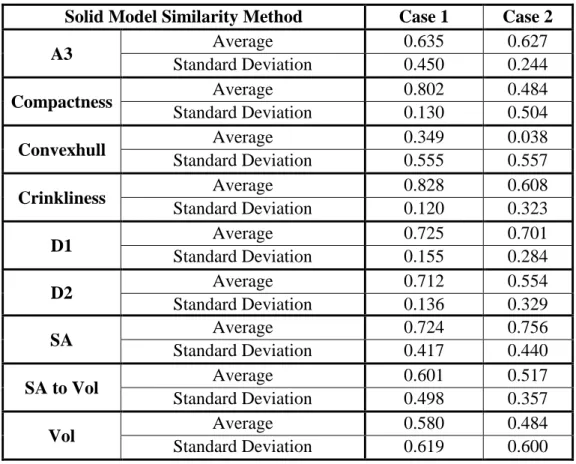
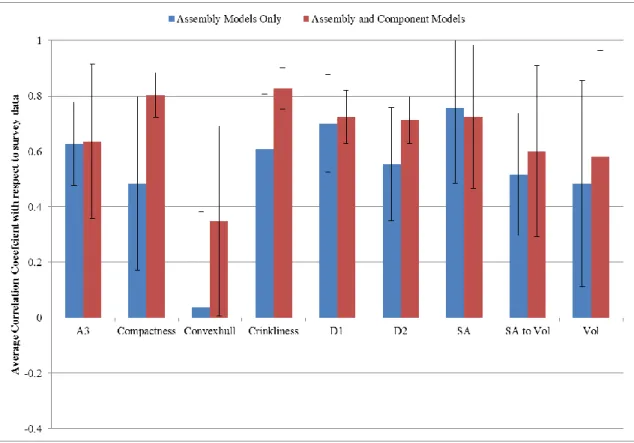
Table 15: Average and Standard Deviation of correlation coefficients for nine solid model similarity algorithms for Case 1 and Case 2 ... 69
Table 16: Confidence Intervals for Case 1 ... 70
Table 17: Confidence Intervals for Case 2 ... 70
Table 18: Average and standard deviation of rank correlation coefficients for all algorithms ... 72
Table 19: Repeatability test results summary for D1 and D2 ... 73
Table 20: Methods of assessing assembly work instruction similarity ... 77
Table 21: Example work instruction sets ... 80
Table 22: Description of the work instruction sets ... 81
Table 23: Excerpt of survey data showing synonyms used in handling work instructions ... 82
Table 24: Correlation coefficients between survey participants ... 84
Table 25: Raw data for Word Overlap method ... 85
Table 26: Example set of work instructions and their Word Overlap Similarity ... 86
Table 27: Average correlation coefficient between survey data and Word Overlap method scores... 86
Table 28: Raw data for Jaccard method ... 87
x List of Tables (Continued)
Table Page
Table 30: Average correlation coefficient between survey data and Jaccard method scores
... 88
Table 31: Raw data for TF-IDF method ... 89
Table 32: Example set of work instructions and their TF-IDF Similarity ... 89
Table 33: Average correlation coefficient between survey data and TF-IDF method scores... 90
Table 34: Raw data for LSA method ... 90
Table 35: Example set of work instructions and their TF-IDF Similarity ... 91
Table 36: Average correlation coefficient between survey data and LSA method scores 91 Table 37: Summary of average and standard deviation of correlation coefficients between text comparison methods and survey data ... 91
Table 38: Summary of t Test results ... 92
Table 39: Comparing sensitivity of LSA and Jaccard methods to synonyms ... 93
Table 40: Comparing sensitivity of LSA and Word Overlap methods to synonyms ... 94
Table 41: Comparing sensitivity of LSA and TF-IDF methods to synonyms ... 94
Table 42: Example of work instruction set retrieval using LSA scores ... 96
Table 43: Summary of relevant words from assembly work instructions gathered from survey ... 98
Table 44: Assembly work instructions and their related Jaccard scores ... 99
Table 45: Summary of survey to gather assembly work instructions ... 106
Table 46: Summary of four cases for data analysis ... 109
Table 47: Summary of data analysis cases – Case 2 ... 110
Table 48: LSA similarity scores between work instructions presented in Figure 39 ... 112
Table 49: Statistics related to LSA similarity scores presented in Table 48 ... 112
Table 50: Summary statistics for all solid models ... 112
Table 51: Summary of data analysis cases – Case 3 ... 114
Table 52: Examples of solid model pairs and their assembly work instructions ... 114
Table 53: Participant 1 – correlation between solid model similarity and assembly work instruction similarity ... 117
Table 54: Statistics for data presented in Table 53 ... 118
Table 55: Statistical test summary for Case3 for all participants ... 118
Table 56: Summary of data analysis cases – Case 4 ... 119
Table 57: Example data for Case 4 ... 119
xi List of Tables (Continued)
Table Page
Table 59: Correlation between assembly work instruction similarity and solid model similarity for all participant pairs ... 125 Table 60: Summary of results ... 126 Table 61: Retrieved assembly work instructions for most similar database solid models
xii
LIST OF FIGURES
Figure Page
Figure 1: Example solid models and associated assembly work instructions ... 5
Figure 2: Research Overview ... 9
Figure 3: Product Evolution Process... 11
Figure 4: Increasing cost to implement design changes [16,22] ... 12
Figure 5: Example solid model and assembly work instruction ... 14
Figure 6: Feedback loops required in a manufacturing system ... 16
Figure 7: Use of product and process clusters for product-process coupling ... 22
Figure 8: Example of two cuboids with dissimilar shapes but equal volumes ... 30
Figure 9: Methods to represent shapes as frequency distributions [54,57]... 32
Figure 10: Example solid model and its convex hull representation ... 33
Figure 11: Convex hull D2 frequency distribution for example solid models ... 34
Figure 12: D2 distributions for solid models ... 36
Figure 13: D1 distribution of solid models ... 37
Figure 14: A3 distribution of solid models ... 38
Figure 15: Example of assembly and component models ... 39
Figure 16: Overview of dissertation – End of Chapter Two ... 46
Figure 17: Two assemblies – one with locator tab and the other without ... 48
Figure 18: Example tessellated solid model ... 52
Figure 19: Example of tessellation differences of a plate with hole and without hole ... 52
Figure 20: Example of calculating tessellation area distribution based solid model similarity ... 54
Figure 21: Frequency plot of tessellation areas for two solid models ... 55
Figure 22: Snippet of pilot survey ... 58
Figure 23: Distribution of solid models across categories from Engineering Shape Benchmark [53] ... 59
Figure 24: Comparison of complexity of solid models from pilot and revised survey .... 61
Figure 25: Example of combined component and assembly model similarity ... 68
Figure 26: Graphical representation of confidence intervals of Case 1 and Case 2 average rank correlation coefficients ... 71
Figure 27: Difference between solid models highlighted using tessellation area information ... 75
Figure 28: Overview of dissertation – end of Chapter 3 ... 76
Figure 29: Snippet of the survey ... 79
xiii List of Figures (Continued)
Figure Page
Figure 31: Overview of dissertation – end of Chapter 4 ... 100
Figure 32: Method to obtain solid model similarity using D1 ... 103
Figure 33: Training provided to participants prior to start of survey ... 104
Figure 34: Example assembly work instructions shown to participants before beginning the survey ... 105
Figure 35: Snippet of the survey to get assembly work instructions ... 105
Figure 36: Case 2 – Comparing work instructions from different authors for identical solid models ... 107
Figure 37: Case 3 – Comparing work instructions for different solid models by the same author ... 108
Figure 38: Case 4 – Comparing work instructions for different solid models by the different authors ... 108
Figure 39: Example assembly work instructions authored by four survey participants for a given solid model ... 110
Figure 40: Correlation between solid model similarity and assembly work instruction similarity for all participant pairs ... 125
Figure 41: Query assembly solid model ... 127
Figure 42: Database assembly solid models (unordered) ... 127
Figure 43: Rank-ordered database assembly solid models ... 128
Figure 44: Overview of dissertation – end of Chapter 5 ... 130
1
CHAPTER 1: INTRODUCTION AND MOTIVATION
Chapter Objectives:
Discuss decentralized, globalized design and manufacturing systems Discuss the use of solid model similarity and computational text analysis
for product-process coupling
Present and discuss the research questions Provide an outline of the dissertation
The objective of this research is to bridge the gap between product design and assembly process design by relating part geometries to assembly work instructions. This research is for enterprises which practice decentralized manufacturing. The concepts of decentralized manufacturing, globalized manufacturing and the need for knowledge management in such systems are discussed in the remainder of this chapter. In addition, the need to couple product and process design is also discussed. The chapter ends with research questions and organization of this dissertation.
1.1 Decentralized and Globalized Manufacturing Systems
Traditionally, enterprises performed design, planning and manufacturing operations at a single location. Such a system is referred to as a localized manufacturing system. Over the past three decades [1], decentralized manufacturing has gained popularity. In a decentralized manufacturing system, design of products and high-level production planning is performed at a (single) location, while detailed production
2
planning and conversion of raw materials to finished goods takes place at geographically dispersed locations [1,2].
Decentralized manufacturing goes hand-in-hand with globalization. Globalization can be viewed from the perspective of markets and manufacturing [3]. When international trade barriers are removed, it allows for the globalization of markets and encourages localized manufacturing. In other words, if production of goods at a certain geographic location is inexpensive and exporting those goods to international locations is also inexpensive, this will harbor localized manufacturing and globalized trade. However, when trade barriers (such as taxes) are imposed, enterprises look to globalize their production. Enterprises who were previously exporting goods to international locations are now incentivized (by, for example, tax reductions) to manufacture locally and source parts from suppliers who also manufacture locally. We refer to this as globalization of manufacturing.
The motivation for enterprises to globalize manufacturing efforts has evolved since 1980. A description of this evolution is provided by Sturgeon and Florida [3]. Prior to mass production (1926), goods were expensive and manufactured by expert craftsmen. These manufacturing efforts had to be in close proximity with customers to ensure requirements were met. However, mass production eliminated this barrier and allowed for goods to be manufactured and sold at low costs. The demand for mass produced goods increased and enterprises realized the need to further reduce costs incurred. This served as added motivation to move manufacturing efforts closer to customers [3]. Trade laws imposed barriers on international import and export of finished goods fostering the
3
need for globalized manufacturing. While Sturgeon and Florida [3] have provided an extensive review of the evolution of the motivation for globalized manufacturing, they have overlooked the aspect of lead time. Globalized manufacturing and proximity to customers allows enterprises to reduce production lead times. This is especially important when viewed from the perspective of mass customization [4–6].
With globalized and decentralized manufacturing comes the challenge of knowledge distribution and feedback. The need to focus on knowledge management in systems where knowledge generation sites are not co-located has been established by previous researchers [7–11].
1.2 Need for Knowledge Management in Globalized, Decentralized Design and Manufacturing Systems
In a global and decentralized design and manufacturing enterprise, corporate decisions, design decisions and preliminary production planning is conducted at a centralized location. The information generated at the central location is distributed to manufacturing facilities worldwide. At these facilities (apart from other activities) suppliers are identified, production plans are optimized to be location-specific and finished goods are produced. Knowledge generated at these manufacturing facilities must be communicated back to centralized planning location to evaluate its applicability enterprise-wide and to identify good or bad practices. This will lead to standardization of practices across manufacturing locations and foster continuous improvement [12,13]. It is equally important for the manufacturing locations to communicate with each other. If
4
challenges faced at a facility are not unique, then solutions to these challenges from other facilities can be mined and implemented at that facility.
Product Lifecycle Management (PLM) systems aim to address the need for knowledge management through the entirety of a product’s lifecycle – from conception to end-of-life [7,14]. However, the use of previous product development knowledge during new product development is a challenge. Additionally, the concurrent/integrated design of product and manufacturing processes is challenging. Concurrent Engineering (CE) has emerged at the forefront of integrated product and process design [8,15]. This research aims to support CE by relating solid model geometry (product design) to assembly process design. In doing so, information from PLM systems will be used.
1.3 A Method to Link Product Design and Assembly Process Design
Three dimensional solid models are an embodiment of the decisions made during the (iterative) product design process [16]. This research aims to relate solid models of components to their assembly processes. Assembly work instructions prescribe the assembly process of two or more components (see Figure 1 for example solid model and the associated assembly work instructions). Ergonomic evaluations of assembly processes, assembly time estimates and assembly line balancing are all performed based on assembly work instructions [9,17–20].
5
Figure 1: Example solid models and associated assembly work instructions Relating solid models to assembly work instructions will allow for enterprises to consider assembly process constraints during product design. This will enable forecasting of assembly process issues which are inherent a product’s design reducing the time and effort for iterations between product designs.
Reuse of assembly work instructions is sometimes practiced in industry in an unstructured and informal manner. When process designers are tasked with designing of an assembly process for a new product, they refer to assembly work instructions of “similar” products from the past. This research aims to formalize this process of mining
databases to find
“similar” products and retrieve associated assembly work instructions. The extensibility of existing techniques to assess solid model similarity from the perspective of assembly
6
work instructions has not been investigated. Also, these existing techniques use a score to evaluate similarity between solid models. Differences between similar solid models will need to be identified and visualized for engineers while they choose a solid model-assembly work instruction pair as a template for new model-assembly process design. The challenge lies in developing a technique which will identify differences in solid models in a software neutral format because decentralized manufacturing systems may employ two or more software to perform solid modeling. Computational text analysis methods can be employed to assess assembly work instructions for their compliance with other assembly work instructions within the enterprise. This approach has not been investigated from the perspective of continuous improvement. With regards to this, the following are the questions and hypotheses which govern this research:
Overarching Research Question: How can solid models and assembly process knowledge be coupled to enable knowledge reuse?
Hypothesis: Assembly solid model similarity can be used to retrieve similar solid models and their associated assembly work instructions.
Research Question 1: What solid model information can be used to compute solid model similarity from the perspective of assembly processes?
Research Hypothesis 1: Tessellation area frequency distributions of two solid models can be compared to assess solid model similarity from the perspective of their assembly processes.
7
Research Question 2: How can differences in solid models be identified? Research Hypothesis 2: Individual tessellation surface areas can be computed and tessellations with unique surface area can be used to identify differences in solid models.
Research Question 3: What decision support can be provided to foster continuous improvement of assembly process design?
Research Hypothesis 3: Consistency of terminology used within an assembly work instruction with respect other work instructions, can be used as a metric to provide decision support. This will allow users to improve consistency of assembly process descriptions which will foster continuous improvement.
Research Question 4: What is the correlation between assembly work instructions and the related assembly solid model geometry?
Research Hypothesis 4: There exists a direct correlation and causation between assembly solid models and their assembly work instructions. This correlation and causation is limited to assembly work instructions which are not related to plant layouts.
Research Question 4.1: What methods of text similarity measurement provide the most accurate results while comparing assembly work instructions?
8
Research Question 4.2: How do text similarity measurement methods vary in terms of their sensitivity to synonymy of words used in assembly work instructions?
These research questions and hypotheses form the basis for this research. A research overview is presented in Figure 2. In Chapter Two, a review of relevant literature is presented. This includes product development process, methods of computing solid model similarity and computational text analysis methods. Gaps identified in literature are also presented in this chapter. Solid model similarity approaches evaluated in this research are presented in Chapter Three along with results. In Chapter Four an assembly solid model similarity benchmark is presented. This benchmark is intended for researchers who are developing computational methods of analyzing assembly solid models for similarity. In Chapter Five the investigation of computational text analysis methods as they relate to assembly work instructions is presented. The use of recommended use solid model similarity and computational text analysis to predict assembly work instructions based on query solid model is presented in Chapter Six. Closing remarks and future paths are presented in Chapter Seven.
9
10
CHAPTER 2: FRAME OF REFERENCE
Chapter Objectives:
Discuss the Product Evolution Process
Outline information available at different phases of product development Highlight the need for integrating product and process development Summarize and evaluate previous approaches of solid model similarity Summarize and evaluate existing approaches of computational text
analysis
Enumerate gaps found and establish research motivation
The automotive industry employs decentralized, globalized manufacturing system. Enterprises such as BMW and Volkswagen have a centralized planning and development center in Germany and several manufacturing facilities all over the world. Corporate control, product conceptualization and skeletal production planning occurs in the centralized location (Germany, in this case). The plans are deployed to manufacturing facilities worldwide. At these facilities, the production plans are optimized to suit location-specific constraints. Two cases where manufacturing locations will make changes are:
Centralized planning location may define the assembly process of two components (via assembly work instructions). The handling of these
11
components from line side to the assembly station will have to be defined by the engineers at the specific manufacturing location.
Precedence constraints [20,21] and time constraints for the assembly line balancing problem will be supplied from the centralized planning location. Each individual manufacturing location will have to assess the location-specific constraints and perform line balancing.
If the communication loop from manufacturing locations to centralized planning location and between manufacturing locations are closed, there exists an opportunity to leverage enterprise-wide knowledge generation and consumption – leading to continuous improvement. To understand the information available at different phases of a product’s life, it is essential to first understand the Product Evolution Process.
2.1 Product Evolution Process (PEP)
The Product Evolution Process (PEP) described in this from [22]. This has also been referred to as the Product Emergence Process by other researchers [23]. The PEP can be divided into two phases – the Development phase and the Production phase (see Figure 3).
12
In the Development phase, market needs and product portfolio gaps are analyzed and new product development is initiated [16]. When such a need/gap is identified, product requirements are generated and elicited from customers. Subsequently, concept ideation is performed followed by concept evaluation and concept selection. In some cases, solid model representations of the different variants are required to perform thorough evaluation of all concepts [16]. Prototyping and virtual evaluation techniques are also used.
Once a concept has been selected, embodiment design begins and is followed by detailed design [16]. Typically, it is in the detailed design phase that manufacturing and assembly process design is conducted. By this time, significant amount of effort and costs have been invested into a product’s design. Figure 4 shows the increase of cost-to-redesign in the different PEP phases [16,22]. Any product-design-inherent manufacturing and/or assembly process issues will become increasingly expensive to resolve.
13
The Production phase is divided into two sub-phases – Manufacturing and Assembly. In the Manufacturing sub-phase that raw material is converted into individual components. These individual components are assembled together in the Assembly sub-phase. While PEP may seem to be a linear process, iterations are carried out within and across the Development and Production phase. Identification of downstream issues in early phases of the PEP is favorable as it is less expensive and less time consuming – frontloading [24]. Before approaches of frontloading are investigated, a discussion of the information available at each phase of the PEP is discussed in the following section.
2.2 Information available at different PEP phases
In the Design phase, product requirements are gathered based on market needs and customer evaluations. Concepts generated are evaluated for their compliance to the requirements. These concepts can be in the form of hand-drawn sketches or three dimensional solid models. It is argued that solid models are required for certain types of concept evaluation [16]. Solid model representations of concepts will allow for virtual product evaluation [25,26] and for modelling of concepts under static, dynamic and thermal loading conditions. These solid models can also be used to manufacture prototypes for further evaluations. When Prototyping and Evaluation is completed, a concept is selected and embodiment design of the concept is conducted. Apart from other evaluations, at this (embodiment) phase production processes for the various subcomponents are evaluated and manufacturing specifications developed. In this phase, solid models developed for prototyping and evaluation are modified based on evaluations conducted. After embodiment of the selected concept is completed, detailed
14
documentation of the dimensions, manufacturing processes and specifications, assembly instructions and operating procedures is completed.
The next phase is Manufacturing, where plans developed during embodiment and detailed design are executed. Infeasible designs are identified and modified and the reasons for infeasibility are recorded. These modifications require the subcomponents to pass through prototyping, embodiment and detailed design. Once subcomponents are manufactured, they are assembled together to form the final product. Assembly work instructions are defined for every assembly process required. Assembly work instructions define the process by which two (or more) components are assembled together. Example assembly work instructions and the associated solid models are presented in Figure 5.
Figure 5: Example solid model and assembly work instruction
Assembly work instructions specify key elements of the assembly process, such as tools to be used, quality checks which must be conducted and rules which must be
15
followed [9,17,27]. Assembly work instructions are the entities which are assigned to workstations and workers during assembly line balancing. In some cases, several assembly work instructions can be combined together in a process sheet [9,20,28], and in these cases, the process sheet becomes the entity which is assigned to workstations and workers during assembly line balancing. Assembly work instructions also serve as legal documentation of the work required for the assembly of a product [9]. Other information is derived from assembly work instructions, such as assembly time estimates and ergonomic evaluations [18,19,29,30]. Enabling comparison of assembly process variants for the same components, will allow process engineers to think differently and possibly generate more efficient and innovative assembly process solutions.
Assembly work instructions are first generated during virtual prototyping at a centralized assembly planning location. At this stage, assembly work instructions are in their nascent form and contain generic handling and assembly information of parts. An example set of assembly work instructions in the early phases of PEP are:
Get casing
Orient the case vertically such that the larger internal cylinder is on top Get screw
Insert the screw into the casing
These work instructions are then deployed to manufacturing locations, where plant-specific information is added and work instructions are refined. An example of this is:
16 Get casing from inventory box
Orient the case vertically such that the larger internal cylinder is on top Get screw from the storage stand
Insert the screw into the casing
Figure 6: Feedback loops required in a manufacturing system
The feedback loop from manufacturing locations to the centralized planning location is required. Communication among manufacturing locations must be enhanced as well (see Figure 6). When assembled, subcomponents may exhibit a collective behavior which was unintended and unwanted. Due to this, changes to the design of the product may be deemed necessary. The reasons for design changes are documented and each revision of the product’s design is recorded. Any change to the product’s design in this phase will warrant the revised design to pass through all previous phases of PEP.
17
This will cost money and is a time-consuming process. Therefore, it is necessary to couple product and process design. This will allow for manufacturing and assembly process considerations to be taken into account during product design, thus reducing the probability of having to conduct expensive, time-consuming design iterations.
2.3 Product-Process coupling
The need to reduce product development time and simultaneously increase product quality has led to the development of approaches such as concurrent engineering, rapid prototyping and design for X [31]. The common theme across these approaches is to break down barriers between design and manufacturing by estimating the effects of upstream decisions on downstream operations, often called frontloading [24]. In the context of this research, efforts are focused on coupling product design with assembly process design. The idea of coupling product and process design is not novel. Researchers have developed methods such as Design for Manufacturing and Design for Assembly [10,32–35] to relate product designs to manufacturing and assembly processes. Researchers have also developed methods to estimate cost, assembly time and assembly quality based on product design [23,31,36,37]. These approaches of product-process coupling are reviewed in the following section.
2.3.1 Review of existing methods of product-process coupling
Several researchers have recognized the need to take manufacturing and assembly considerations while designing products [33,34,38–40]. Design for Manufacturing and Assembly (DFMA) has been widely researched [33,34,38–40] to close the gap between
18
product and process design. A subset of DFMA methods have been reviewed in the following subsections.
2.3.1.1 Hitachi Assembly Evaluation Method
The Hitachi Assembly Evaluation Method (AEM) is based on the concept of ‘one motion for one part’ [41]. The assemblability (ease of assembly) is indicated by a score, ‘E’, which accumulates when there is more than one motion per part. A similar score, ‘K’, is computed which indicates the relative cost of assembly (with respect to existing parts). Miyakawa and Ohashi [41] developed the AEM based on twenty primary movement types. Based on these, the assembly of products is evaluated, and ‘K’ and ‘E’ scores are provided. A challenge of their method is in the lack of ability to distinguish between manual and automated assembly processes.
2.3.1.2 Boothroyd and Dewhurst Design for Assembly Method
In their method, Boothroyd and Dewhurst [32] assess the assemblability of a product based on two characteristics – handling and insertion of the parts. There are two sets of charts, one set for handling and another for insertion. The designer must navigate through these charts by answering questions about the product under evaluation. These questions require knowledge about the part, such as size, number of hands required to handle the part and whether the part can be assembled if flipped 180 degrees [32]. Some of the questions in the Boothroyd and Dewhurst method are subjective and can lead to variability in the answers they elicit. This can lead to inconsistencies in the assembly time estimations obtained by different designers. Boothroyd and Dewhurst also provided a
19
generic list of suggestions to improve a product’s assemblability. Some examples of these guidelines are – reduce total number of components; increase standardization in the parts used; and ensure assembly is in top-down direction.
2.3.1.3 Lucas Method
The Lucas method for DFA [38] is unique in that it includes quality concerns while analyzing a product for its assemblability. The method employs Quality Function Deployment (QFD) techniques to include quality concerns in the DFA analysis. There are three analyses that constitute the Lucas DFA method: functional analysis, feeding analysis and fitting analysis. The functional analysis guides the designer to differentiating between components that perform a ‘primary function’ and those that perform a ‘secondary function’. This will allow designers to identify scope to eliminate components that perform a ‘secondary function’. Feeding analysis helps to identify the method of delivery of components from the manufacturing system to the assembly line. This will allow designers to consider the changes in their design which may allow feeding of components such that the handling thereafter is minimized.
2.3.1.3 Assembly-Oriented Design
Warnecke and Bassler [35], developed the Assembly-Oriented Design (AOD) method to include consideration of assembly during the early design process [33,35]. Their method aims to provide designers with perspectives of assembly process early in the design process to ensure that the number of iterations in the design process reduces.
20
The AOD method has been researched and adapted by DaimlerChrysler AG [33] in the automotive industry.
Zha and colleagues [42] build upon the AOD method and provide a knowledge-based approach to increase the level of automation within each stage. Zha and colleagues recognize that there are three levels at which assembly process perspectives need to be included: component level, product level and assembly-process level. At each level, the focus of the AOD method is to provide designers with guidelines for designing products that are less time consuming and less expensive from assembly process perspective. In the knowledge-based approach presented by Zha and colleagues [42,43], experienced design engineers and production experts explain complex concepts (pertaining to design geometries and assembly processes) to knowledge engineers. These knowledge engineers then generalize and codify the concepts, allowing for formalization of knowledge capture and reuse. This knowledge is supplemented with knowledge obtained from handbooks [32]. This method is based on the reuse of previous project knowledge approach presented by Thomke and Fujimoto [24]. This method of knowledge capture and reuse is time-consuming and relies on the explication abilities of engineers.
2.3.1.4 Methods-Time Measurement (MTM)
Maynard [44] developed Methods-Time Measurement (MTM) to increase consistency and reduce subjectivity of evaluating work content. While the intent of MTM was originally not to aid in concurrent design of product and process, it has transformed into a method which can bridge product and process design. There are several versions of MTM [30,44–46] (some even adapted and modified to suit specific enterprises). The
21
process of using MTM to analyze assembly processes does not change across versions, however data that is available in different versions of the MTM does. In general, MTM consists of a set of tables where each table corresponds to an assembly action (for example, ‘Get and Place’, ‘Handle Tool’ and ‘Laying Cables’). Users of MTM have to first choose the most appropriate table with respect to the assembly process they are analyzing [30]. Once a table has been chosen, part information (such as dimensions and weight) must be used to determine an assembly time.
Unlike Boothroyd and Dewhurst’s method [32], MTM does not explicitly provide guidelines for improving a product’s design based on manufacturing and assembly considerations. However, since part information is used to estimate assembly times, the sensitivity of the former to the latter will be apparent.
2.3.1.4 Product and process clusters
Manns and colleagues [46] developed a method of classifying products into clusters based on their weight, outer dimensions, center of gravity and number of standard components used. A training set of products, with known assembly processes, are classified into product clusters. Their assembly processes are classified into process clusters (MTM is used to characterize assembly processes). When a new product is designed, a naïve Bayes classifier is used to place it in a product cluster. This process cluster related to this product cluster is retrieved and the assembly process described therein is proposed (see Figure 7).
22
Figure 7: Use of product and process clusters for product-process coupling The causality between the product clusters and the assembly processes is neither tested nor discussed. Erohin and colleagues [31] present a similar method of relating product and process clusters to predict assembly process times in early phases of PEP. Their research lacks a discussion of causality between assembly times and the product cluster characteristics. A summary of the methods reviewed and challenges is presented in Table 1.
Table 1: Summary of DFMA methods reviewed
Reference Characteristics Challenges
[41]
Scores for ease of assembly and cost of assembly
Based on twenty primary movements
No distinction between manual and automated assembly processes
23
Reference Characteristics Challenges
[32]
Assembly times based on handling and insertion motions
Rules to improve ease of assembly
Subjective questions to arrive at an assembly time estimate - inconsistency across designers
Rules are generic and may contradict rules for other considerations
[38]
Quality Fuction Deployment to include quality concerns in DFA
Functional, Feeding and Fitting Analysis to analyze products
Subjective rating scheme leading to variability
[35]
Includes assembly considerations in the early product design
Knowledge-based approach to reduce effort of performing analysis
Manufacturing
considerations are not accounted for.
Knowledge capture method relies on explication abilities of engineers
[44]
Assembly time estimates based on assembly actions and part characteristic Separate tables for each assembly action. Navigation within these tables will lead to assembly time estimates
Ambiguity of among tables must be minimal to ensure consistent assembly time estimates
Estimating time for every assembly action will be time consuming
[31,46]
Training set of product and process clusters
Automated method to classify new product into product cluster and retrieve related process cluster
Quantitative testing is lacking
Lack of discussion and testing regarding causality between product cluster characteristics and process clusters
Existing methods of performing Design for Manufacturing and Assembly can be (semi-)automated by using knowledge-based approaches. Namouz and colleagues [37,47]
24
characterize a product’s design using nine complexity metrics and use Artificial Neural Networks to relate this characterization to assembly times. The errors associated with this method of estimating assembly time can be as high as 110% [47]. Renu and colleagues [19,30,48] have developed a rule-based system to relate assembly work instruction elements to MTM tables. This method does not provide a time estimate for a certain product, but instead provides a subset of MTM tables which are most applicable to an assembly operation.
Miller and colleagues [49] developed an assembly time estimation tool using Artificial Neural Networks (ANN). The ANN of this tool is trained on input of assembly work instruction verbs, object being assembled, number of objects being assembled, and volume of objects being assembled; and output of assembly time estimates using Methods-Time Measurement (MTM) [44]. However, the results obtained in this research show errors of up to 1043%. In addition, the causality between assembly work instructions and MTM time estimates was not discussed.
In the aerospace industry, Jin and colleagues [50] developed a knowledge based approach to automate assembly time estimation. Their system is based on Maynard Operation Sequence Technique (MOST) [51] and uses part information (geometry and material) and operation description to estimate assembly time. The research presented by Jin and colleagues fails to explain the development of the knowledge base which provides artificial intelligence. It is unclear how the method presented can be extended to other time estimation standards (such as MTM).
25
Within the automotive industry, literature for knowledge-based assembly time estimation comes from Ford, Toyota and BMW [17,18,29,30,52]. Rychtyckyj [17] developed an automated assembly time estimation system based on MODAPTS (Modular Arrangement of Predetermined Time Standards). This system takes assembly work instructions as input, determines the associated MODAPTS codes and provides an assembly time estimate. While this system provides assembly time estimation for MODAPTS, the researcher does not present the rule-base used to determine MODAPTS codes for given assembly work instructions. Neither does the researcher present the method used to obtain the mapping between work instructions and time estimates. In Table 2, an overview of the DFMA methods and the information they use is presented.
Table 2: Overview of product-process coupling methods
Product-Process Coupling Method Element(s) of product design used Element(s) of process design addressed 1 Hitachi [41] Geometry and mass of
components
Number of motions per component 2 Boothroyd and
Dewhurst [32]
Geometry and mass of
components Assembly time 3 Lucas [38] Geometry and functional
purpose
Quality and assembly motions 4 Assembly-Oriented
Design [35,42,43]
Conceptual designs,
geometry and mass Assembly time 5 Methods-Time
Measurement [44,45]
Geometry and mass of components
Assembly time and ergonomic evaluations 6 Product-Process clusters
[31,46]
Product weight, center of gravity, number of standard
components
Assembly work instructions and assembly time 7 Research presented in
this dissertation Geometry
Assembly work instructions
26
Although assembly time can be used as a metric to couple product and assembly process design, it will not suffice. Other considerations must also be taken into account, such as ergonomic feasibility of a product’s assembly and assembly process failure modes. Assembly work instructions can be used to evaluate assembly process feasibility from the perspective of assembly time [30], ergonomics [45] and process failure modes. In the literature which has been reviewed, one effort to link product and process design by use of solid models and assembly work instructions [23,31,46] has been found. However, this approach relies on high-level abstractions of the product being designed. The causality between the product abstractions and the process design elements is not tested. The research presented in this dissertation focusses on closing this gap (see Table 2). The following sections discuss computational methods to analyze assembly solid models and assembly work instructions.
2.4 Computational methods to analyze and compare assembly solid models
Three dimensional representations of components and assembly of components will be referred to as solid models. Comparison of solid models, in this case, is with the perspective of determining solid similarity between two solid models. Solid models can be analyzed and compared at varying levels of abstraction. At a high level, two solid models can be compared based on their surface areas or volumes [53,54]. Another example of a high-level comparison of solid models is the use of center of gravity and/or weight of solid models [31,46]. At a lower level of abstraction, solid models can be compared based on statistics generated from various types of bounding volumes, such as bounding boxes, convex hulls and bounding spheres. These methods are known to be
27
insensitive to minor perturbations on the surface of solid models. At an even lower level of abstraction, solid models can be compared by means of their Boundary Representations, Constructive Solid Geometries and statistics based on their shapes. An example of two solid models at different levels of abstraction is shown in Table 3.
Table 3: Abstractions of solid models
Representation Solid Model 1 Solid Model 2 Surface Area 3801.69 squared units 3345.42 squared units
Volume 7153.34 cubic units 7777.26 cubic units
Bounding Box
28 Statistical Representation
D1
Statistical Representation D2
Native solid model
There exists a trade-off between performance, level of abstraction for comparison and accuracy of results. In the following subsections the use of surface area, volumes, statistical representations of shapes and their abstractions is discussed. An overview of the methods of solid model comparison presented in subsequent sections is presented in Table 4.
29
Table 4: Summary of solid model comparison techniques explored in this research Representation Metric Section Number Comparison
method Surface area, Volume Surface area 2.4.1 Absolute difference Volume Surface area/Volume Compactness Crinkliness
Convex hull D2 2.4.3 L1 Minkowski
Native solid model D1 2.4.4 L1 Minkowski D2 2.4.5 A3 2.4.6
2.4.1 Comparison of solid models based on surface area and volume
The similarity of pairs of solid models can be assessed by comparing the surface areas of the two, or even by comparing volumes of the two [53,54]. These methods of comparing solid models can lead to false positives. For example, let us consider two cuboids A and B, both with volume 27 cubic units. Let cuboid A have length, width and height all equal to 3 unit; and cuboid B have length, width and height equal to 27 units, 1 units and 1 units (see Figure 8).
30
Figure 8: Example of two cuboids with dissimilar shapes but equal volumes Comparing the volumes of cuboid A and cuboid B will lead us to believe that the two shapes are absolutely similar. In another instance, let us consider a sphere and a cube which have the same surface area. Using surface area as a metric of similarity will lead us to believe that the cube and the sphere have absolutely similar shapes – another false positive.
Researchers have recognized the computationally inexpensive nature of using either surface area or volume for comparison of solid models [53,55,56]. Combinations of surface area and volume have been proposed to be used a coarse filters for shape searching in large databases [53]. Compactness [55] is defined as a ratio of cube of surface area to the square of volume (see Equation (1)). Crinklinessself is defined as a
31 3 2 SurfaceArea Compactness Volume (1) 2/3 self SurfaceArea Crinkliness Volume (2)
These methods combine surface area and volume measurements to provide more information about the solid model’s shape and size, when compared to the use of only surface area and/or volume. All these methods use absolute numbers of surface area, volume or any combination of the two, for comparison of solid models. Therefore, these methods are invariant to rotation and translation of solid models within the modelling coordinate system. Another method of representing solid models, which is invariant to rotation and translation, is statistical representation of solid models.
2.4.2 Statistical representation of solid models
Osada and colleagues [57] developed five methods to represent solid models as statistical cumulative frequency distributions. Each of the five methods relies on the generation of random points on the surface of solid models. Method A3 compares frequency plots of all angles between randomly generated points on the surface of a solid model.
Method D1 compares the frequency plots of distances between random points on the surface of solid models and centroid on the solid model (also see [56]).
32
Method D2 compares the frequency plots of all pairwise distances between random points on the surface of solid models (see Figure 9). Method D3 compares the frequency plots of the square root of area of
triangles formed between random points on the surface of the solid model. Method D4 computes and compares the cube root of the volume of tetrahedrons formed between four random points on the surface of solid models.
Figure 9: Methods to represent shapes as frequency distributions [54,57] Comparison of frequency distributions is conducted by computing the L1 Minkowski difference [57]. Osada and colleagues [57] compared these methods of statistical representation and found that D2 performs the best when a precision-recall analysis is performed.
Since D1 uses the solid model’s centroid to form the statistical representation, it is inherently sensitive to perturbations to surface of the solid model. Osada and colleagues [57] use a weighted scheme of selecting “random” points while calculating D2. This weighting scheme ensures that more points are chosen from surfaces with higher areas. However, if this weighting scheme is removed, it is expected that D2 will also be
33
sensitive to minor perturbations. Similarly, for A3, if no weighting scheme is used for generation of “random” points, this method will also be sensitive to perturbations. These methods of representing solid models as statistical distributions can be applied to native solid models or abstractions of solid models. In the next section, the use of D2 to represent and compare the convex hulls of two solid models is discussed.
2.4.3 Use of statistical representations to compare convex hulls of solid models A convex hull is defined as the tightest convex shape which can be wrapped around a solid model. An example of a solid model and its convex hull representation is shown in Figure 10.
Source: http://www.clawjelly.net/misc/convexHulls.jpg (Accessed on 9/18/2015) Figure 10: Example solid model and its convex hull representation
The use of convex hulls may prevent it from being unaffected by minor perturbations to the surface of solid models which is undesirable. The convex hulls of two solid models can be compared for shape similarity. The convex hulls of two solid models can be compared by analyzing their surface areas, volumes, compactness and/or crinkliness [53]. Another method to compare convex hulls is to use statistical
34
representations. In this case, the use of D2 approximation to compare the convex hulls of two solid models is presented. The pseudo code to perform this comparison is:
For each solid model: Compute convex hull
Compute 2500 random points on surface of convex hull Compute distances between all point pairs
Store frequency distribution of distances Compute L1 Minkowski difference between frequency distributions of two solid models
Examples of solid models and their convex hull frequency distributions are shown in Figure 11.
35 2.4.4 Use of D2 to compare solid models
Similar to the approach presented in the previous section, D2 can be used to compare the native shapes of solid models. An explanation of the expected trends in the frequency plots is presented by Rea and colleagues [58]. To perform the D2 comparison of solid models, the following pseudo code is used:
For each solid model:
Get 2500 random points on surface of solid model Get distances between all point pairs
Store frequency distribution of distances
Get L1 Minkowski difference between frequency distributions of two solid models
The frequency distributions of solid models and the respective solid models are shown in Figure 12. It can be observed that for the three screws which have threads, staggered steps can be observed in the frequency distributions. This is an expected pattern based on the literature found in [58].
36
Figure 12: D2 distributions for solid models
2.4.5 Use of D1 to compare solid models
The D1 method of computing similarity between solid models requires the computation of the centroid of each solid model and distances between randomly generated points and the centroid. The following pseudo code is used to compute D1 similarity between solid models:
For each solid model: Get centroid
Get 2500 random points on surface of solid model Get distances between centroid and all random points
37
Store frequency distribution of distances
Get L1 Minkowski difference between frequency distributions of two solid models
To demonstrate the D1 method, four solid models (of screws and nuts) are represented in terms of their D1 histogram. This is shown in Figure 13.
Figure 13: D1 distribution of solid models 2.4.6 Use of A3 to compare solid models
A3 method of solid model similarity comparison uses frequency plots of angles between random points generated on the surface of the solid model. The following pseudo code is used to perform A3 similarity comparison between two solid models:
For each solid model:
38
Get angles between all point trios Store frequency distribution of angles
Get L1 Minkowski difference between frequency distributions of two solid models
As an example, the same set of solid models (screws and nuts) is represented as A3 frequency distributions. This is shown in Figure 14.
Figure 14: A3 distribution of solid models
These computational methods of assessing solid model similarity are developed for single solid models. That is, in Figure 14, the screw and nut are both considered to be a single solid model. The algorithms perform similarity computation based on the assembly solid model and do not consider similarity of individual component models (see Figure 15 for example of assembly and component models). The method of using component solid models along with assembly solid models is explored in the next
39
chapter. In addition, investigation of the use of tessellation areas to compute solid model similarity is presented in the next chapter.
Figure 15: Example of assembly and component models
The objective of this research is to link product design with process design by relating solid model information to assembly process information. It is hypothesized that when a new product is designed, computational methods of assessing solid model similarity can be used to retrieve geometrically similar solid models from a database. If this hypothesis is supported, then the work instructions associated to the retrieved solid models can be computationally assessed for similarity and these work instructions can then be presented to the user. The next section discusses methods of computationally analyzing assembly work instructions.
2.5 Computational methods to analyze and compare assembly work instructions Text similarity is required for a variety of applications ranging from artificial intelligence to information retrieval [59–62]. There are several methods of text comparison, a brief overview of some is provided by Achananuparp and colleagues [60]. In this research, we consider three broad approaches of text similarity measures:
40
Pattern matching based on frequencies Vector representations of texts using corpora
Word Overlap and Jaccard method belong to the first of three broad approaches. Term Frequency – Inverse Document Frequency (TF-IDF) belongs to the second and Latent Semantic Analysis belongs to the third. In this research, Word Overlap, Jaccard and TF-IDF are implemented in Matlab, while an implementation of LSA (http://lsa.colorado.edu/) [63] is used to perform document-to-document similarity checks on assembly work instructions.
2.5.1 Word Overlap
This method of computing similarity of texts is relatively simplistic. Word Overlap similarity score is determined by counting the number of terms which are common to both, query and database text. This is then divided by the number of words in the query text. It is hypothesized that this method is sensitive to synonymy and polysemy of words. It is also hypothesized that if this method is used for retrieval of assembly work instructions, there will be a large number of false positives. These hypotheses will be tested as a part of this research. Mathematically, Word Overlap is represented as:
Word Overlap = A B
A
(3)
41 2.5.2 Jaccard Algorithm
This method is similar to Word Overlap method. It computes the intersection (common words) of the words of the two texts being compared and also the union of the words. The proportion of the former to the latter is the Jaccard score of similarity is computed as:
Jaccard Similarity = A B
A B (4)
Where, A is the query text and B is the database text
2.5.3 Term Frequency – Inverse Document Frequency (TF – IDF)
This method of evaluating text similarity is reliant on all the documents in the database. The size of the database and accuracy of the scores are proportionally related. This measure of similarity takes into account the frequency of word occurrences in both, query and database, texts; as well as, frequency of word occurrence in all documents in the database. The version of TF-IDF used in this research is:
, , 1 TF-IDF Similarity = log 1 log 1 log0.5 a A a B a A B a N tf tf df (5)
where, tfa,A is the number of times term a appears in A, tfa,B is the number of times term a
appears in B, dfa is the number of documents in which term a appears and N is the total
number of documents [62].
2.5.4 Latent Semantic Analysis
Text-based information retrieval is challenging especially when the information to be mined and retrieved is authored in unstructured, free text. In other words, when text is

![Figure 23: Distribution of solid models across categories from Engineering Shape Benchmark [53]](https://thumb-us.123doks.com/thumbv2/123dok_us/10207713.2923744/73.918.161.765.113.794/figure-distribution-solid-models-categories-engineering-shape-benchmark.webp)