The Effect of Stress Reduction Techniques on the Athletic
Performance of Male Collegiate Rowers
by
Sherman T. Tran
A THESIS
Presented to the Department of Human Physiology and the Robert D. Clark Honors College
in partial fulfillment of the requirements for the degree of Bachelor of Science
ii
An Abstract of the Thesis of
Sherman Tran for the degree of Bachelor of Science in the Department of Human Physiology to be taken June 2018
Title: The effect of stress reduction techniques on the athletic performance of male collegiate rowers
Approved: _______________________________________ Nathan Tublitz
Current training for collegiate rowers focuses exclusively on physical training with no thought of supporting optimal mental health. The aim of this study was to determine if stress reduction techniques improved rowing performance over time. The stress reduction technique used was progressive muscle relaxation (PMR), a procedure by which athletes tense and relax sequential muscle groups in a quiet environment guided by a script. PMR was integrated into an existing cardiovascular and strength conditioning regimen and assessed on the University of Oregon club men’s varsity rowing team for 3 months of the rowing season in the winter and spring of 2018. The hypothesis tested in this thesis was that stress reduction techniques would improve individual and team performance. The varsity men of the University of Oregon club rowing team were randomly assigned to either perform PMR twice weekly to
supplement the existing training plan (experimental group; n=6) or not (control group; n=4). Both groups continued to use the training plan assigned by coaching staff. To determine the effectiveness of PMR, all subjects performed four 2,000-meter ergometer tests over the course of the 3-month study period. The ergometer tests determined
iii
changes in relative mean power output, or fitness score. Subjects also took two questionnaires, the Sport Anxiety Scale and Recovery-Stress Questionnaire for Athletes, to quantify perceived anxiety and stress three times over the course of the study. Statistical analyses of the fitness scores of the experimental group compared to those of the control group revealed no group-specific significant improvement in fitness over the 3-month study period. The experimental group also showed no significant reduction in stress and anxiety. The results of this study suggest that short-term use of PMR has no demonstrable effect on rowing performance or stress and anxiety levels in collegiate rowers. PMR might have a more positive effect on rowing performance if implemented for a longer period, such as the entire rowing season, and this hypothesis should be explored in future studies.
iv
Acknowledgements
First and foremost, I would like to thank my Thesis Committee for their
assistance and support throughout this entire thesis process. The time you’ve committed has been indispensable and crucial to the completion and success of this thesis.
Professor Nathan Tublitz, this thesis would not have been possible without your help from the beginning. Thank you for agreeing to be my thesis advisor way back when I asked you for your help. Thank you for meeting with me to advise me at every step of the way. Thank you for the constant and extremely fast reviews, suggestions, and general support even if it meant Skyping with me or reading my emails in the early morning and late at night. You have been a fantastic mentor both for this thesis and for my academic career at UO and beyond. Professor Greg Bothun, thank you for your mentorship as well in the classroom and the outdoors, and agreeing to be my second reader. Thank you for your help with suggestions and the statistical portion of this thesis. Dr. Elizabeth Raisanen, thank you for being my Honors College Representative and faculty advisor when I was scrambling to put together my committee. Your advice and quick responses have been very helpful to the completion of this thesis.
I would also like to extend my thanks for the University of Oregon rowing team. While it has been extremely difficult at times, this sport has become one of, if not the most, formative parts of my time at the UO. This team allowed me to turn my life around in many aspects, find the meaning of discipline and fighting through adversity, and build the best support network I have ever had. While some have gone their own ways, my coaches and teammates have become my closest friends and family through the years of 4:30 AM alarms, erg tests, and so many other experiences. I attribute many of my personal successes and achievements to this team.
v
Table of Contents
Introduction 1
Hypothesis 8
Materials and Methods 9
Participants 9
Experimental and Control Group Selection 9
Stress Reduction Method 10
2,000-meter time trial results 10
Sport Anxiety Scale (SAS) 12
Recovery-Stress Questionnaire for Athletes (RESTQ-77) 13
Statistics 14
Results 16
The Effect of PMR on Mean Power and Fitness Score 16
Sport Anxiety Scale Results 20
Recovery-Stress Questionnaire for Athletes Results 30
Discussion and Conclusion 35
Appendices 42
Appendix I: PMR Transcript – Adapted from UC Berkeley School of Law PMR
Script 42
Appendix II. List of questions in the Sport Anxiety Scale 46 Appendix III: List of questions in RESTQ-77 Sport Survey 46
Appendix IV: Descriptions of RESTQ-77 Subcategories 49
vi
List of Figures
Fitness Score: Experimental vs. Control 18
Initial Fitness Score: Experimental vs. Control 18
Final Fitness Score: Experimental vs. Control 19
Initial vs. Final Fitness Score: Experimental Group 19
Initial vs. Final Fitness Score: Control Group 20
Initial Total SAS: Control vs. Experimental 22
Final Total SAS: Control vs. Experimental 22
Initial vs. Final Total SAS: Control Group 23
Total SAS: Control vs. Experimental 23
Final Worry Score: Control vs. Experimental 25
Initial vs. Final Worry: Control Group 25
SAS Worry: Control vs. Experimental 26
SAS Concentration: Control vs. Experimental 27
Final Somatic Anxiety: Control vs. Experimental 29
SAS Somatic Anxiety: Control vs. Experimental 30
Initial Global Stress: Control vs. Experimental 32
Initial Global Recovery: Control vs. Experimental 33
Final Global Stress: Control vs. Experimental 33
Global Stress: Control vs. Experimental 34
vii
List of Tables
Table 1. Experimental Group 2,000 Meter Ergometer Test Results 17
Table 2. Control Group 2,000 Meter Ergometer Test Results 17
Table 3. Total SAS Scores: Control vs. Experimental 21
Table 4. Worry Scores: Control vs. Experimental 24
Table 5. Concentration Scores: Control vs. Experimental 26
Table 6. Somatic Anxiety Scores: Control vs. Experimental 28
Table 7. Global Stress Scores: Control vs. Experimental 31
Introduction
Athletic performance and success are commonly associated with an athlete's level of physical fitness, training intensity, and physical traits.1 While factors such as
cardiovascular health, strength conditioning, genetic traits, and nutrition have a major impact on performance, the cognitive portion of training and athletic success is not as prominently considered. Studies from the last quarter century demonstrate intrinsic and extrinsic psychological factors play important roles in athletic performance due to their ability to induce short-term and long-term physiological and emotional changes.2,3,4 One
of the most influential and common cognitive factors is stress, which stimulates a plethora of physiological responses throughout the entire body.
Stress is the natural response to stressors such as athletic competition. It acts as both a behavioral and physiological response to any danger to homeostasisa and
established physiological set pointsb.5 While many stressors such as a rise in ambient
temperature are physical and invoke a physical response, other stressors such as competitive pressure or upcoming deadlines are mental, not physical. Mental stressors cause physiological and/or emotional responses as a method of adaptation. Short-term activation of the stress response yields beneficial results via activation of the autonomic nervous system (ANS)cwhich regulates essential systems such as the cardiovascular
system and respiration.6 Another part of the nervous system that works in conjunction
a Homeostasis: Maintenance of internal stability in response to external changes
b Physiological set point: Naturally determined value around which homeostasis is maintained
c Autonomic nervous system: Component of the nervous system which maintains control of unconscious bodily functions
2
with the autonomic nervous system is the sympathetic nervous system (SNS)dwhich
innervates much of the body’s viscera and is responsible for the stress-induced release of various regulatory neurotransmitters such as noradrenaline and acetylcholine.7 The
physical response to any stressor is also the result of neural activation and secretion of a myriad of hormones.8 The combination of neurotransmitters and hormones produce the
classic hallmarks of the fight-or-flight response: increased heart rate, quicker breathing, vasodilation, glucose release, and lipid breakdown. This biological response is
beneficial in the short term, allowing humans to survive dangerous situations. The presence of many external stressors, however, increase the probabilityof a prolonged stress response, oftentimes accompanied by significant negative consequences.
Chronic, i.e., sustained, stress is disruptive and damaging to the body. An
extended stress response can lead to chemical imbalance and physiological overexertion resulting from the inability to either halt the stress response or habituate to a stressor.9
Stress disrupts the day-to-day regulatory activities of the CNS and causes imbalances in chemical signals such as glucocorticoidse, proinflammatory cytokinesf, and
catecholaminesg that not only return the body to homeostasis but are also responsible
for proper function of the immune system and tissue upkeep. The negative, downstream effects of long term stress include, but are not limited to, sleep deprivation, anxiety, poor memory retention, decreased physical ability, and poor cognitive ability, as a result
d Sympathetic nervous system: Component of the ANS which is responsible for the “fight” response of the fight-or-flight response through actions such as increasing heart rate, raising blood pressure, etc. e Glucocorticoids: Class of hormones which regulate the metabolism of fuel sources such as carbohydrates, proteins, and fats
f Proinflammatory cytokines: Signaling molecule released by immune cells to increase inflammation g Catecholamines: Class of neuromodulators including the transmitters norepinephrine and dopamine and the hormone epinephrine
3
of mediator activity and glial cellh loss in various areas of the brain.10 These effects are
detrimental to both everyday life and competitive athletic performance.
The interdisciplinary science of sports psychology has gained traction in the previous two decades as the direct effect of psychology on physiology, kinesiology, and biomechanics became increasingly apparent.11 Since then, various methods of mental
training have been proposed and examined to determine their effects on exercise physiology and competitive performance with different mental training methods yielding varying degrees of success.11 For example, a study on triathletes found
significant improvement in competition performance after training mental skills such as goal setting, relaxation, imagery, and self-talk.12 Another study with competitive
swimmers found significant improvement in various swimming strokes in addition to overall psychological health following a psychological skills training program that developed goal setting, visualization, relaxation, concentration, and thought stoppingi.13
While there are a variety of common techniques used in sports psychology
interventions, one problem is the variability of implementation and interpretations of these techniques.14 The field is increasingly being used for anger management, stress
management, and general coaching to give athletes a mental edge in competition.14 A
number of more standardized and tangible techniques are currently undergoing testing to research their effects.15,16
One such method is progressive muscle relaxation (PMR), which reduces muscular tension and therefore alleviates some anxiety.15 PMR follows a standard
guided procedure of systematically reducing muscular tension in 15 major muscle
h Glial cell: Nervous system cells that surround and support neurons
4
groups.17 PMR has gained credibility as a potentially-useful technique because several
studies have demonstrated positive effects on medical patients, including the quality of life of cancer patients, coronary artery bypass graft surgery patients, pulmonary arterial hypertension patients, and other groups suffering from various ailments.18,19,20This
stress reduction technique has slowly expanded to the realm of sports psychology as a recovery enhancing skill. It has shown some success in athletes ranging from soccer players, to competitive pistol-shooters, to volleyball players.14,21,22,23,24,25
Rowing is a psychologically and physically taxing activity that, at the junior and collegiate levels, requires complete commitment for most of the year. Collegiate rowing teams train on water using their racing shells throughout the fall and spring to improve endurance, strength, and rowing technique. Technique is a crucial component of racing, as the rowing stroke is a highly cyclic and technical process requiring refined
movements. While a rigorous training program is used year-round, the winter season contains the most intense physical training in preparation for the primary spring regatta season. The bulk of winter training is done indoors on rowing machines, also referred to as ergometers, with water practice intermixed if weather conditions allow. Winter training also includes heavy plyometric trainingj and strength conditioning. The higher
physical demand and repetitiveness of ergometerk work for months often causes burnout
and a general increase in stress over time. In addition, the reduction in the amount of sleep due to the early morning workouts demanded by coaches further increases stress.
j Plyometric training: Exercises consisting of quick and maximal force motions intended to increase power output
5
One hallmark of competitive rowing at junior and collegiate levels is the 2,000-meter time trial sprint using an ergo2,000-meter. Ergo2,000-meter tests are conducted as a form of standardized testing either monthly or bimonthly by coaches to gauge a rower’s athletic ability for crew selection purposes. Ergometer tests are also used year-round to measure the power output and mental toughness of a rower, as well as to assess a rower’s
improvement in athletic ability. Many individual metrics such as wattage output per 500 meters are recorded by the ergometer. It has been suggested that the physiological strain from rowing a 2,000-meter sprint is approximately equal to playing two basketball games back-to-back.26
A 2,000-meter time trial requires maximum usage of a person’s anaerobic and aerobic capacities, along with a large percentage of overall body muscle mass.27 During
these tests, which last 6-7 minutes, a rower can only rely on their anaerobic abilities for the first 1.5-2 minutes due to limitations on the body’s natural phosphagen and
glycolytic energy systemsl, and must fall back on aerobic strength and endurance for the
remainder. It is obvious even to the casual observer that significant amounts of physical training and psychological resilience are required for optimal performance. For this reason, endurance workouts make up the bulk of rowing training, with up to about 30% consisting of anaerobic threshold (AT)mand maximal effort interval training.28
It has recently been acknowledged that mental characteristics play a larger role in competition performance than previously thought.29,30 It is necessary to have a high
l Phosphagen and glycolytic energy systems: Metabolic systems which provide energy for rapid, powerful exercises and do not require oxygen
m Anaerobic threshold: Also known as “lactate threshold,” where lactic acid begins to rapidly build up in the muscles and anaerobic (non-oxygen-requiring) metabolic systems become dominant over aerobic (oxygen-requiring) systems
6
degree of mental strength, self-motivation, and self-awareness for success in ergometer testing and competition.27 However, mental training is rarely widely implemented or
considered in training plans at the collegiate level. The magnitude of training, up to 1,000 hours per year, has a direct correlation with a substantial elevation in stress and lowered absolute recovery as determined by a study performed with the German Olympic National Team.31 Another study performed on the German Junior National
Rowing Team demonstrated that an implemented cycle of carefully timed stressful workouts and tests with adequate recovery periods prevent not only burnout and
underperformance, but enable the athlete to have peak physical and mental performance during competition.31 As a result of this study, the stress-recovery cycle training plan—
3 weeks of heavy load, 1 week of recovery load cyclic training—has recently become widely accepted. Another study on the University of British Columbia men’s rowing team involving Restricted Environment Stimulation Therapy (REST) in floatation tanks as a stress-reducing technique yielded significant performance on individual ergometer tests.32 Unfortunately, these tanks are not widely available or accessible for the majority
of club rowing teams and a more viable, less expensive option needs to be explored to determine whether external stress reducing exercises correlate with significantly increased athletic performance.
This study used PMR as a means to explore the role of stress reduction
techniques in improving athletic performance in collegiate rowers. Individual members of the subject pool, consisting of varsity male rowers with at least one year of prior rowing experience, were randomly assigned to either perform PMR or not over the study period of 3 months. The 2,000-meter test performances of all athletes were
7
recorded, standardized, and analyzed for significant differences over time. Athletic stress was determined via two questionnaires, the Sports Anxiety Survey (SAS) and the RESTQ-77 Sports Survey (RESTQ-77), which were taken at three points in the study: the beginning, middle, and end. The questionnaire results were aggregated and analyzed for significance. Upon statistical testing of ergometer test performance and the stress questionnaires, it was determined that progressive muscle relaxation did not result in a significant reduction of athletic stress and anxiety in this three-month study.
8
Hypothesis
Incorporating PMR techniques into an existing cardiovascular and strength conditioning training program will improve the athletic performance of male collegiate rowers over time.
9
Materials and Methods
Participants
The University of Oregon men’s varsity club rowing team at the time of the study consisted of 10 rowers and 3 coxswains. Coxswains were excluded from this study because they do not actively participate in time trials or strength conditioning. All subjects were male with ages ranging from 18 to 22 years old. All rowers had at least one year of previous rowing experience, collegiate or otherwise. All participants gave written informed consent to participate in this study in accordance with the University of Oregon Institutional Review Board, which gave its official approval of the study’s protocols and experimental design.
Experimental and Control Group Selection
The 11 subjects were assigned randomly-generated 3-digit identification numbers and were then randomly distributed into either the experimental (n=6) or control group (n=5). Eachexperimental subject performed progressive muscle relaxation training twice a week as a supplemental activity in addition to ongoing cardiovascular and strength conditioning. The control group continued with the normal cardiovascular and strength conditioning program without anyPMR training. All subjects completed the two questionnaires as requested during the study. One control subject was later dropped from the study due to reassignment as a coxswain, thus the final study assessed data from 10 subjects, 6 in the experimental group and the remaining 4 in the control group.
10 Stress Reduction Method
Each experimental subject followed a standardPMR audio script twice a week in a quiet environment(the PMR transcript is found in Appendix I). Eachparticipant was asked to tense various sequential muscle groups for 5-10 seconds until instructed to release and relax. This process and script involved visualization and awareness of the tightness, any soreness, breathing patterns, and the following relaxation. Total PMR duration was ~ 10 min per session.
2,000-meter time trial results
The coaching staff collected all four 2,000-meter time trial results. These tests were conducted at the discretion of the coaches as part of their training program. All time trials were performed at the exact same times at MacArthur Court for all subjects on Concept2 PM4/5 rowing ergometers, with drag factors set between 110 and 115. The drag factor measures flywheel deceleration and is the manufacturer’s standardization of the damper setting controlling airflow into the ergometer flywheel. All rowers
participated together in dynamic stretching and a 10-minute warm up on their assigned ergometers immediately prior to testing. The 2,000-meter tests were performed on the following dates: 2/2/2018, 2/16/2018, 3/24/2018, and 5/4/2018. The following data were directly recorded from the ergometer by coaching staff or were calculated from recorded values following each test:
• Weight (lbs.) – recorded immediately prior to the test
• Average 500-m/split time over 2,000m (minutes:seconds.milliseconds)
• Mean power output (watts)
11
The fitness score serves as the standardized metric of power output for this study. Research has shown that taller, heavier rowers have a performance advantage over shorter, lighter rowers due to extra length and strength on the drive phasewhere the rowers push with the legs and pull the handle with their back and arms.33A normalized
Fitness Score, based on a weight adjustment, was developed to calculate a value that standardizes rowers’ fitnessusing Equation 1.
𝐹𝐹𝐹𝐹𝐹𝐹𝐹𝐹𝐹𝐹𝐹𝐹𝐹𝐹 𝑆𝑆𝑆𝑆𝑆𝑆𝑆𝑆𝐹𝐹 (𝑘𝑘𝑘𝑘𝑊𝑊) =𝑀𝑀𝑀𝑀𝑀𝑀𝑀𝑀 𝑝𝑝𝑝𝑝𝑝𝑝𝑀𝑀𝑝𝑝 𝑝𝑝𝑜𝑜𝑜𝑜𝑝𝑝𝑜𝑜𝑜𝑜 (𝑊𝑊)(𝑊𝑊𝑊𝑊𝑊𝑊𝑊𝑊ℎ𝑡𝑡 (𝑙𝑙𝑙𝑙𝑙𝑙)
2.2 ).67
(1)
While larger rowers may have a quicker raw average split time, they weigh down a racing shell more than a smaller rower, and create drag34. A smaller rower who
produces a good power-to-weight ratio can be more efficient than a larger rower. The 500-meter mean times (split times) were immediately calculated and converted to power output by the Concept2 PM4/5 ergometer, the rowing machine used by the University of Oregon squad. The split per stroke is calculated using the mean angular velocity of the flywheel during the stroke. The conversion for split to power output as provided by Concept2 is shown in Equation 2.
𝑀𝑀𝐹𝐹𝑀𝑀𝐹𝐹 𝑝𝑝𝑆𝑆𝑝𝑝𝐹𝐹𝑆𝑆 𝑆𝑆𝑜𝑜𝐹𝐹𝑝𝑝𝑜𝑜𝐹𝐹 (𝑊𝑊) = 2.8
(𝑀𝑀𝑊𝑊𝑀𝑀𝑀𝑀500𝑙𝑙𝑠𝑠𝑙𝑙𝑊𝑊𝑡𝑡𝑚𝑚 (𝑙𝑙))3 (2)
Mean power output for each subject was automatically calculated by the ergometer, which averaged the power output of every stroke over the 2,000-meter test. Ergometer-generated mean power output valueswere recorded for each individual in the study for all four 2000-meter ergometer tests. Using the mean power output value, each subject’s fitness score was calculated using Equation 1 and a mean fitness score
12 Sport Anxiety Scale (SAS)
Each participant in the studyindependently took a Sport Anxiety Scale (SAS) survey three times during the test period. The test was administered upon the initiation of the study (2/4/2018), in the middle of racing season in March (3/24/2018), and immediately prior to the end of the study in May (5/4/2018). Subjects electronically took the SAS survey in one sitting in an environment free of distractions.
The SAS measures athletic anxiety levels using 21 questions divided into three subcategories: Somatic Anxiety, Worry, and Concentration Disruption (Appendix II). The SAS categories were designed by Smith et al., 35in the following manner:
• Worry: determines cognitive anxiety from psychological concerns about poor performance and the associated effects (7 questions)
• Concentration Disruption: determines cognitive anxiety from perceived difficulty focusing during competition or training (5 questions)
• Somatic Anxiety: determines stress/anxiety-related autonomic action in the stomach and muscles (9 questions)
SAS uses a four-point Likert scale with responses ranging from 1 (Not at all), to 4 (Very much so). The SAS survey was administered using Google Forms, and the results for each survey were exported to Microsoft Excel for statistical analysis. The
subcategory scores for each subject were determined by summing the responses for items associated per subcategory and finding the mean score between 1 and 4 for each category. The Total Somatic Anxiety score (Total SAS) represents the mean score of all 19 responses. The specific questions corresponding to each subcategory are listed in the Appendix.
13
Recovery-Stress Questionnaire for Athletes (RESTQ-77)
All participants took a Recovery-Stress Questionnaire for Athletes-Sport (RESTQ-77 Sport) test.36. The RESTQ-77 Sport test measures the recovery-stress state
of athletes using a 77-question survey (AppendixIII). RESTQ-77 results reveal the level of physical and mental exhaustion in athletes, and their capabilities to use individual strategies for recovery. The RESTQ-77 Sport uses 19 different categories, listed below, to determine and associate stress frequency and recovery activity frequency.
• General stress • Emotional stress • Social stress • Conflicts/pressure • Fatigue • Lack of energy • Physical complaints • Success • Social recovery • Physical recovery • General well-being • Sleep quality • Disturbed breaks • Burnout/emotional exhaustion • Fitness/injury • Fitness/being in shape • Burnout/personal accomplishment • Self-efficacy • Self-regulation
Detailed descriptions of each category as described by Kellmanet al.,36can be
found in Appendix IV.Each 77 RESTQ-77 question utilizes a 6-point Likert scale ranging from 1 (never) to 6 (always), and addresses activities within the 3 days and nights of the questionnaire date. The RESTQ-77 Sport questionnaire was administered in the same manner as the SAS survey, namely using Google Forms and was sent to
14
subjects at the same time. The categorical scores for each subject were determined by summing the responses for items associated per category and finding the mean score between 1 and 6 for each category.
Overall means for the control group and the experimental group were calculated for each subcategory for each of the three RESTQ-77 surveys. To provide a
simplerrepresentation of athletic stress and recovery, the subcategories were combined to indicate global stress and global recovery for group comparison based on the
suggestion of the RESTQ-77 authors. Category scores were calculated by generating the mean of the scores of individual subjects’ general and sport-specific categories to calculate a global mean between 1 and 6 for each group. The categories are as follows:
• Global stress: General stress, emotional stress, social stress,
conflicts/pressure, fatigue, lack of energy, physical complaints, disturbed breaks, burnout/emotional exhaustion, fitness/injury
• Global recovery: Success, social recovery, physical recovery, general well-being, sleep quality, fitness/being in shape, burnout/personal
accomplishment, self-efficacy, self-regulation
These calculations were repeated for the questionnaire results at all 3 timepoints to determine global stress and recovery in each group.
Statistics
Unpaired 2-sample t-tests assuming unequal variances (p ≤ 0.05, α = 0.05) were performed using individual data for the following to determine if there was a significant difference between the control and experimental groups:
15
• Initial fitness scores
• Intermediate fitness scores
• Final fitness scores
• Initial SAS worry scores
• Intermediate SAS worry scores
• Final SAS worry scores
• Initial SAS concentration disruption scores
• Intermediate SAS concentration disruption scores
• Final SAS concentration disruption scores
• Initial SAS somatic anxiety scores
• Intermediate SAS somatic anxiety scores
• Final SAS somatic anxiety scores
• Initial total SAS scores
• Intermediate total SAS scores
• Final total SAS scores
• Initial RESTQ-77 global stress scores
• Intermediate RESTQ-77 global stress scores
• Final RESTQ-77 global stress scores
• Initial RESTQ-77 global recovery scores
• Intermediate RESTQ-77 global recovery scores
• Final RESTQ-77 global recovery scores
Paired 2-sample t-tests for means (p ≤ 0.05, α = 0.05) using individual data were also performed within each group to compare whether there was a significant change in the previously listed scores within groups between the initial and final tests.
16
Results
The Effect of PMR on Mean Power and Fitness Score
To assess the effectiveness of stress reduction techniques on rowing
performance, rowers were divided into two groups as described in the Materials and Methods section. Each experimental group rower (n=6) performed PMR twice a week each week for three months. In contrast, rowers in the control group (n=4) did not engage in any formal stress reduction techniques during the study period. Rowing performance was measured four times during the three-month test period by means of a 2000-meter indoor rowing test using state-of-the-art ergometers which automatically generated mean power and fitness data for each rower during each of the four 2000-meter tests (see the Materials and Methods section for details). The average mean power and fitness values for each group were calculated for each of the four 2000-meter tests, and T-tests were utilized to determine statistical significance.
There were no statistically significant differences in mean power values across the four 2000-meter ergometer trials either in the experimental or control groups or when the two groups were compared to each other at any time point (Figure 1; Tables 1 & 2). There were also no statistically significant differences in mean fitness scores between the control and experimental groups at the first (Figure 2) and final (fourth; Figure 3) 2000-meter trial. The only positive results were thatthe mean fitness scores of the fourth (final) 2000-meter trial weresignificantly higher than thoseof the first trial of the same group for both the experimental subjects (Table 1 and Figure 4) and controls (Table 2 and Figure 5).
17
Table 1. Experimental Group 2,000 Meter Ergometer Test Results Trial Mean Power ± SEM (W) Mean Weight ± SEM
(lbs.) Mean Fitness Score ± SEM (W/kg)
1 306 ± 3.99 165.06 ± 1.37 16.96 ± 0.19*
2 311.33 ± 4.47 164.85 ± 1.38 17.26 ± 0.19
3 316 ± 4.79 165.58 ± 1.48 17.47 ± 0.21
4 321 ± 4.61 163.17 ± 1.49 17.92 ± 0.19*
Table 1. Mean ergometer data compiled from experimental group (n=6) between the initial and final test. *There was a significant difference in mean fitness scores between initial and final test (p<0.01). The four trials were performed on 2/2/2018 (Trial 1), 2/16/2018 (Trial 2), 3/24/2018 (Trial 3), and 5/4/2018 (Trial 4).
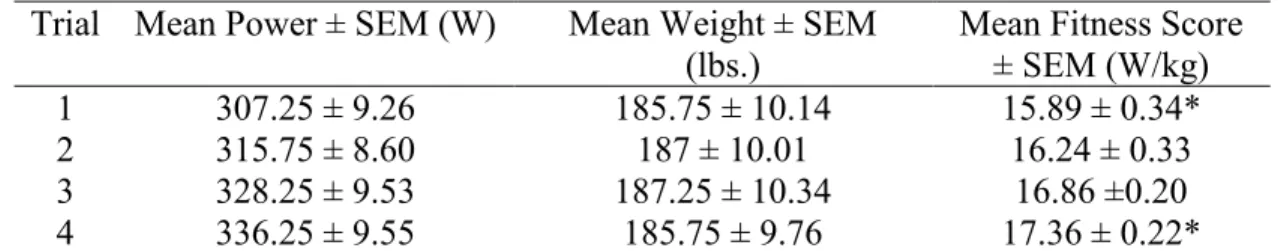
Table 2. Control Group 2,000 Meter Ergometer Test Results Trial Mean Power ± SEM (W) Mean Weight ± SEM
(lbs.) Mean Fitness Score ± SEM (W/kg)
1 307.25 ± 9.26 185.75 ± 10.14 15.89 ± 0.34*
2 315.75 ± 8.60 187 ± 10.01 16.24 ± 0.33
3 328.25 ± 9.53 187.25 ± 10.34 16.86 ±0.20
4 336.25 ± 9.55 185.75 ± 9.76 17.36 ± 0.22*
Table 2. Mean ergometer data compiled from control group (n=4) between the initial and final test. *There was a significant difference in mean fitness scores between initial and final test (p<0.01).). The four trials were performed on 2/2/2018 (Trial 1), 2/16/2018(Trial 2), 3/24/2018 (Trial 3), and 5/4/2018 (Trial 4).
18
Figure 1. Fitness scores of the control group (n=4, orange) and experimental group (n=6, blue) from the four ergometer tests (2/2/2018(Test1), 2/16/2018 (Test 2), 3/24/2018 (Test 3), 5/4/2018 (Test 4)).Each data point represents the fitness score from one individual. The trend line is included for visual purposes only.
Figure 2. Mean fitness scores of the control (n=4; orange) and experimental (n=6; blue) groups during the initial 2,000-meter test run on 2/2/2018. Each histogram represents the mean fitness score ± SEM.
12 13 14 15 16 17 18 19 20 1 2 3 4 Fi tn ess S co re (W /k g) Test
Fitness Score: Experimental vs. Control
12 13 14 15 16 17 18 19 20 Experimental Control Fi tn ess sc or e ( W /k g) Group
19
Figure 3. Mean fitness scores of the control (n=4; orange) and experimental (n=6; blue) groups during the final 2,000-meter test run on 5/4/2018. Each histogram represents the mean fitness score ± SEM.
Figure 4. Mean fitness scores of the experimental group (n=6) calculated from the results of the initial (light blue) and final (dark blue)2,000-meter tests. Each histogram represents the mean fitness score ± SEM. *Significant difference at p<0.01.
12 13 14 15 16 17 18 19 20 Experimental Control Fi tn ess sc or e ( W /k g) Group
Final Fitness Score: Experimental vs. Control
12 13 14 15 16 17 18 19 20 Initial (2/2/18) Final (5/4/18) Fi tn ess sc or e ( W /k g) Test Date
Initial vs. Final Fitness Score: Experimental
Group
20
Figure 5. Mean fitness scores of the control group (n=4) calculated from the results of the initial (light orange) and final (dark orange)2,000-meter tests. Each histogram represents the mean fitness score ± SEM. *Significant difference at p<0.01.
Sport Anxiety Scale Results
The Sport Anxiety Scale (SAS) survey was administered to all rowers to assess the effect of PMR on rowers’ stress levels. The SAS was given three separate times, at the beginning of the study immediately prior to the initiation of PMR (2/4/2018), midway through the 3-month study period (3/24/2018) and after the final 2000-meter ergometer test (5/4/2018).
The results from all survey questions were tabulated for each individual and a total SAS score, called the total sports anxiety score (total SAS score), was calculated as described in the Materials and Methods section. Each individual total SAS score was calculated from the mean of all survey responses and represents an individual’s
perceived anxiety. An elevated total SAS represents higher overall anxiety (somatic and 12 13 14 15 16 17 18 19 20 Initial (2/2/18) Final (5/4/18) Fi tn ess sc or e ( W /k g) Test Date
Initial vs. Final Fitness Score: Control Group
21
cognitive). T-tests were performed to determine statistical significance as described in the Materials and Methods section.
There were several significant differences in total SAS score between and within groups (Tables 3-6). The experimental group showed a significantly higher total SAS score than the controls at all time points (Table 3 and Figures 6 & 7). Additionally, the control group showed a significantly lower total SAS score at the study’s conclusion than at the beginning (Table 3 and Figure 8).
Table 3. Total SAS Scores: Control vs. Experimental
Test Total Control SAS Score ± SEM Total Experimental SAS Score ± SEM
1 2.08 ± 0.33 2.48 ± 0.26§
2 1.73 ± 0.48 2.62 ±0.23§
3 1.81 ±0.49♦ 2.55 ± 0.19§
Table 3. Mean total SAS scores of the control (n=4) and experimental (n=6) groups compiled from the initial, intermediate, and final SAS questionnaires. The SAS questionnaire was administered on 2/4/2018 (Test 1), 3/24/2018 (Test 2), and 5/4/2018 (Test 3). Means fall on a scale between 1-4, where 1 represents “Strongly Disagree” and 4 represents “Strongly Agree.” §Significant difference between control and
experimental groups at p<0.01.♦Significant difference between initial and final score at p<0.05.
22
Figure 6. Mean total SAS scores of thecontrol (n=4; orange) and experimental (n=6; blue)groups from the initial SAS test (2/4/18). Each histogram represents mean total SAS score ± SEM. *Significant difference at p<0.01.
Figure 7. Mean total SAS scores of the control (n=4; orange) andexperimental (n=6; blue) groupsfrom the final SAS test (5/4/18). Each histogram represents mean total SAS score ± SEM. *Significant difference at p<0.001.
0 1 2 3 4 Experimental Control Tota l A nxie ty S cor e Group
Initial Total SAS: Control vs. Experimental
*
0 1 2 3 4 Experimental Control Tota l A nxie ty S cor e GroupFinal Total SAS: Control vs. Experimental
23
Figure 8. Mean total SAS scores of the control group (n=4) from the initial (light orange) and final (dark orange)SAS tests. Each histogram represents mean total SAS score ± SEM. *Significant difference at p<0.05.
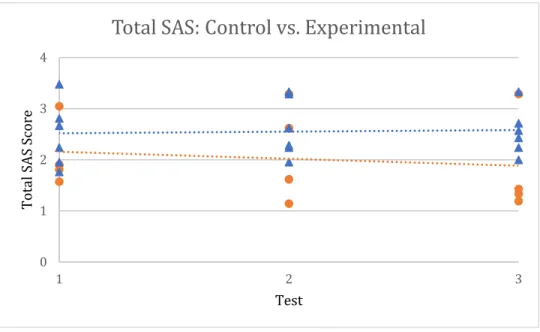
Figure 9. Total SAS scores of the control group (n=4, orange) and experimental group (n=6, blue) from the three SAS administrations (Test 1, 2/4/2018; Test 2, 3/24/2018; and Test 3, 5/4/2018). Each data point represents the Total SAS score from one individual. 0 1 2 3 4 Initial (2/4/18) Final (5/4/18) Tota l A nxie ty S cor e Test Time
Initial vs. Final Total SAS: Control Group
*
0 1 2 3 4 1 2 3 To ta l SA S Sc or e Test24
The SAS can be subdivided into three different categories (worry, concentration disruption, and somatic anxiety) based on the type of question asked in the survey (see Materials and Methods sectionfor details and Appendix IIfor a list of the SAS
questions). A larger worry score signifies a higher presence of perceived cognitive anxiety arising from psychological concerns regarding performance.The experimental worry score was significantly higher than that of the control group for the intermediate and final questionnaires (Table 4 and Figure 10). A significantly lower worry score was also observed during the final SAS questionnaire by the control group compared to its initial score (Table 4 and Figure 11).
Table 4. Worry Scores: Control vs. Experimental
Test Total Control Worry Score ± SEM Total Experimental Worry Score ± SEM
1 2.39 ± 0.37 2.71 ± 0.31
2 1.86 ± 0.63 3.21 ± 0.24§
3 1.79 ± 0.50♦ 3.02 ± 0.21§
Table 4. Mean worry scores of the control (n=4) and experimental (n=6) groups compiled from the initial, intermediate, and final SAS questionnaires. The SAS questionnaire was administered on 2/4/2018 (Test 1), 3/24/2018 (Test 2), and 5/4/2018 (Test 3). Means fall on a scale between 1-4, where 1 represents “Strongly Disagree” and 4 represents “Strongly Agree.” The higher the worry score, the higher the perceived level of psychological anxiety. §Significant difference between control and
experimental groups at p<0.01.♦Significant difference between initial and final score at p<0.05.
25
Figure 10. Mean worry scores of the control (n=4; orange) and experimental (n=6; blue) groupsfrom the final SAS test (5/4/18).Each histogram represents mean worry score ± SEM. *Significant difference at p<0.001.
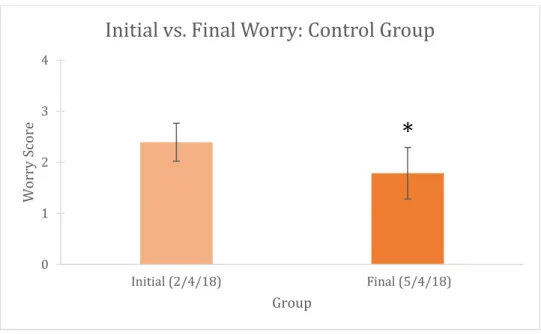
Figure 11. Mean worry scores of the control group (n=4) from the initial (light orange) and final (dark orange)SAS tests. Each histogram represents mean worry score ± SEM. *Significant difference at p<0.05. 0 1 2 3 4 Experimental Control W orry S co re Group
Final Worry Score: Control vs. Experimental
0 1 2 3 4 Initial (2/4/18) Final (5/4/18) W orry S co re Group
Initial vs. Final Worry: Control Group
*
*
26
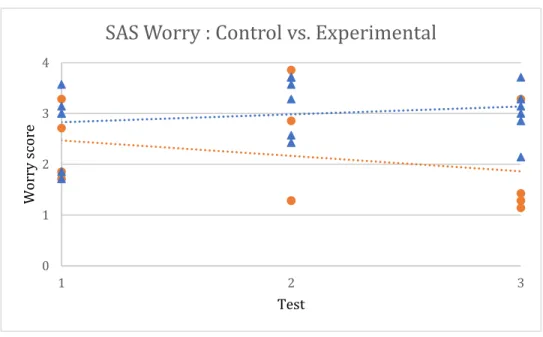
Figure 12. SAS Worry sub scores of the control group (n=4, orange) and experimental group (n=6, blue) from the three SAS administrations (Test 1, 2/4/2018; Test 2, 3/24/2018; and Test 3, 5/4/2018). Each data point represents the worry sub score from one individual.
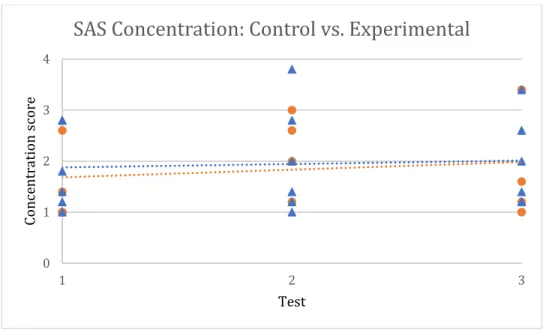
The second SAS sub score focuses on concentration. A higher concentration score suggests higher concentration disruption or cognitive anxiety from a perceived difficulty in focusing. Statistical analysis showed no significant difference in this category between or within groups at any point in time (Table 5).
Table 5. Concentration Scores: Control vs. Experimental Test Total Control Concentration Score ±
SEM Total Experimental Concentration Score ± SEM
1 1.5 ± 0.38 1.83 ± 0.32
2 1.76 ± 0.39 2.03 ± 0.44
3 1.8 ± 0.55 1.97 ±0.36
Table 5. Mean concentration disruption scores of the control (n=4) and experimental (n=6) groups compiled from the initial, intermediate, and final SAS questionnaires. The SAS questionnaire was administered on 2/4/2018 (Test 1), 3/24/2018 (Test 2), and 5/4/2018 (Test 3). Means fall on a scale between 1-4, where 1 represents “Strongly Disagree” and 4 represents “Strongly Agree.” The higher the concentration score, the greater the perceived cognitive anxiety.
0 1 2 3 4 1 2 3 W orry sc ore Test
27
Figure 13. SAS Concentration sub scores of the control group (n=4, orange) and experimental group (n=6, blue)from the three SAS administrations (Test 1, 2/4/2018; Test 2, 3/24/2018; and Test 3, 5/4/2018). Each data point represents the concentration sub score from one individual.
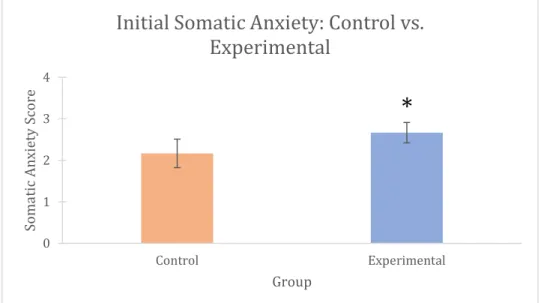
A higher somatic anxiety score, the third SAS sub score, quantifies stress- or anxiety-related autonomic nervous system functioning of the stomach and muscles.The experimental group had a significantly higher somatic anxiety score than the control group at each of the three questionnaires (Table 6 and Figures 14 & 15). No significant differences within groups were detected (Table 6).
0 1 2 3 4 1 2 3 Con ce ntr ation s cor e Test
28
Table 6. Somatic Anxiety Scores: Control vs. Experimental Test Total Control Somatic Anxiety Score ±
SEM Total Experimental Somatic Anxiety Score ± SEM
1 2.17 ± 0.34 2.67 ± 0.25§
2 1.62 ± 0.44 2.48 ± 0.24*
3 1.83 ±0.48 2.5 ±0.23§
Table 6. Mean concentration disruption scores of the control (n=4) and experimental (n=6) groups compiled from the initial, intermediate, and final SAS questionnaires. The SAS questionnaire was administered on 2/4/2018 (Test 1), 3/24/2018 (Test 2), and 5/4/2018 (Test 3). Means fall on a scale between 1-4, where 1 represents “Strongly Disagree” and 4 represents “Strongly Agree.” The higher the concentration score, the higherthe perceived cognitive anxiety. *Significant difference between control and experimental groups at p<0.05. §Significant difference between control and experimental groups at p<0.01.
Figure 14. Mean somatic anxiety scores of thecontrol (n=4; orange) and experimental (n=6; blue) groupsfrom the initial SAS test (2/4/18).Each histogram represents mean somatic anxiety score ± SEM. *Significant difference at p<0.01.
0 1 2 3 4 Experimental Control Soma tic A nxie ty S cor e Group
Initial Somatic Anxiety: Control vs.
Experimental
29
Figure 15.Mean somatic anxiety scores of the control (n=4; orange) and experimental (n=6; blue) groups from the final SAS test (5/4/18). Each histogram represents mean somatic anxiety score ± SEM.*Significant difference at p<0.001.
0 1 2 3 4 Experimental Control Soma tic A nxie ty S cor e Group
Final Somatic Anxiety: Control vs.
Experimental
30
Figure 16. SAS somatic anxiety sub scores of the control group (n=4, orange) and experimental group (n=6, blue) from the three SAS administrations (Test 1, 2/4/2018; Test 2, 3/24/2018; and Test 3, 5/4/2018). Each data point represents the somatic anxiety sub score from one individual.
Recovery-Stress Questionnaire for Athletes Results
The Recovery-Stress Questionnaire (RESTQ-77 Sport) was administered to all rowers to assess the effect of PMR on rowers’ perceived stress and recovery levels. The RESTQ-77 Sport was given three separate times concurrent with the SAS, at the
beginning of the study immediately prior to the initiation of PMR (2/4/18), midway through the 3-month study period (3/24/18), and after the final 2000-meter ergometer test (5/4/18). Survey results were analyzed for each individual as described in the Materials and Methods section and subdivided into two separate categories, Global Stress and Global Recovery. Global Stress refers to an individual’s perceived stress levels, whereas Global Recovery is a measure of the ability of the athlete to recover from athletic training.Individual Global Stress and Global Recovery scores were
0 1 2 3 4 1 2 3 Soma tic A nxie ty sc or e Test
31
separately averaged for the experimental and control groups for each of the three survey tests, and these data are shown in Tables 5 & 6.
The experimental global stress scores were significantly higher than those of the controls forall three questionnaires (Table 7 and Figures 17&19). The initial
experimental initial global recovery score was also significantly larger than its control counterpart(Table 8 and Figures 18& 20). No other significant differences were observed.
Table 7. Global Stress Scores: Control vs. Experimental
Test Control Global Stress ± SEM Experimental Global Stress ± SEM
1 2.83 ± 0.29§ 3.58 ± 0.28§
2 3.34 ± 0.18* 3.75 ± 0.15*
3 2.78 ±0.14§ 3.72 ± 0.22§
Table 5. Mean global stress scores for the control (n=4) experimental group (n=6) from the initial (Test 1, 2/4/2018), intermediate (Test 2, 3/24/2018) and final (Test 3, 5/4/2018) RESTQ-77 Sport questionnaires. Means fall on a scale between 1-6, where 1 indicates “Never” and 6 indicates “Always.” A higher global stress score suggests higher athletic stress. *Significant difference between control and experimental groups at p<0.05. §Significant difference between control and experimental groups at p<0.01.
Table 8. Global Recovery Scores: Control vs. Experimental
Test Control Global Recovery ± SEM Experimental Global Recovery ± SEM
1 4.16 ± 0.15§ 3.62 ± 0.19§
2 3.57 ± 0.12 3.75 ± 0.20
3 3.70 ± 0.21 3.68 ± 0.15
Table 6. Mean global recovery scores for the control (n=4) experimental group (n=6) from the initial (Test 1, 2/4/2018), intermediate (Test 2, 3/24/2018) and final (Test 3, 5/4/2018) RESTQ-77 Sport questionnaires. Means fall on a scale between 1-6, where 1 indicates “Never” and 6 indicates “Always.” A higher global recovery score suggests lowered perceived recovery. §Significant difference between control and experimental groups at p<0.01.
32
Figure 17. Mean global stress scores of the control (n=4; orange)and experimental (n=6; blue)groups from the initial RESTQ-77 questionnaire (2/4/18). Each histogram represents mean global stress score ± SEM. *Significant difference at p<0.001.
0 1 2 3 4 5 6 Experimental Control Gl ob al S tr es s S cor e Group
Initial Global Stress: Control vs Experimental
33
Figure 18. Mean global recovery scores of the control (n=4; orange) and experimental (n=6; blue)groups from the initial RESTQ-77 questionnaire (2/4/18). Each histogram represents mean global recovery score ± SEM. *Significant difference at p<0.01.
Figure 19. Mean global stress scores of the control (n=4; orange) and experimental (n=6; blue)groupsfrom the final RESTQ-77 questionnaire (5/4/18). Each histogram represents mean global stress ± SEM. *Significant difference at p<0.001.
0 1 2 3 4 5 6 Experimental Control Gl ob al R ec ov er y Sc or e Group
Initial Global Recovery: Control vs
Experimental
*
0 1 2 3 4 5 6 Experimental Control Gl ob al S tr es s S cor e GroupFinal Global Stress: Control vs Experimental
34
Figure 20. Global stress scores of the control group (n=4, orange) and experimental group (n=6, blue) from the three RESTQ-77 administrations (Test 1, 2/4/2018; Test 2, 3/24/2018; and Test 3, 5/4/2018). Each data point represents the global stress from one individual.
Figure 21. Global recovery scores of the control group (n=4, orange) and experimental group (n=6, blue) from the three RESTQ-77 administrations (Test 1, 2/4/2018; Test 2, 3/24/2018; and Test 3, 5/4/2018). Each data point represents the global recovery score from one individual.
0 1 2 3 4 5 6 1 2 3 Gl ob al S tr ess sc or e Test
Global Stress: Control vs. Experimental
0 1 2 3 4 5 6 1 2 3 Gl ob al R ec ov er y sc or e Test
35
Discussion and Conclusion
This thesis tested the hypothesis that performing progressive muscle relaxation in conjunction with a standard training plan would improve a collegiate rower’s fitness score more than only following the same training plan without PMR. It was determined that progressive muscle relaxation exercises yielded no significant effects on either mean power or fitness score, and thus the hypothesis was not supported. It should be noted that there was an overall increase in fitness levels in both the experimental and control groups from the beginning to the end of the study period (Tables 1 & 2 and Figures 4 & 5). These increases are not surprising given the large amount of daily cardiovascular training by the rowers during the study period, which was in the middle of the rowing season.
There are several possible explanations for the lack of significant fitness results in this thesis. The most parsimonious explanation is that PMR at a twice-weekly
frequency did not have an impact on the long-term stress factors commonly observed in rowers, and therefore had no effect on athletic performance Another possible reason is the depth and variance of the subject pool. The initial subject pool was larger (n = 11), however, by the end of the study only data from 10 total subjects could be analyzed as other subjects were dropped for reasons ranging from quitting the team to reassignment to a non-rowing position (i.e., coxswain). The three-month period of the study also may have been insufficient to uncover a positive effect. The low number of subjects, the small number of data points, and the three-month period together may have prevented the ability of PMR to affect rowing performance. Although subjects provided verbal or written confirmation after performing PMR, it was impossible to directly supervise the
36
PMR process during the study. The possibility of subjects skipping some PMR sessions, not performing it to the best of their abilities, or performing the technique under
unconducive conditions is entirely plausible and may have impactedthe results. Coachingeffects andthe competitive demands of the sport are two
otherpotentialreasons for the lack of significant fitness improvements with PMR. During the first week of April, three experimental subjects were informed they would be officially entered as part of a lightweight crew for the remainder of the racing season through June. They were required to shed between 3-9 pounds of weight, ideally in a healthy manner, within 2.5-3 weeks while maintaining the identical training plan volume and intensity. A collegiate male rower needs around 6,000 calories a day to support the volume of training, and eating at a caloric deficit leads to impaired training and less glycogen, a major source of usable body energy.37, 38, 39The amount of acute
weight loss and exertion no doubt contributed to increased stress and negatively influenced performance to some extent as supported by the fitness score data (Table 1 and Figure 1). Because half of the experimental group and none of the controls were required to qualify for lightweight status, the consequences of the switch may have affected both the performance and stress of the experimental group during the latter study period.
The demands of lightweight rowing have come under recent scrutiny by the international rowing community due to the effects of excessive dehydration and dietary restrictions.40While the category was formed to provide a level playing field for less
physically advantaged athletes, teams at all levels have begun to enter athletes in the category who are not naturally lightweightto gain a competitive advantage.41 This has
37
resulted in athletes resorting to using coach-approved methods such as diuretics, “sweat suits,” consuming at a severe caloric deficit, or extreme dehydration.42Extreme weight
loss, sometimes required before competition weigh-ins, has been shown to contribute to declining muscle performance, fatigue, and cardiovascular weakness.43, 44Additional
studies have shown that energy deficiency in athletes correlates with increased irritability, depression, and decreased concentration.45
The first questionnaire, the Sport Anxiety Scale (SAS) was administered in the hope of revealing differences in anxiety levels between the experimental and control groups due to the PMR sessions. The application of PMR was expected to reduce somatic anxiety due to the sport’s highly physical nature. The worry score was also expected to decrease, as PMR is intended as a relaxation and stress reduction technique. Because ofthe reduction of both the somatic anxiety and worry components, the total SAS score was predicted to decrease. However, the somatic anxiety and total anxiety scores for the experimental group were consistently higher than the control group at all three time points (Figures 6, 7, 14, & 15 and Tables 3 & 6).While a constantly higher level of anxiety does not suggest much about the effectiveness of PMR, it does suggest the athletic performance of the experimental subjects may be hindered due to the consequences of physical and psychological anxiety. The worry score was higher for the experimental group during the intermediate and final SAS surveys as well, most likely due in part to the onset of racing season for all subjects and the necessity of making weight class for some. The significant decline in the worry and total SAS scores between the initial and final surveys by the controls, a group that did not include PMR
38
in its training, also supports the notion that PMR had no specific effect on reducing anxiety.
The second questionnaire, the RESTQ- 77 Sport was administered to determine the perceived stress and recovery of the groups over time. It was expected that stress would be reduced in the experimental group due to PMR, however, global stress was shown to be higher in the experimental group at all points compared to control values. The same reasons discussedpreviously for the fitness results (e.g., small subject pool, short study period) may alsoapply to the global stress results. Another possible
explanation for the lack of stress reduction between the experimental and control groups is that PMR may only have either a very short- (~24 hours) impact, or it does not take effect until it has been practiced for more than three months on stress and as a result was not detectable in this study. The change in status by some of the rowers to a lightweight class may have also increased anxiety in the experimental group and counteracted any stress-reducing effects of PMR, as stated previously.
Perceived physical and mental recovery as measured by the RESTQ-77 Sport questionnaire did not change significantly during the testing period within groups. The only significant difference observed was that the global recovery score of the control group in the initial questionnaire was higher than that of the experimental group. These resultscould be attributed to a constant exercise volume and intensity throughout the winter and spring study period. While winter training involved more difficult
ergometric workouts, the spring season’s somewhat easier water practices were
supplemented by harder supplemental workouts and constant racing and travel, leaving little leeway for additional recovery.
39
An unexpected and interesting result was that increased stress levels were detected byboth the SAS and RESTQ-77 questionnaires for the experimental group (Figures 9 & 20). This result might be attributed to the pressures of becoming a
lightweight, with constant morning weigh-ins, high diet regulation, and meeting regatta weight standards. It is also entirely possible that extracurricular activities such as independent exercises and hobbies contributed to athletic anxiety and worry, especially since a higher number of experimental subjects anecdotally reported participating in campus intramural sports. Academic demands also most likely played a role in increasing stress as the intermediate and final tests were performed during peak exam times.
A large amount of variability in the questionnaire data was noted, and some of this variability must obviously be attributed to the small number of participants in each group. In addition, each individual’s perception of racing, testing, and/or boat and seat selection could have further contributed to the high variability of the data. For example, some individuals had a solid seat in their respective boat for the entire rowing season, whereas for others, seating assignments were less stable and could possibly be lost to another, higher performing athlete. This uncertainty most likely contributed to increasing anxiety and stress levels. It should also be noted that boat assignments are usually solidified towards the end of the season. As a result,some rowers may not be inclined to perform at maximal effort late in season due to the set boat lineups. This unethical yet not uncommon practice, known as “sandbagging,” could have affected the fitness score of any individual and therefore, the mean group fitness score.
40
The previously discussed limitations of this study provide a foundation for an improved future workon this interesting subject. The very small sample size proved problematic because the variance in the data was prominent enough to potentially shift results in either direction. A larger sample size is essential to improve accuracy. A future study should also limit study participants to either heavyweight or lightweight rowers to minimize the additional confounding stress associated with lightweight rowing. A longer study period, perhaps over an entire year or more, is probably
necessary to determine whether PMR has any long-term effects that may not have been revealed in 3 months. Because this study was done under normal day-to-day conditions, many external factors were mostly unregulated and likely had an impact on both
physical and psychological results. For example, factors such as amount of sleep or diet can heavily impact both physical and psychological health and change how an athlete performs on any given day. These two factors were impossible to regulate in the limited scope of this study. For more accurate results, subjects’ exercise regimens should also be strictly regulated, as any extracurricular activities such as additional weight lifting or cardiovascular training outside of practice can substantially improve an athlete’s fitness level over time. In a collegiate setting, external factors such as class schedule rigor, employment responsibilities, family issues, and social relationships can also heavily impact psychological health and performance. Any future study should be conducted with a large, tightly controlled sample size with controlled environmental factors over a longer period.
In conclusion, this relatively brief study found performing progressive muscle relaxation twice a week did not have any significant effect on reducing athletic stress. A
41
myriad of external confounding factors may have caused these negative results. While this study suggests progressive muscle, relaxation does not help improve the athletic performance of a male collegiate rower, the possibilities of improving performance through improvement of psychological health should not be overlooked. The effects, or lack thereof, of other stress reduction techniques or even PMR should be examined in more controlled environments.
42
Appendices
Appendix I: PMR Transcript – Adapted from UC Berkeley School of Law PMR Script
Begin by allowing your body to get more comfortable wherever you are right now. Take some full slow breaths in through your nose and out through your mouth. Allow any distracting thoughts to come and go as if you're watching them floating down a stream and guide your attention back to your slow and easy breathing.
When you're ready, breathe in and make a tight fist with your right hand. Hold and focus on what that tension feels like to you now.
(5 s)
Breathe out and release all the tension in the fist. Let your hand become nice and loose. (10 s)
Again, make a tight fist at the right hand and hold it. (5 s)
Then let the tension and the hand relax. Fully focus on what your hand feels like to you when it is relaxed.
(10 s)
Next slowly breathe in and bring your right forearm up to your shoulder and tighten your upper arm. Hold.
(5 s)
Now breathe out and release. (10 s)
Again, tense with your right arm. Hold and focus on what the tension feels like in your upper arm.
(5 s)
Now breathe out slowly and relax your arm. (10 s)
Breathe in and now make a tight fist with your left hand. Hold the tension. (5 s)
Exhale and release. Let the tightness and discomfort flow all the way out of your hand. (10 s)
Again, make a tight fist with your left hand and hold. (5 s)
Exhale and release. (10 s)
Breathe in again and bring the left forearm up to your shoulder to make a muscle hold and focus on the tension in your arm.
(5 s)
Slowly breathe out and release. Notice how that feels. (10 s)
43
Again, make a muscle hold with your left arm and hold it there. (5 s)
Now exhale and release. (10 s)
Take a long breath in and raise your eyebrows as high as they will go. Hold. (5 s)
Exhale and release. Relax your forehead. (10 s)
Breathe in again and raise your eyebrows as high as they will go. Hold. (5 s)
Release and breathe out slowly. (10 s)
Next, squeeze your eyes tightly shut and make a tight smile. Notice how that tension feels.
(5 s)
Breathe out and release, relaxing your eyes and cheeks. (10 s)
Breathe in again and squeeze your eyes closed. Hold. (5 s)
Exhale and release the tension. (10 s)
Now slowly open your mouth wide and hold it there. (5 s)
Exhale and release. Notice what that feels like to you. (10 s)
Again, open your mouth and hold. (5 s)
Release and breathe out slowly. (10 s)
Next, slowly, and carefully pull your head back as though you are looking up at the ceiling. Hold.
(5 s)
Exhale and slowly return your head to whatever position is most comfortable to you. Study what that relaxation feels like to you again.
(10 s)
Breathe in and pull your head back. Slowly exhale and slowly release. Inhale and push your shoulders up towards your ears. Hold them there for a moment.
(5 s)
Exhale and release. Let all of the tightness flow completely out of your shoulders. (10 s)
Again, breathe in and bring your shoulders up. Hold them there for a moment. (5 s)
Exhale and release. Let all of the tightness flow completely out of your shoulders. (10 s)
Now breathe in and push your shoulder blades back trying to almost touch them together. Hold that tension now.
44 (5 s)
Exhale letting your shoulders and chest relax all at once. (10 s)
Again, push your shoulder blades back and your chest forward. Hold. (5 s)
Release and breathe out slowly. (10 s)
Breathe in slowly and now let your chest and stomach expand all the way like a balloon filling with air. Hold.
(5 s)
Slowly exhale releasing all the tension from your chest and stomach. (10 s)
Again, breathe in fully and let your stomach and chest push out. (5 s)
Exhale and release. (10 s)
Next, tighten your thighs so that you’re pushing yourself up a bit out of your chair and hold.
(5 s)
Exhale and release, taking note of what it feels like in your upper legs. (10 s)
Again, tighten up your thighs and hold. (5 s)
Exhale and release. (10 s)
Now slowly pull the toes on your right foot up towards your shin, stretching you calf muscle. Hold the tension.
(5 s)
Exhale and release. (10 s)
Again, pull your toes up, tightening your calf muscle and hold. (5 s)
Release and breathe out slowly noticing what that right foot now feels like to you. (10 s)
Breathe in and now curl the toes of the right foot downwards and hold that tension. (5 s)
Exhale and release. (10 s)
Again, curl the toes of your right foot downwards and hold. (5 s)
Exhale and release and study what that feels like. (10 s)
Next, slowly pull the toes on your left foot up towards your shin, stretching your calf muscle. Hold the tension.
(5 s)
45 (10 s)
Again, slowly pull your toes up, tightening your calf muscle and hold. (5 s)
Exhale and release. (10 s)
Breathe in, and now curl the toes of the left foot downwards. Hold. (5 s)
Exhale and release. (10 s)
Again, curl the toes of your left foot downwards and hold. (5 s)
Breathe out slowly and release. (10 s)
Now, let relaxation spread from your head all the way down to your feet. Feel the weight of your relaxed body. Take a few more minutes to stay relaxed and breathe. End
46
Appendix II. List of questions in the Sport Anxiety Scale (SAS).35 Categories are assigned as follows: A: somatic anxiety; B: worry; C: concentration disruption
Number Question Category
1 I feel nervous A
2 During competition, I find myself thinking about unrelated things C
3 I have self- doubts B
4 My body feels tense A
5 I am concerned that I may not do as well in competition as I could B
6 My mind wanders during sport competition C
7 While performing, I often do not pay attention to what’s going on C
8 I feel tense in my stomach A
9 Thoughts of doing poorly interfere with my concentration during B
10 I’m concerned about choking under pressure B
11 My heart races A
12 I feel my stomach sinking A
13 I’m concerned about performing poorly B
14 I have lapses of concentration during competition because of
nervousness C
15 I sometimes find myself trembling before or during a competitive
event A
16 I’m worried about reaching my goal B
17 My body feels tight A
18 I’m concerned others will be disappointed in my performance B 19 My stomach gets upset before or during a competitive event A
20 I’m concerned I won’t be able to concentrate C
21 My heart pounds before competition A
Appendix III:List of questions in RESTQ-77 Sport Survey.36 Categories are assigned as follows: A: general stress; B: emotional stress; C: social stress; D: conflicts/pressure; E: fatigue; F: lack of energy; G: somatic complaints; H: success; I: social relaxation; J: somatic relaxation; K: general well-being; L: sleep quality; M: disturbed breaks; N: burnout/emotional exhaustion; O: fitness/injury; P: