ENERGY SUPPLY AND DEMAND PROJECTIONS TO 2040
National EnergyBoard Office nationalde lÕŽnergie
National Energy
Board Office nationalde lÕŽnergie
AN ENERGY MARKET ASSESSMENT
© Her Majesty the Queen in Right of Canada as represented by the National Energy Board 2016
Cat. No. NE2-12/2015E-PDF ISSN 2292-1710
This report is published separately in both official languages. This publication is available upon request in multiple formats.
© Sa Majesté la Reine du chef du Canada représentée par l’Office national de l’énergie 2016
Nº de cat. NE2-12/2015F-PDF ISSN 2292-1729
Ce rapport est publié séparément dans les deux langues officielles. On peut obtenir cette publication sur supports multiples, sur demande.
Permission to Reproduce
Materials may be reproduced for personal, educational and/or non-profit activities, in part or in whole and by any means, without charge or further permission from the National Energy Board, provided that due diligence is exercised in ensuring the accuracy of the information reproduced; that the National Energy Board is identified as the source institution; and that the reproduction is not represented as an official version of the information reproduced, nor as having been made in affiliation with, or with the endorsement of the National Energy Board.
If a party wishes to rely on material from this report in any regulatory proceeding before the NEB, it may submit the material, just as it may submit any public document. Under these circumstances, the submitting party in effect adopts the material and that party could be required to answer questions pertaining to the material.
This report does not provide an indication about whether any application will be approved or not. The Board will decide on specific applications based on the material in evidence before it at that time. For permission to reproduce the information in this publication for commercial redistribution, please e-mail: [email protected]
Autorisation de reproduction
Le contenu de cette publication peut être reproduit à des fins personnelles, éducatives et(ou) sans but lucratif, en tout ou en partie et par quelque moyen que ce soit, sans frais et sans autre permission de l’Office national de l’énergie, pourvu qu’une diligence raisonnable soit exercée afin d’assurer l’exactitude de l’information reproduite, que l’Office national de l’énergie soit mentionné comme organisme source et que la reproduction ne soit présentée ni comme une version officielle ni comme une copie ayant été faite en collaboration avec l’Office national de l’énergie ou avec son consentement. Quiconque souhaite utiliser le présent rapport dans une instance réglementaire devant l’Office peut le soumettre à cette fin, comme c’est le cas pour tout autre document public. Une partie qui agit ainsi se trouve à adopter l’information déposée et peut se voir poser des questions au sujet de
cette dernière.
Le présent rapport ne fournit aucune indication relativement à l’approbation ou au rejet d’une demande quelconque. L’Office étudie chaque demande en se fondant sur les documents qui lui sont soumis en preuve à ce moment.
Pour obtenir l’autorisation de reproduire l’information contenue dans cette publication à des fins commerciales, faire parvenir un courriel à : [email protected]
Letter from the Chair and CEO of the National Energy Board
I am pleased to introduce the 2016 edition of the National Energy Board’s Energy Futures series. Canada’s Energy Future 2016: Energy Supply and Demand Projections to 2040 (EF 2016) continues a long tradition of energy outlooks which the National Energy Board has been producing regularly since 1967. The only publicly available Canadian long-term energy outlook covering all energy commodities and all provinces and territories, this series provides Canadians a key reference point for discussing the country's energy future. This Report relies on the extensive energy market expertise of the Board’s technical staff. In addition, energy experts from government, industry, environmental organizations and academia across Canada provided input on the preliminary assumptions and results of this report. I would personally like to thank all those who contributed.
To use “uncertain” to characterize the past 18 months in Canadian energy would be an understatement. I doubt there is a single market observer who could have foreseen the dramatic fall in the global price of crude oil, one of Canada’s largest exports, from US$110 per barrel in mid-2014 to less than US$40 per barrel by end of December 2015 and then to less than US$30 per barrel in January 2016. Among many other factors contributing to the lack of clarity on Canada’s energy future were the unprecedented market volatility, the rapid deployment of advanced technologies for renewable and fossil fuel energy production, a historic climate agreement in Paris, the denial of the Keystone XL project in the U.S., the lifting of the U.S. oil export ban, as well as the lifting of sanctions on Iran.
Producing an energy supply and demand projection in this context is challenging, to say the least. Nonetheless, the projections in EF 2016 remain valid reference points for discussing Canada’s long-term energy future amid the current global energy uncertainty. Our analysis is not a prediction of future outcomes but rather projections of what might occur given a certain set of assumptions and inputs. This report, which centers on a baseline projection, also outlines alternate projections for higher and lower energy prices, and alternate market access and energy infrastructure assumptions, and then goes on to explore the important long-term implications of these energy market uncertainties.
The alternative projections in EF 2016 strike me as particularly relevant in the current context. As recently noted by Bank of Canada Governor Stephen Poloz, the drop in crude oil prices, as well as in other commodities, has had an unambiguously negative impact on the Canadian economy. EF 2016 indicates that the development of future energy infrastructure directly impacts export prices, future production growth and the overall Canadian economy. While Canada has no influence on global commodity prices, it does have control over the ability to access new markets for our exports and receive the full value in the global market place, whatever future global prices may be.
Of course, building new infrastructure and reaching new markets will hinge on Canada’s ability to develop its resources sustainably and transport them safely. And one thing that is clear amidst this uncertainty is that the link between energy and the environment is stronger than ever, and will continue to strengthen in the future. This stems from the fact that a majority of greenhouse gases (GHGs) emitted in Canada result from the combustion of fossil fuels and that those fossil fuels provide the vast majority of energy currently used to heat homes and businesses, transport goods and people, and power industrial equipment. In all of the EF 2016 projections, hydrocarbon energy use continues to increase,
natural gas prices, or the number of pipelines or LNG terminals that are built, while having a
modest impact on energy use, will not lead to significant overall emission reductions by themselves. As long as there is demand for energy, markets will function to provide the supply, whether from domestic or international sources, with little consequential impact on global energy use and the associated emissions.
In recent months the federal and many provincial governments in Canada have made announcements about new climate policy initiatives and the momentum is increasing, especially following the
agreement at the 21st Conference of the Parties in Paris. Many of these policies are quite bold and put Canada in the position of having some of the most advanced climate change policies in the world. EF 2016 does not include these recent announcements, as it only reports on policies and programs that are law, or near law at the time of analysis, but it does highlight their significance. The insights from the report suggest to me that these policy developments will be critical factors in Canada’s energy and environmental future, and the possible addition of climate policy developments beyond those just announced will represent a considerable uncertainty for long-term energy projections.
Canada’s energy future will not be determined by a single force, but rather by the interaction of many. Energy prices, economic growth, policies and regulation, market access and infrastructure development, and the development and use of new technologies will all play an important role. It is our goal to help Canadians understand these complex interactions through our analysis, reports, and statistics. The long-term projections in our Energy Futures series are an important part of that, along with the topical market analysis found in publications such as the Canadian Energy Dynamics annual review, and the weekly Market Snapshots. However, as climate policy and energy markets rapidly and continuously evolve, the type of analysis we undertake and the way by which we share that analysis with Canadians must evolve as well. In response, the Board will complete an update to EF 2016 this coming autumn to incorporate recent developments. Just as EF 2016 includes groundbreaking analysis on the long-term impacts of market access and transportation infrastructure, future work may focus on the implications of future climate policy developments.
Not only will we increase the frequency and depth of our Energy Futures projections, we will also implement some new and exciting ways of engaging with Canadians on energy, and look forward to hearing from them on issues that matter the most in these uncertain times.
C. Peter Watson, P. Eng. FCAE Chair and CEO
Letter from the Chair and CEO of the National Energy Board
Executive Summary...1
Key Findings ...1
Foreword ...9
Chapter 1: Introduction ...11
Chapter 2: Energy Context ...13
Canadian Energy in the Global Marketplace ... 13
Recent Developments and Emerging Trends ...19
Unique Regional Energy Dynamics ...27
Chapter 3: Key Drivers ...34
Energy Prices ... 34
Economy ... 36
Key Uncertainties to the Outlook ... 38
Chapter 4: Energy Demand Outlook ...39
Energy Consumption by Sector ...41
Key Uncertainties to the Outlook ... 47
Chapter 5: Crude Oil Outlook ...49
Crude Oil and Bitumen Resources ...49
Canadian Crude Oil Production Outlook ...50
Supply and Demand Balance ...57
Key Uncertainties to the Outlook ... 59
Chapter 6: Natural Gas Outlook ...61
Natural Gas Resources ... 61
Canadian Natural Gas Production Outlook ... 62
Supply and Demand Balance ... 67
Key Uncertainties to the Outlook ... 69
Chapter 7: Natural Gas Liquids Outlook ...70
Ethane ... 72
Propane ...73
Butanes ...74
Pentanes Plus ...75
Key Uncertainties to the Outlook ... 76
Chapter 8: Electricity Outlook ...77
Overview ... 77
Outlook by Fuel ...80
Net Exports and Interprovincial Transfers ... 83
Key Uncertainties to the Outlook ...84
Chapter 9: Coal Outlook ...86
Key Uncertainties ... 87
Chapter 10: Constrained Oil Pipeline Capacity Case ...88
Context ...88
Proposed Export Pipelines and Alternatives ...90
Constrained Case: Overview and Assumptions ... 92
Results ... 93
Crude Oil Production ... 96
Key Uncertainties ...100
Chapter 11: Liquefied Natural Gas Export Cases ...101
Context ... 101
High LNG and No LNG Cases: Overview and Assumptions ...102
Results ... 104
Key Uncertainties ...107
Chapter 12: Greenhouse Gas Emission Outlook ...109
Energy Consumption and GHG Emissions ... 109
Fossil Fuel Use Outlook ... 111
Current Climate Policy Context ...113
Key Uncertainties ...115
List of Figures ...117
List of Tables ...119
List of Acronyms and Abbreviations ...120
List of Units ...121
E
xEcutivE
S
ummary
Canada’s Energy Future 2016: Energy Supply and Demand Projections to 2040 (EF 2016) is a continuation of the National Energy Board’s (NEB) Energy Futures series. The Board released the last full report,
Canada’s Energy Future 2013 (EF 2013), in November 2013.
In developing EF 2016, the NEB met with various energy experts and interested stakeholders, including representatives from industry and industry associations, government, non-governmental organizations, and academia to gather input and feedback on the preliminary projections. The information obtained from these consultations helped shape the key assumptions and final projections.
It is important to note that the projections presented in EF 2016 are a baseline for discussing Canada’s energy future todayand do not represent the Board’s predictions of what will take place in the future. The projections in EF 2016 are based on assumptions which allow for analysis of possible outcomes. Any assumptions made about current or future energy infrastructure or market developments are strictly theoretical and have no bearing on the regulatory proceedings that are or will be before the Board.
Key Findings
The key findings of EF 2016 are outlined below and then summarized in the following pages:
1. Recent developments have highlighted numerous uncertainties for Canada’s long-term energy outlook.
2. In the Reference Case, energy production grows faster than energy use and net exports of energy increase.
3. The levels of future oil and natural gas production are highly dependent on future prices, which are subject to considerable uncertainty.
4. Without development of additional oil pipeline infrastructure, crude oil production grows less quickly but continues to grow at a moderate pace over the projection period.
5. The volume of liquefied natural gas exports is an important driver of Canadian natural gas production growth.
6. Total energy use in Canada, which includes energy use in the energy production sector, grows at similar rates in all EF 2016 cases, and GHG emissions related to that energy use will follow similar trends.
1. Recent developments have highlighted numerous uncertainties for
Canada’s long-term energy outlook.
In recent years, energy prices, technology, external markets and societal factors have all undergone substantial shifts over a short period of time. As the energy system continues to adjust and new trends emerge, there are considerable uncertainties in Canada’s long-term energy outlook.
The projections in EF 2016 include a Reference Case, two price sensitivity cases and three supplemental sensitivity cases:
• The Reference Case provides a baseline outlook, based on a moderate view of future energy prices and economic growth.
• Two price cases, with higher and lower oil and natural gas prices, capture some of the uncertainty related to future energy prices.
• EF 2016 also addresses uncertainties related to future oil export infrastructure by considering a case where no new major oil pipelines are built over the projection period.
• The uncertainty related to eventual volumes of liquefied natural gas (LNG) exports is explored in two additional cases.
F I G U R E E S . 1
Overview of Cases in EF 2016
Reference Case
Baseline Projection
Constrained Oil Pipeline Capacity Case
No new major crude oil pipelines
High Price Case
Higher long-term and natural gas prices
Low Price Case
Lower long-term oil and natural gas prices Oil
Transportation Uncertainty
Oil and Natural Gas Price Uncertainty
LNG Market Uncertainty
High LNG Case
Higher LNG exports from Canada
No LNG Case
2. In the Reference Case, energy production grows faster than energy
use and net exports of energy increase.
In the baseline projection of EF 2016 (the Reference Case), total Canadian energy production grows substantially over the projection period:
• Oil production leads this growth, with production reaching 963 103m3/d (6.1 MMb/d) by 2040, a 56 per cent increase from 2014. Much of this growth takes place in the oil sands.
• Natural gas production increases 22 per cent from 2014 levels to 506 106m3/d (17.9 Bcf/d), and LNG exports are a key driver of production growth.
• Electricity generation grows steadily over the projection period, with considerable additions of natural gas and renewable capacity while coal capacity declines.
F I G U R E E S . 2
Energy Production in Canada, on an Energy Equivalent Basis, Reference Case
0 2 000 4 000 6 000 8 000 10 000 12 000 14 000 16 000 2005 2010 2015 2020 2025 2030 2035 2040 Petajoules
Crude Oil Producon Natural Gas Producon Electricity Generaon
While production grows steadily, energy use in Canada increases less quickly than in the past. Total end-use energy demand increases at an average annual rate of 0.7 per cent from 2014 to 2040, almost half the rate of increase from 1990 to 2013.
Combined, net exports of energy increase over the projection period, led by increasing heavy crude oil exports.
3. The levels of future oil and natural gas production are highly dependent
on future prices, which are subject to considerable uncertainty.
Over the last decade, both crude oil and natural gas prices have been volatile. The EF 2016 High and Low price cases consider the impacts of different price trends on Canada’s energy outlook. Crude oil and natural gas prices can exhibit substantial variation in the short term, and could be outside of the ranges assumed in EF 2016 at a given point in time.
Production of crude oil in all three EF 2016 price cases is similar from 2015 to 2020, as oil sands projects already under construction are likely to be developed. In the High Price Case, total oil production continues to grow robustly, reaching 1 103 103m3/d (6.9 MMb/d) by 2040, 15 per cent higher than the Reference Case. In the Low Price Case, total oil production grows little after 2020, reaching 770 103m3/d (4.8 MMb/d) by 2040, or 20 per cent less than the Reference Case.
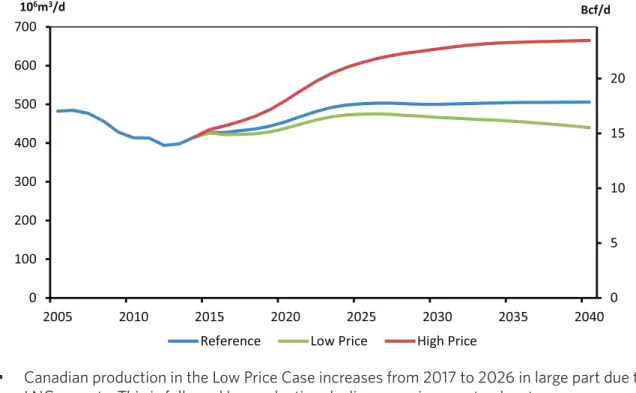
In the High Price Case, natural gas production grows quickly, reaching 665 106m3/d (24 Bcf/d) by 2040, 31 per cent higher than in the Reference Case. In the Low Price Case, total gas production is relatively flat until 2019. Production begins to increase in conjunction with assumed LNG exports and then declines gradually starting in 2026, reaching 440 106m3/d (16 Bcf/d) by 2040, or 13 per cent less than in the Reference Case.
F I G U R E E S . 3
EF 2016 Crude Oil and Natural Gas Price Assumptions
0 20 40 60 80 100 120 140 160 2005 2010 2015 2020 2025 2030 2035 2040 Reference High Price Low Price Brent crude oil, 2015US$ per barrel
0 1 2 3 4 5 6 7 8 9 10 2005 2010 2015 2020 2025 2030 2035 2040 Reference High Price Low Price Henry Hub natural gas, 2015US$ per MMBtu
4. Without development of additional oil pipeline infrastructure, crude oil
production grows less quickly but continues to grow at a moderate pace
over the projection period.
The Reference Case assumes that energy infrastructure is built as needed. However, the pace of development of oil pipeline infrastructure is a notable uncertainty for the Canadian energy system. The Constrained Oil Pipeline Capacity Case (Constrained Case) considers the impact on the Canadian energy system if no new major oil export pipelines are built over the projection period, including the Keystone XL, Northern Gateway, Trans Mountain Expansion and Energy East pipeline proposals. In this case, the increased use of rail, a more expensive shipping mode, leads to lower prices received by Canadian producers, net of transportation costs. Despite somewhat lower prices compared to the Reference Case, crude oil production continues to grow as many projects remain profitable. Oil production in the Constrained Case reaches 882 103m3/d (5.6 MMb/d) by 2040, eight per cent lower than the Reference Case. Crude oil shipped by rail grows substantially over the projection, reaching 187 103m3/d (1.2 MMb/d) by 2040.
F I G U R E E S . 4
Total Oil Production, Reference, High Price, Low Price and Constrained Cases
0 1 2 3 4 5 6 7 0 200 400 600 800 1 000 1 200 2005 2010 2015 2020 2025 2030 2035 2040 MMb/d 103m3/d
Reference Low Price High Price Constrained
Total Canadian production in the Constrained Case grows quicker than in the Low Price Case, and production is 15 per cent higher than the Low Price Case by 2040. This suggests that although pipeline infrastructure may impact Canadian oil production, it is one of many factors that may do so. The High and Low Price cases suggest that crude oil prices, driven by global supply and demand dynamics, are also an important – perhaps the most important – determinant of Canadian production growth.
5. The volume of liquefied natural gas exports is an important driver of
Canadian natural gas production growth.
The Reference Case assumes that LNG exports begin in 2019 at 14 106m3/d (0.5 Bcf/d) and increase to 71 106m3/d (2.5 Bcf/d) by 2023. This is an assumption, as there is considerable uncertainty regarding the volume of LNG that Canada might export globally. Two EF 2016 cases, the High and No LNG cases, analyze this uncertainty.
The High LNG Case assumes higher LNG exports than the Reference Case, with exports reaching 170 106m3/d (6 Bcf/d) by 2030. The No LNG Case assumes that no LNG exports occur by 2040. Exports of LNG could be a significant driver of future Canadian natural gas production growth. In the High LNG Case, total natural gas production reaches 614 106m3/d (22 Bcf/d) by 2040, 21 per cent higher than in the Reference Case. In the No LNG Case, total production is 437 106m3/d (15 Bcf/d) by 2040 or 14 per cent lower than the Reference Case.
F I G U R E E S . 5
Total Natural Gas Production, Reference, Price, and LNG Cases
0 5 10 15 20 0 100 200 300 400 500 600 700 2005 2010 2015 2020 2025 2030 2035 2040 Bcf/d 106m3/d
6. Total energy use in Canada, which includes energy use in the energy
production sector, grows at similar rates in all EF 2016 cases, and GHG
emissions related to that energy use will follow similar trends.
The outcomes of the sensitivity cases in EF 2016 have implications for Canadian energy use. Numerous dynamics are at play but overall, the total differences in energy consumption across the cases are relatively small.
In the Reference Case, total energy use grows from 13 444 petajoules (PJ) in 2013 to 16 233 PJ in 2040. The energy intensity of the Canadian economy, measured in energy use per unit of economic activity, continues its declining trend and falls by an average of one per cent per year from 2013 to 2040. Given the policy and technology assumptions of this analysis, fossil fuels remain the primary source of energy in Canada over the projection period. This increase in fossil fuel consumption implies that GHG emissions will increase over the projection period, consistent with the most recent GHG emission projections from Environment and Climate Change Canada.
Higher and lower energy prices impact energy use across the economy in different ways. Canada is a major producer of energy and this tends to influence its role as a consumer of energy. Energy use is highest in the High Price Case, reaching 16 659 PJ by 2040. Slightly higher economic growth and more demand in the oil and natural gas producing sector outweigh the downward impact of higher prices on consumption. The impact is reversed in the Low Price Case, which has the lowest energy use of the cases at 15 840 PJ in 2040, despite higher consumption outside of the oil and natural gas sector.
F I G U R E E S . 6
Canadian Energy Use, All Cases
0 2 000 4 000 6 000 8 000 10 000 12 000 14 000 16 000 18 000 2013 2025 2040 Petajoules
Energy use in the Constrained Case falls between the Reference and Low Price Case projections, at 15 887 PJ by 2040. The primary reason for lower total demand is lower energy use for oil production. Slightly slower economic growth also has a minor impact.
Canadian energy use in the High LNG Case reaches 16 531 PJ by 2040, slightly above the Reference Case. The impact is reversed in the No LNG Case, with energy use reaching 16 042 PJ by 2040, just below the Reference Case.
The relatively small impact on energy use in the sensitivity cases suggests that factors other than energy prices, oil pipeline development and LNG exports could have a more significant impact on future energy use and GHG emission trends in Canada. Economic growth trends are also important and can have a very large impact on Canadian energy use and emissions. For example, the 2008-2009 global economic downturn contributed to the nearly eight per cent drop in Canadian energy use from 2007 to 2009. Similarly, technological developments beyond those considered in this report could result in markedly different outcomes. Finally, the EF 2016 cases only include existing laws, policies and programs, and future laws, policies and programs could strongly influence long term energy use and GHG emissions.
F
orEword
The National Energy Board (NEB or Board) is an independent federal, quasi-judicial regulator
established in 1959 to promote safety and security, environmental protection, and economic efficiency in the Canadian public interest within the mandate set by Parliament for the regulation of pipelines, energy development, and trade.
The Board’s main responsibilities of the NEB are established in the NEB Act and include regulating: • the construction, operation and abandonment of oil and gas pipelines that cross international
borders or provincial/territorial boundaries, as well as the associated pipeline tolls and tariffs; • the construction and operation of international power lines, and designated interprovincial
power lines; and
• imports of natural gas, and exports of crude oil, natural gas, oil, natural gas liquids (NGLs), refined petroleum products and electricity.
Additionally, in specified areas, the Board has regulatory responsibilities for oil and gas exploration and production activities under the National Energy Board Act (the NEB Act), Canada Oil and Gas Operations Act (COGOA), the Canada Petroleum Resources Act (CPRA), and the North West Territories’ Oil and Gas Operations Act (OGOA) and Petroleum Resources Act (PRA). For oil and natural gas exports, the Board’s role is to evaluate whether the oil and natural gas proposed to be exported is surplus to reasonably foreseeable Canadian requirements, having regard to the trends in the discovery of oil or gas in Canada. The Board monitors energy markets, and assesses Canadian energy requirements and trends of oil and natural gas discovery to support its responsibilities under Part VI of the NEB Act. The Board periodically publishes assessments of Canadian energy supply, demand and markets in support of its ongoing market monitoring. These assessments address various aspects of energy markets in Canada. This report, Canada’s Energy Future 2016: Energy Supply and Demand Projections to 2040 (EF 2016) is one such assessment that projects long-term Canadian energy supply and demand trends.
This report does not provide an indication about whether any application will be approved or not. The Board will decide on specific applications based on the material in evidence before it at that time. Comments or questions on this report can be directed to: [email protected].
If a party wishes to rely on material from this report in any regulatory proceeding before the NEB, it may submit the material, just as it may submit any public document. Under these circumstances, the submitting party in effect adopts the material and that party could be required to answer questions pertaining to the material.
EF 2016 was prepared by National Energy Board technical staff under the Direction of Abha Bhargava ([email protected], 403-299-3171), Director, Energy Integration; Matthew Hansen ([email protected], 403-299-3179), Co-Project Manager – Energy Futures; Bryce van Sluys ([email protected], 403-299-3711), Co-Project Manager – Energy Futures
Specific questions about the information in this report may be directed to:
General Questions………. Matthew Hansen ([email protected])
Bryce van Sluys ([email protected])
Key Drivers and Macroeconomics………. Bryce van Sluys ([email protected]) Energy Demand……….. Matthew Hansen ([email protected])
Chris Doleman ([email protected])
Ken Newel ([email protected])
Crude Oil……….... Peter Budgell ([email protected])
Bill Wall ([email protected])
Refinery Balances……….. Christian Iniguez ([email protected])
Bryce van Sluys ([email protected])
Natural Gas………. Melanie Stogran ([email protected])
Connor McDonald ([email protected])
Natural Gas Liquids……….. Jesus Rios ([email protected])
Ryan Creighton ([email protected])
Electricity………. Natalia Lis ([email protected])
Michael Nadew ([email protected])
Coal……….. Chris Doleman ([email protected])
Darcy Johnson ([email protected])
Constrained Case………... Darcy Johnson ([email protected])
Bill Wall ([email protected])
High LNG and No LNG cases……….…………. Bryce van Sluys ([email protected])
Melanie Stogran ([email protected])
GHG Emissions………. Matthew Hansen ([email protected])
Michael Nadew ([email protected])
Chris Doleman ([email protected])
i
ntroduction
• Canada’s Energy Future 2016: Energy Supply and Demand Projections to 2040 (EF 2016) projects energy supply and demand for Canada to the year 2040.
• The National Energy Board (NEB) has been producing long-term supply and demand projections regularly since 1967.
• EF 2016 considered three core cases which are discussed throughout the main body of the report:
o The Reference Case with baseline projections is based on the current macroeconomic outlook and a moderate view of energy prices; and
o The High and Low Price Cases which address the uncertainty related to future crude oil and natural gas prices.
• Four key assumptions underpin the core cases:
1. All energy production will find markets and infrastructure will be built as needed. 2. Only policies and programs that are law at the time of writing are included in the
projections. As a result, any policies under consideration, or new policies developed after the projections were completed in the summer of 2015, are not included in this analysis. 3. Environmental and socio-economic considerations beyond the included policies and
programs, are outside the scope of this analysis.
4. Energy markets are constantly evolving. The analysis presented in EF 2016 is based on the best available information at the time of finalizing the analysis and results, which was the summer of 2015.
• EF 2016 also introduces three supplemental sensitivity cases which explore issues related to markets and infrastructure:
o The Constrained Oil Pipeline Capacity Case (Constrained Case) considers the impact on the Canadian energy system if no new major oil pipelines are constructed over the projection period. This case is discussed in Chapter 10.
o The High Liquefied Natural Gas (LNG) and No LNG cases consider the uncertainty related to the global LNG market and Canada’s ability to compete for market share. These cases consider higher and lower Canadian LNG export volumes than those in the Reference Case. These cases are discussed in Chapter 11. The relationship between the six cases in EF 2016 is shown in Figure 1.1.
F I G U R E 1 . 1
EF 2016 Sensitivity Cases
• While developing EF 2016 the NEB met with various energy experts and interested
stakeholders, including representatives from industry and industry associations, government, non-governmental organizations and academia to gather input and feedback on the preliminary projections. Over 160 participants attended one of 12 sessions held either in person or by video conference. The Board would like to thank all participants for their contributions to EF 2016. • The information obtained from these consultations helped shape the key assumptions and final
projections. In addition, feedback following the release of Canada’s Energy Future 2013 (EF 2013) influenced the coverage of EF 2016. Specifically, the development of the LNG and Constrained cases resulted from EF 2013 user comments and questions. Over the projection period, it is likely that developments beyond the realm of normal expectations, such as geopolitical events or technological breakthroughs, will occur. Likewise, new information becomes available and trends, policies, and technology evolve. Readers of this analysis should consider the projections a baseline for discussing Canada’s energy future today, not a prediction of what
will take place.
• The following chapters discuss the results from the Reference and sensitivity case projections, highlighting key changes in Canadian energy supply and demand trends. Detailed data tables supporting this discussion are available in the Appendices on the NEB website.
E
nErgy
c
ontExt
• The Canadian energy system is in a constant state of change. Factors such as technology, macroeconomics, infrastructure, and government policy and programs continually influence how energy is produced, transported, and consumed in Canada. This section provides insights into these ongoing changes and helps to provide context to the projections discussed in EF 2016. It is organized according to three themes: Canadian Energy in the Global Marketplace, Recent Developments and Emerging Trends, and Unique Regional Energy Dynamics.
• In addition to the information in this section, the NEB issues several other energy information publications that help provide perspective on Canadian energy trends. The Board’s report
Canadian Energy Dynamics1 reviews important energy market developments each year. Also, the Board publishes regular Market Snapshots2, which provide topical information and analysis on emerging trends in Canadian energy. These reports are part of the collection of energy analysis and statistics available on the NEB’s website3.
Canadian Energy in the Global Marketplace
Canada in a Global Context
• Canada is a vast northern nation with a relatively small population, a developed economy, and a large natural resource base. Combined, these factors have helped to shape Canada’s energy production and consumption patterns.
• Canada’s energy resources are among the largest in the world. Canadian rivers discharge close to seven per cent of the world’s renewable water supply4. This resource provides tremendous hydroelectric generating capability. In addition, Canada ranks third globally in proven oil reserves, 97 per cent of which are in the oil sands, and 15th in both proven natural gas and coal reserves5. Canada also ranks fourth in identified resources of uranium6.
• This large and diversified resource base contributes to Canada’s status as a significant global energy producer and exporter. In terms of production, Canada ranks among the top five in the world for hydroelectricity, crude oil, natural gas and uranium7. Table 2.1 illustrates Canadian and global production of major energy commodities.
T A B L E 2 . 1
Canadian and Global Production of Select Energy Commodities
Canadian
Production Global Production Global ProductionPercentage of
Canadian Production Rank Among Global
Producers Hydro Electricity
(terawatt-hours) 379 3 885 9.8% 2nd
Crude Oil (thousand cubic
metres per day) 682 14 093 4.8% 4th
Natural Gas (million cubic
metres per day) 444 9 485 4.7% 5th
Coal (Million Tonnes) 69 8 165 0.8% 13th
Uranium (Tonnes)(a) 8 998 58 816 15.3% 2nd
(a) Uranium data is 2012, data for the other commodities are from 2014. Source: BP Statistical Review of Energy 2015
• Canada is also a large consumer of energy. In 2012, Canadian total final energy consumption was 2.3 per cent of the global total8. On a per capita basis, Canada’s energy intensity is among the highest in the world.
• Climate and geography play a key role in Canada’s relatively high energy intensity. A cold and variable northern climate means more energy is consumed heating homes and businesses. Similarly, goods and people often travel further to reach their destinations due to Canada’s large land mass. This requires more energy use compared to geographically smaller nations. • Economic structure is also important in determining how Canadians use energy. Canada is a
developed country with a mature and highly industrialized economy. Extraction and processing of energy and non-energy resources contribute substantially to Canada’s industrial activity, and tend to be energy-intensive.
Crude Oil Price Trends
• From 2011 to mid-2014, global crude oil prices were relatively stable at over US$100 per barrel (bbl). In June 2014, Brent crude oil, a key global crude oil pricing benchmark, traded above US$110/bbl. In mid-2014, oil prices began to drop quickly. By January 2015, prices had declined by about 60 per cent to under US$46/bbl. Although prices increased slightly in the spring, in August 2015 both Brent and West Texas Intermediate (WTI), a benchmark for U.S. crude oil, were again trading under US$50/bbl. Figure 2.1 shows the prices for Brent and WTI from 2010 to mid-2015.
F I G U R E 2 . 1
Global Crude Oil Prices
0 20 40 60 80 100 120 140 2010 2011 2012 2013 2014 2015
US$ per barrel
Brent West Texas Intermediate
• From 2008 to 2014, crude oil production in the U.S. increased by 591 thousand cubic metres per day (103m3/d)a or 3.7 million barrels per day (MMb/d)9. This substantial increase was made possible by technological advancements that have reduced extraction costs for
previously uneconomic resources. This increase in production was an important contributing factor to the decline in oil prices in the second half of 2014.
• Oil demand growth has shifted away from developed economies including Europe and North America to emerging economies: particularly China, India and the Middle East. However the expectations of future demand growth from emerging economies are lower than in past years. Global oil demand, which had increased by 222 103m3/d (1.4 MMb/d) in 2013, grew by only 134 103m3/d (0.8 MMb/d) in 2014. China’s oil demand growth, which averaged 87 103m3/d (0.6 MMb/d) per year from 2009 to 2013, fell to 62 103m3/d (0.4 MMb/d) in 201410. • In past instances when global oil prices have begun to fall, the Organization of Petroleum
Exporting Countries (OPEC) acted to reduce oil production available to the global market. However, in late November 2014, OPEC decided to maintain its crude oil production level despite falling prices. This change in policy surprised many market participants.
• Crude oil producers are responding to lower prices by cutting capital investments in proposed projects and wells in higher cost areas. These decisions will likely affect global crude oil output in the coming years as upstream activity is reduced. The oil price assumptions in EF 2016 reflect this reduction in output and an eventual rebalancing of supply and demand at a higher price level. In the Reference Case, Brent increases to about US$80/bbl by 2020 in current dollar terms. After 2020, Brent slowly increases to US$107/bbl by 2040 given the expectations for continued growth in global oil demand and the need to access higher cost sources of oil supply to meet that demand.
Markets for Canadian Energy Exports
• Almost all of Canada’s crude oil, natural gas and electricity exports go to the U.S. Relatively small amounts of crude oil are shipped overseas to Europe, Asia and South America. The U.S. is likely to be Canada’s primary export market over the projection period. However, the potential emergence of LNG exports and possible additions to crude oil export infrastructure could allow Canadian energy to reach broader markets. Table 2.2 shows Canadian exports of crude oil, natural gas, and electricity in 2014.
T A B L E 2 . 2
Canadian Exports of Crude Oil, Electricity and Natural Gas in 2014(a) Crude Oil
East Coast
(PADD I) (PADD II)Midwest (PADD III)Gulf Coast
Rocky Mountain (PADD IV)
West Coast
(PADD V) Non-U.S. Total
103m3/d MMb/d 40 302 30 38 32 13 454 0.3 1.9 0.2 0.2 0.2 0.1 2.9 % of Total 8.8% 66.5% 6.5% 8.4% 7.1% 2.8% -Electricity
East Coast Midwest Gulf Coast MountainRocky West Coast Non-U.S. Total
Terawatt-hours 35.9 15.0 0.0 0.1 7.4 - 58.6
% of Total 61.4% 25.7% 0.0% 0.2% 12.6% -
-Natural Gas(b)
East Midwest West Non-U.S. Total
106m3/d 27 110 72 - 209
Bcf/d 1.0 3.9 2.5 7.4
% of Total 12.9% 52.8% 34.3% -
-(a) See Figure 10.2 for map showing the locations of the PADDs.
(b) Natural gas exports statistics are based on the export point and likely intended market.
Crude Oil
• Canada is currently the largest exporter of crude oil to the U.S. Two-thirds of Canadian crude oil exports are delivered to refineries in the U.S. Midwest. The majority of growth in Canadian crude oil exports is likely to be heavy crude oil as the oil sands are projected to be the main driver of growth in Canadian oil production. In addition, the U.S. market is likely to be well supplied with light oil due to growing U.S. light oil production.
• The U.S. Gulf Coast has the largest current capacity to refine heavy crude oil. The U.S. Midwest and West Coast also have significant heavy oil refining capacity. Heavy oil used in the U.S. Midwest mostly comes from Canada.
• Growth in Canadian exports to the U.S. Gulf and West Coasts will depend on demand growth and on the extent that Canadian producers can compete with existing heavy oil suppliers from the Middle East, Mexico, and South America.
• There are a variety of potential destinations for Canadian crude oil exports outside of the U.S. Currently, some light oil produced offshore of Newfoundland and Labrador is exported to markets in the Atlantic basin. Depending on future oil transportation infrastructure developments, western Canadian heavy oil could potentially reach markets in Europe where there is significant refining capacity.
• Western Canadian producers have identified Asia as a potential long-term growth market for heavy crude oil. Canada is well positioned geographically to supply these markets as the distance from Canada’s West Coast to Asia is shorter compared to many other heavy crude oil producing nations.
• Future developments in oil pipeline infrastructure will be an important factor for Canadian oil producers accessing markets outside Canada and the U.S. EF 2016 includes a sensitivity case that considers the impact on the Canadian energy system if no new major oil pipelines are constructed. Chapter 10, which highlights the results of this case, also provides additional context on crude oil transportation issues.
Natural Gas
• Canada exports natural gas solely to the U.S. Total exports of natural gas declined by 29 per cent between 2007 and 2014, from 294 million cubic metres per day (106m3/d) or 10.4 billion cubic feet per day (Bcf/d) to 209 106m3/d (7.4 Bcf/d). The U.S. Midwest typically receives about half of Canada’s natural gas exports, with the remainder split between the eastern and western U.S. As shown in Figure 2.2, the volume of natural gas exports to the western U.S. has remained relatively stable. Export volumes to the eastern U.S. and the Midwest have declined primarily due to increased natural gas production in the U.S. Northeast.
F I G U R E 2 . 2
Canadian Natural Gas Exports by U.S. Market
0 1 2 3 4 5 0 20 40 60 80 100 120 140 160
West Midwest East
Bcf/d 106m3/d
• Canada also imports natural gas from the U.S., mostly into Ontario. Small amounts of natural gas received as LNG are also imported into the Maritimes via the Canaport LNG terminal. Total natural gas imports more than doubled from 36 106m3/d (1.3 Bcf/d) in 2007 to peak at 86 106m3/d (3.0 Bcf/d) in 2011 before declining gradually in subsequent years.
• In its Annual Energy Outlook 2015 (AEO 2015), the U.S. Energy Information Administration (EIA) projects modest growth in U.S. natural gas demand over the long term, with only the power generation sector showing robust demand11. Meanwhile, U.S. natural gas supply is projected to continue to grow, increasing pressure on western Canadian natural gas production to compete for market share. The EIA projects much of this supply growth to take place in the U.S. Northeast, where natural gas is relatively inexpensive to produce and reserves are situated close to large existing markets, including eastern Canada. The EIA projects that the U.S. will transition from being a net importer of natural gas to a net exporter by 201812.
• While the market share of western Canadian natural gas in the U.S. and eastern Canada may be contracting, other markets for Canadian natural gas are being explored. Currently, there are multiple proposals to build natural gas liquefaction facilities on Canada’s West and East coasts13, all aiming to export LNG to global markets. The eventual volume of LNG exports from Canada is a significant uncertainty for the projections in EF 2016. As a result, two LNG sensitivity cases are considered in Chapter 11, which contain additional context related to potential Canadian LNG exports.
Electricity
• Canada only exports electricity to the U.S. These exports are predominately sourced from provinces with large hydro-electric generation capability: Quebec, British Columbia (B.C.), and Manitoba. Over 60 per cent of Canadian electricity exports are sold into the eastern half of the U.S., the vast majority of which is sold to the U.S. Northeast. States in the Midwest receive about one quarter of Canada’s electricity exports, while about 13 per cent is exported to the U.S. West Coast.
• In August 2015, the U.S. Environmental Protection Agency (EPA) released the final version of the Clean Power Plan (CPP) which sets emissions reduction goals for 47 U.S. states. The EPA estimates that meeting those targets could reduce GHG emissions from the power sector in the U.S. by 32 per cent from 2005 levels14.
• The CPP creates considerable uncertainty for the electricity projections in EF 2016. The final version of the CPP was released in August 2015 and specifies that to meet their emission reduction targets, U.S. states could import electricity from Canadian sources installed after 201215,16. This could create a new market opportunity for Canadian electricity exports and increase the likelihood that various proposed large hydroelectric facilities will be built. Several hydroelectric projects included in the projections are more likely to be constructed if demand for Canadian electricity in the U.S. is stronger.
Energy Consumption and Greenhouse Gas Emissions
• By-products of the combustion of fossil fuels include carbon dioxide (CO2) and other greenhouse gases (GHGs). The Intergovernmental Panel on Climate Change (IPCC)17 has reported that recent changes in the Earth’s climate can largely be attributed to the release of GHGs into the atmosphere through human activities. The IPCC also notes that the more human activities disrupt the global climate, the greater the risk of severe impacts for people and ecosystems. Many consider climate change to be one of the most important issues of our day. Canada’s total GHG emissions in 2013 were approximately two per cent of global emissions.
• Environment and Climate Change Canada publishes Canada’s official GHG projections in its
Canada’s Emission Trends report18 and also in Canada’s Biennial Report to the United Nations Framework Convention on Climate Change19 (UNFCCC). Much like the analysis in EF 2016, the Environment and Climate Change Canadaprojections include policies and programs that were in place at the time of analysis.
• The majority of GHGs emitted in Canada result from the combustion of fossil fuels. Fossil fuels include crude oil, natural gas, coal, and refined petroleum products such as gasoline and diesel. They provide the vast majority of energy used to heat homes and businesses, transport goods and people, and power industrial equipment. Emissions from the combustion of fossil fuels, including those used for the production of energy, accounted for 81 per cent of Canadian GHG emissions in 201320. The remaining emissions are from non-energy sources such as agricultural and industrial processes, and waste handling.
• The level of GHGs emitted by the various services that fossil fuels provide depend on how efficiently the fuel is used, and the emission content of fuel. Not all fossil fuels produce the same amounts of GHG emissions when they are converted to energy. The amount of GHG emissions produced depends on the carbon content of the fuel21. Natural gas for example, emits about half the carbon dioxide emitted by coal to produce the same amount of energy. • Given the direct relationship between fossil fuel consumption and GHG emissions, future
policies related to climate change represent a key uncertainty for Canada’s energy outlook. The projections in EF 2016 only include policies and programs that are law at the time of analysis. Speculating on government policies and programs that are in planning or are yet to be developed is beyond the scope of this report. Also, as future policies and programs are not known and their potential impact cannot be factored toward achieving emissions objectives, federal or provincial emissions targets may or may not be met in the projections.
Recent Developments and Emerging Trends
Oil and Natural Gas Production from Shale and Tight Resources
• As outlined in EF 2013, the way crude oil and natural gas are produced in North America has undergone a dramatic shift22. The ability to profitably develop the shale and tight formations that had previously been inaccessible has reversed declining trends in both oil and natural gas production. This shift can be largely attributed to technological advancements; a combination of extended-reach horizontal drilling, and multi-stage hydraulic fracturing. Following the widespread application of these technologies, producers have continued to make their operations more efficient and productive through ongoing operational improvements, such as pad drilling.
• Production of oil and natural gas produced from tight and shale formations across the U.S. and Canada has demonstrated large improvements in productivity for at least the past eight years. Figure 2.3 shows estimated new production per rig23 from two such regions: the U.S. portion of the Bakken, a tight oil play located in North Dakota and Montana, and the Marcellus shale gas play, located in the U.S. Northeast. The trend is similar in numerous other regions of the U.S. and Canada.
F I G U R E 2 . 3
Estimated New Production per Drilling Rig, Bakken and Marcellus Production Regions
0 50 100 150 200 250 300 2007 2008 2009 2010 2011 2012 2013 2014 2015
Bakken (Crude Oil) Marcellus (Natural Gas) Crude Oil: m3/d, Natural Gas: 103m3/d, per Rig
• Horizontal drilling techniques continue to improve and the distance producers have been able to drill laterally has increased. As a result, producers can access more of the producing zone from one well and perform more stages of hydraulic fracturing per well. In addition, new techniques, such as movable sleeve and coiled tubing fracturing systems24, allow for quicker and more controlled fracturing operations.
• Increasingly, companies are taking advantage of pad drilling. This optimizes horizontal drilling and hydraulic fracturing from a centralized location or well pad. Pad drilling also allows some activity to continue during the spring break-up period, formerly a down-time in Canada. • The extent to which the productivity of future oil and natural gas wells will increase is a key
uncertainty for the price and production projections in EF 2016. Recent improvements in productivity are partly due to producers responding to low prices by only drilling their most productive assets. Over time, it is likely that activity will move to less prolific areas of producing basins which would have a downward impact on productivity. The extent to which technology and improved efficiencies can offset this is uncertain. The projections in EF 2016 take into account recent productivity trends, with productivity increasing or decreasing depending on the producing area. Over the long term, productivity is held constant or declines, depending on the characteristics of particular producing regions.
Energy Use in the Oil Sands
• Over the last several decades, the oil sands have been a major growth area for natural gas use in Canada. Oil sands natural gas demand, including gas consumed for cogeneration, rose from 18 106m3/d (0.7 Bcf/d) in 2000 to 88 106m3/d (3.1 Bcf/d) by 2014, and now represents over 20 per cent of total Canadian natural gas demand25.
• Natural gas is used in mining, upgrading, and in situ oil sands production. As discussed in Chapter 5, in situ production represents the majority of future bitumen production and natural gas demand.
• In situ oil sands production can be broadly categorized into two types, primary and thermal. Primary production is heavy oil that flows naturally into a well without the use of heat. It is therefore not energy intensive because it does not use natural gas during production. Primary production has become a smaller component of total in situ production, shrinking from 42 per cent in 2000 to 23 per cent in 2014, and is expected to continue to decline to 11 per cent by 2040.
• Thermal in situ processes are energy intensive. Natural gas is used to heat water to produce steam, which is injected into the ground to heat up the bitumen in the oil reservoir. Heating the bitumen reduces its viscosity, allowing it to flow to the well and be pumped to the surface. • A project’s steam oil ratio (SOR) is the volume of steam per volume of oil produced. When
natural gas is used to produce steam, the SOR becomes a measure of natural gas intensity and a key indicator of an operation’s energy efficiency.
• Figure 2.4 depicts the aggregate SOR for the Alberta in situ industry over the past six years as measured by the ratio of the annual steam usage to annual bitumen production. The two main categories of in situ production are cyclic steam stimulation (CSS) and steam assisted gravity drainage (SAGD). In general, SAGD operations have a lower SOR than CSS. Overall, the recent trend has been declining SORs, but this has varied year-to-year with production type. For example, SAGD SOR was fairly consistent from 2009 to 2013, and exhibited a large decline in 2014. CSS SORs declined from 2009 to 2011, but has gradually trended upward since.
F I G U R E 2 . 4
Aggregate Production-weighted SORs for In Situ Oil Sands Projects
0.0 1.0 2.0 3.0 4.0 5.0 2009 2010 2011 2012 2013 2014 2015 (Jan-Jun)
All Thermal In-Situ Steam Assisted Gravity Drainage Cyclic Steam Smulaon
Steam to oil rao
• EF 2016 projects that in situ oil sands production will be Canada’s largest source of future oil production growth, as well as one of the key drivers of natural gas demand. However, future trends of oil sands natural gas use are uncertain as various factors may lead to higher or lower SOR values. One factor that may increase SORs is the quality of reservoirs yet to be developed. Recent projects have encountered reservoir rock types that have made production more challenging. These reservoirs exhibit variability in thickness, as opposed to formations that are more predictable and therefore require less steam.
• Technical innovation is an important factor that could decrease future SOR values. Recent innovations include the use of flow control devices that direct steam more uniformly into the reservoir26, injecting methane or a solvent such as propane or butane along with the steam27, and the drilling of vertical infill wells, or “wedge wells” between older SAGD wells to recover additional bitumen from beyond the existing boundaries of the steam chambers28.
• The projections in EF 2016 assume a one per cent annual decrease in SOR over the projection period to reflect the potential for continued innovation.b Given the uncertainty in future SOR trends and the projected growth in oil sands production, Canadian natural gas demand could vary significantly. For more information on how different SOR assumptions impact energy use projections, Energy Futures Supplement: Demand Sensitivities29 includes various sensitivity cases that change the SOR in the EF 2013 projections.
b The shift towards higher thermal and less primary shares over the projection period offsets these gains in terms of total in situ natural gas intensity.
Small-Scale LNG and Potential for Fuel-Switching in Canada
• Small-scale natural gas liquefaction facilities have been in operation Ontario, Quebec and B.C. for almost 45 years. Used in conjunction with LNG storage, these facilities historically functioned to supply natural gas when demand exceeds the capacity constraints of nearby pipelines, a service referred to as “peaking”. While there is potential for expanding such peaking services, it is LNG’s role as a substitute for diesel that may be a key driver of investments into small-scale liquefaction facilities into the future.
• In Canada, natural gas costs less than diesel for an equivalent amount of energy. This discount has created interest in using LNG domestically as a diesel substitute. LNG for domestic use is typically produced by small-scale liquefaction facilities which are much smaller than facilities built to liquefy natural gas for export.
• A major challenge to using LNG in Canada has been the lack of small-scale liquefaction infrastructure. Without nearby plants to liquefy natural gas, LNG must be shipped via truck over long distances, adding to the cost for users and reducing its competitiveness compared to other fuels. However, the recent and proposed construction and expansion of small-scale liquefaction facilities will decrease trucking distances for many prospective LNG users30. • The rate of LNG adoption is related to the difference in prices between natural gas and refined
petroleum products (RPPs). Figure 2.5 shows the wholesale prices for diesel and natural gas in Canadian dollars. The oil and natural gas price projections in EF 2016 suggest the differential could be sufficient to encourage growth in domestic LNG consumption.
F I G U R E 2 . 5
Wholesale Diesel and Natural Gas Prices
0 5 10 15 20 25 30 2005 2006 2007 2008 2009 2010 2011 2012 2013 2014 2015 C$/GJ
Diesel (Canadian Average) NIT (Alberta Natural Gas Price)
• Electricity producers in remote regions often cannot use natural gas for power generation due to a lack of nearby natural gas production and pipelines. Instead, they have relied on more expensive but more easily transported diesel for their generation needs. The lower cost of LNG compared to diesel could encourage electricity producers to invest in regasification and natural gas-fired generation facilities. This is already occurring in Yukon and the Northwest Territories (NWT),31 and several utility companies and governments are exploring whether it is economically feasible in the long term.
• LNG can provide an effective source of natural gas supply when demand exceeds pipeline capacity to a region. It can be expensive to expand pipeline capacity, and if the additional capacity will only be used a few days of the year, it is likely uneconomic. Building LNG storage tanks and trucking in LNG can be a less expensive alternative. A SaskEnergy pilot project currently underway in Aberdeen, Saskatchewan32 is an example of this approach. LNG could also be used to convert existing remote distribution networks from propane to natural gas, as FortisBC is planning to do in Revelstoke, B.C.33
• Freight trucks with engines designed to run on LNG are currently available. Two large Canadian LNG trucking fleets have been built-up over the past three years 34. The availability of refueling stations has grown considerably along Canada’s main freight corridors in recent years.
However, technological challenges may create hurdles for further adoption. LNG engines are currently less efficient than their diesel counterparts35, eroding the potential fuel-savings of switching to LNG-powered trucks. Currently there is no LNG engine on the market that has the horsepower to carry the maximum loads of Canadian freight trucks36.
• LNG can also be used to fuel oil and natural gas drilling and completion activities, especially when local gas resources are abundant. Two small-scale liquefaction plants have recently been commissioned in northeast B.C., a rapidly growing area for natural gas production.
• Several ferry companies in B.C. and Quebec have invested in LNG-fueled technology for existing ferries and have purchased new ferries with LNG capabilities. Ferries travel set routes, usually between two points, and tend to return back to dock every day, making accessing LNG refueling infrastructure relatively straightforward.
• There is considerable uncertainty related to the adoption of LNG as a diesel alternative in Canada. Technological development and the relative prices of natural gas and diesel are two of the largest uncertainties. The projections in EF 2016 assume gradual adoption of LNG in the areas described here. Due to the mentioned uncertainties, it is possible that adoption will be higher or lower than in these projections.
Growth of Solar Photovoltaic Electricity Generation
• In the past decade, global solar generation has grown significantly from a relatively small base. As shown in Figure 2.6, between 2004 and 2014, solar photovoltaic (PV) capacity worldwide increased from less than three gigawatts (GW) to 177 GW37. Approximately six per cent of power generated in Italy, Greece and Germany in 2014 came from PV power systems38. In the U.S., 6.2 GW of solar capacity came online in 2014, or 32 per cent of the new electricity generation capacity added, second only to natural gas capacity additions39. A significant portion of solar additions in the U.S. have been in California, which generated more than five per cent of its electricity from large scale, grid-connected solar sources. Other states, including Nevada, Arizona and New Jersey, produced more than one per cent of electricity from solar sources40. Programs and policies to encourage solar PV installations have played a role in the strong growth in these regions.
F I G U R E 2 . 6
Global Installed Photovoltaic Capacity
0 20 40 60 80 100 120 140 160 180 200 2004 2005 2006 2007 2008 2009 2010 2011 2012 2013 2014
Installed Solar Capacity GW
• Solar capacity in Ontario increased from 0.8 GW in 2012 to 1.2 GW in 201341. By the beginning of 2015, Ontario’s solar capacity reached 1.7 GW, or about 4.5 per cent of Ontario’s total installed capacity42. In the rest of the country, grid-connected PV capacity is quite small, totaling 10 megawatts (MW) in 201343. Canadian solar capacity remains modest from a global perspective and accounted for only 0.3 per cent of total Canadian electricity production in 201344. Future growth will likely depend on several factors, including local solar potential, costs and incentives, ease of integration with the existing grid, and further technological breakthroughs.
• Solar potential is especially high in arid and semi-arid areas close to the tropics45. Although Canada has a temperate climate, certain prairie cities including Regina, Calgary and Winnipeg have well above average solar potential. In much of Canada solar potential is generally higher than in Germany, which had the most installed solar PV capacity in the world as of 2014. This suggests there could be significant potential for higher adoption of solar in Canada46.
• One of the factors driving the increase in solar generation across the world is the decline in costs supported by technological advances and mass-manufacturing. Prices for solar panels have dropped from C$10.70 per watt in 2000 to C$0.95 per watt in 201347. In several regions of the world solar energy reached “grid-parity” meaning that the cost of PV systems fell to levels that are below the variable, per kilowatt-hour (kW.h) portion of retail electricity prices, making it price-competitive with other fuel sources48.
• Recent studies indicate that PV generation costs must decrease below retail electricity prices to become competitive without incentives49. The most significant support measures to date are Ontario’s Feed-in-Tariff (FIT) and microFIT programs which allow solar energy producers to sell their electricity to the province at a guaranteed price for a fixed contract term50,51. In the near term, support programs and their scope may determine the pace of growth of solar generation across Canada.
• Integrating solar generation with existing grids presents both challenges and opportunities. Infrastructure upgrades may be required to maintain grid safety and reliability due to the decentralized nature of solar generation. Electric systems must be able to balance substantial fluctuations in solar electricity production. This can be achieved by using flexible generation sources such as natural gas plants which can quickly increase or decrease generation, or with connections to resources in other electricity jurisdictions. In Canada, hydroelectric plants are well suited for this role. Water can be stored in hydroelectric reservoirs and then used to generate electricity when solar generation is not available. However, displacing affordable hydro power with more expensive solar may not be practical for some utilities.
• In some cases, consumers generating electricity from home solar installations compete with existing generators. This could lead to a decline in utilities’ customer bases and result in higher electricity costs for the remaining customers. While this is not yet an issue in Canada, some jurisdictions and industry groups in the U.S. have expressed concerns52. On the other hand, because solar installations often generate electricity during hours of the highest electricity demand, they could help reduce the need for additional generation and transmission facilities. Also, during times of peak demand electricity prices are usually higher, making solar an attractive option for consumers who are charged higher rates during peak periods.
• Further technological breakthroughs could improve the economics of solar generation and facilitate its integration. For example, continued development of utility scale electricity storage options would provide a boost to the solar industry. Currently, Ontario has plans to add 50 MW of electrical storage capacity to its system53.
• Examples from other countries show that solar can play a much bigger role in the electricity mix. Canadian solar capacity is expected to increase but the extent of this growth constitutes a major uncertainty in this report’s electricity assumptions. Growth of solar generation in Ontario has been robust, but growth in other provinces and territories has been slower. Consequently, the extent of solar penetration during the projection period remains highly speculative and will depend, in large part, on future policies and technology advancements.
Other Emerging Technologies
• In many cases, the most impactful technological advancements in energy happened quickly and were largely unexpected even a few years prior to their wide-scale adoption. The effect of recent advancements is evident in the projections in this report.
• A striking example of an abrupt change due to technology is the change in the outlook for natural gas production over the last eight years. In Energy Futures 2007 Report, total Canadian gas production was expected to steadily decline to 297 106m3/d (10.5 Bcf/d) by 203054. However, despite natural gas price assumptions that are approximately half of those assumed in 2007, production in EF 2016 is projected to be 490 106m3/d (17.3 Bcf/d) by 2030, or 65 per cent higher than in the 2007 Report.